FangQuant › Strategies
For there’s obvious collinearity between CSI300 and SSE50, the coefficients are in a two dimensional united distribution, which formed a curved surface with the residual sum of squares.
In the previous regression, the ridge regression had been used to calculated positive coefficients of CSI300 and SSE50 with a steady ridge trace and lessened covering effect of SSE50 on CSI300, with CSI300 : SSE50 = 3:5.
Further constraints had been added to calculate small residual sum of squares and neutralized the portfolio.
The constrains are as below:( We set the data range from 2016/1/15—2016/12/30 )

Regression on these constrains:
The residual sum of squares reached the minimum when a is at 0.032.
We observed the change of RSS when a is around 3.2:
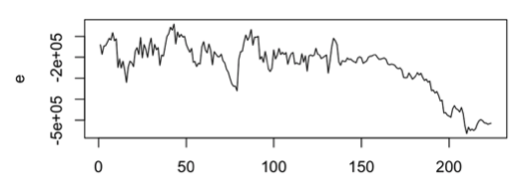
1、 e<-3*csi300+5*sse50-100*a50 (residual is negative)
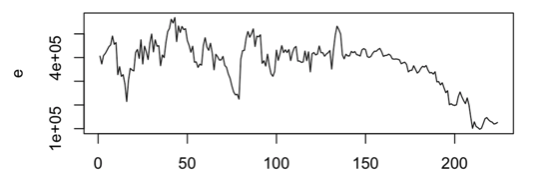
2、 e<-3.3*csi300+5.5*sse50-100*a50 (residual is positive)
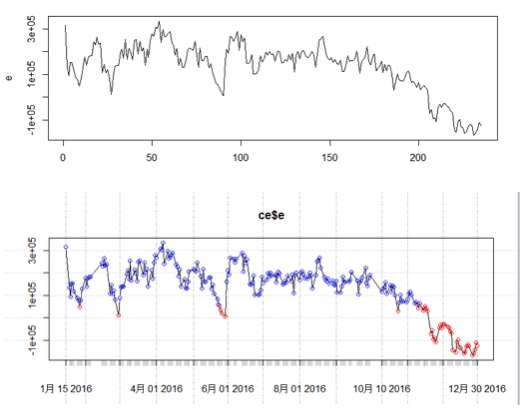
3、 e<-3.2*csi300+5.3*sse50-100*a50 (residual is neutralized)

We set coefficients for case 3 to integers by dividing 1.06:
4、e<-3*csi300+5*sse50-94*a50(residual neutralized)
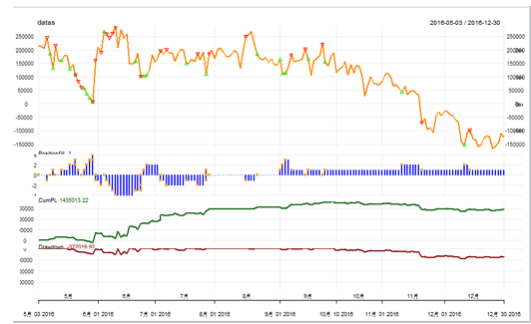
Simulation trading with Average Reverse Strategy generated result with N=10, T=60:

Copyright by FangQuant.com
Currently no Comments.
Hot Topics
The 13rd China International Future Forum
The Shanghai Derivatives Energy Forum has received extensive attention from relevant industries both within and outside the borders.
Financial institutions deep explore commodity market opportunities, commodity index financial products show full-scale trend
R-Code for analysis: getKDJ
New indicator to analyze the arbitrage opportunities between sse50 and csi500
R-Code@June 06, 2016
Market review: January 11, 2017
The Great China Bubble: Anniversary Lessons and Outlook
Quant Investment in China A-share market
The hedge strategy between SSE50 and A50--Jan 13,2017
The arbitraging strategy between CSI300 and SSE50
Market review: June 17, 2016
Sleepless in London--Enda Homan(Allied Irish Banks Plc)
MSCI Rebuffs Chinese Equities for Third Time in Blow to Xi
Soros, Druckenmiller among hedgies profiting in market plunge