FangQuant › Commodities Futures
In May 4th, one of the important varieties of the Dalian Commodity Exchange, iron ore futures, was formally opened to foreign traders. This is the second international futures variety after the crude oil futures. In view of the substantial demand for iron ore in the real economy of China, the iron ore futures trading has been highly concerned by the market and the regulatory layer, and its turnover is regarded as an important benchmark for the international pricing of iron ore.
However, the author notes that since May, the liquidity of the iron ore futures market is gradually shrinking. As we all know, iron ore and rebar are the relationship between upstream and downstream, and their historical price correlation is relatively high. There is a default empirical formula on the market: " Rebar = 1.6 * Iron Ore + 0.5 * Coke + 950," and there is a special arbitrage strategy based on it. Both are black metals, and iron ore is an important variety of the Dalian Commodity Exchange, and the rebar is the important variety of the SHFE, the volume of the history is relatively high, so there is a comparison between the two.
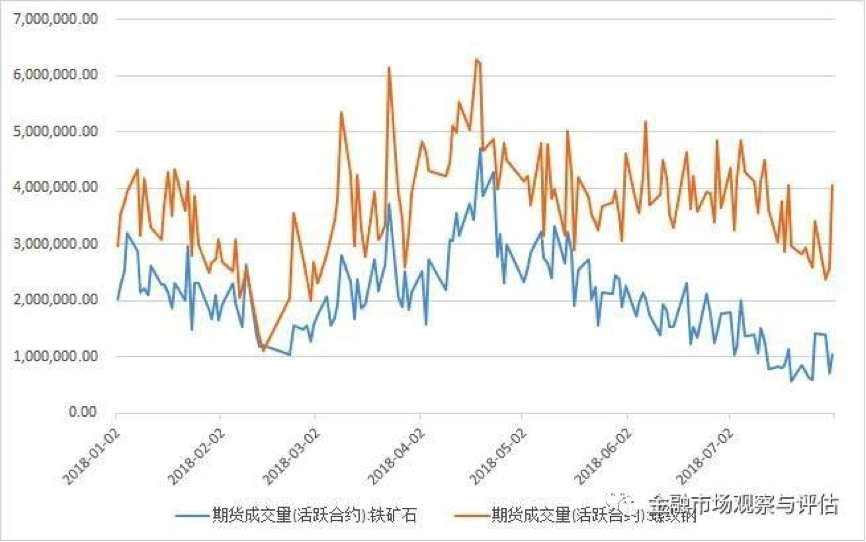
The following is a comparison volume between iron ore and rebar. It can be seen that since May, the turnover of active contracts for iron ore futures has shown a relatively clear downward trend. The minimum volume of trading has occurred in July, probably only 1/4 of the highest turnover at the end of April, a dramatic decline. In contrast, the turnover of the rebar active contract has declined in July, but it does not form a trend, and it is likely to be only a normal fluctuation in the sample.
The comparison of these amount and volume makes author suspect that the market liquidity of iron ore futures may also have changed. The market microstructure theory holds that the index of market liquidity by high frequency data can be divided into four categories: the real time trading volume, the Bid-ask spread, the price impact elasticity and the transaction velocity. But in practice, especially when the futures market of our country has limit up or down, there are many practical difficulties in calculating these indicators. For example, the Bid-ask spread is calculated with bilateral quotations, but if the liquidity is not good at a certain time, or when it touches the rise and fall, there is only one purchase price or selling price, and the price difference cannot be calculated. And when calculating the price shock elasticity, the denominator is the total volume of transactions at a certain time, and the molecule is the rate of return at that time. If futures prices touch down, then the molecule is zero and the elastic index is zero. According to the theory, liquidity is the best at this time, but in fact, the price is in the limit and there is no liquidity. The same is true of the calculated real time trading volume, when touching the drop stop, the thickness is only one-sided seal quantity or amount, the thicker the liquidity actually represents the worse, not the better.
In view of the above practical problems, the author thinks that it is more reasonable to use the "discontinuity" of transaction price per minute to measure market liquidity. If a species fails to make a transaction within a certain period of time, the transaction price will not change, and it will show an "electrocardiogram" shape. Conversely, if it is an active variety, its price trend will be more like a continuous smooth "Brown movement".
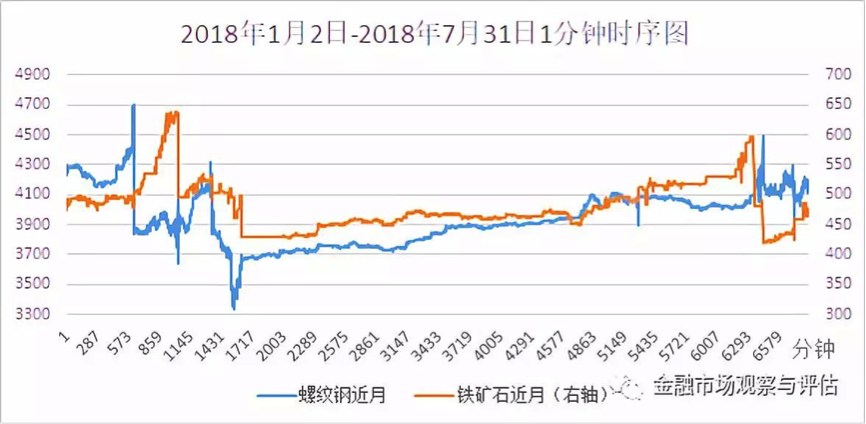
The next figure is the 1 minute price trend of iron ore and rebar since the beginning of the year. Through comparison, we can see that there are many short lines in the price trend of iron ore futures. This represents that there is no change in the price in a few minutes, which means the liquidity is worse. The price trend of rebar futures is relatively smooth, indicating that prices are continuously changing and liquidity is better.
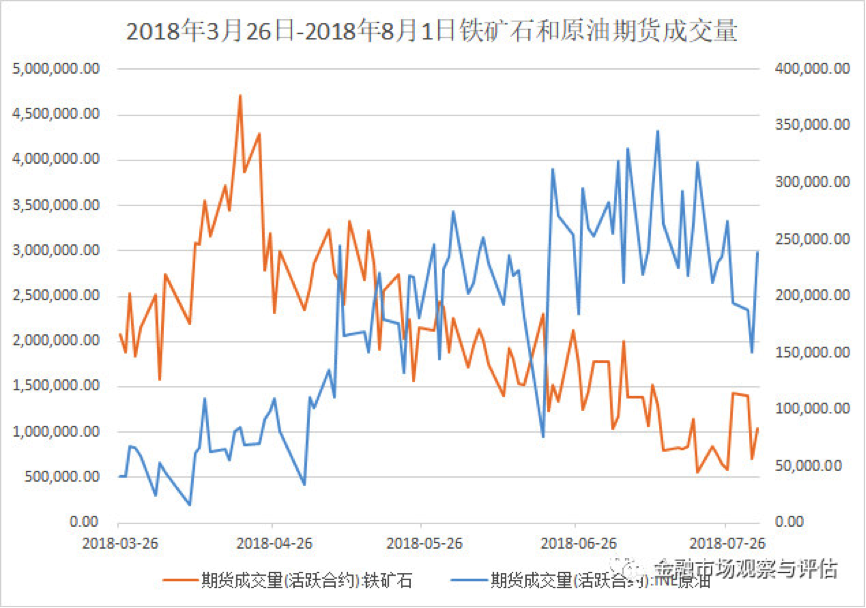
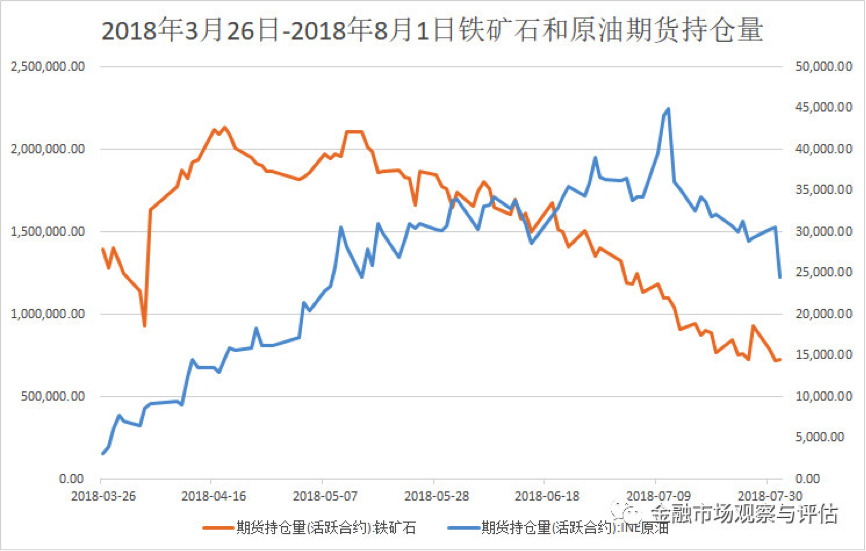
As the beginning of the paper, iron ore futures and crude oil futures are all newly opened to foreign traders this year, so we also try to compare the differences between the two. The following is a picture of the volume and position of crude oil futures since their listing.
So why is there such a change in microstructure? Why is it after May? The author does not have enough data to do academic research, but there are some conjectures for readers' reference. Since April, the market has been spread. The main reason for the dramatic changes in the price trend of iron ore futures is the emergence of traders who have a greater influence on market prices. The traders engaged in some price manipulated trading strategies, causing a devastating blow to high frequency traders in the iron ore futures market, causing these high frequency traders to leave. A considerable portion of the trading volume in the iron ore futures market was provided by high frequency traders, which led to a sharp decline in the liquidity of the market.
Another possible reason is the increasing number of digital currency transactions. Although regulators still hold a cautious or even controversial attitude towards digital currencies, it is undeniable that the volume of digital currency transactions is experiencing an unprecedented rapid growth. This process will also attract some investors in the futures market, including the iron ore futures market, to participate in the digital currency trading, resulting in the shrinkage of the iron ore futures trading. However, there is a problem with this conjecture, that is, it cannot explain why other futures varieties have not seen such a drop in liquidity as iron ore futures.
今年5月4日大连商品交易所的当家品种之一,铁矿石期货,正式引入境外交易者,这是继3月份原油期货上市后的第二个国际化期货品种。鉴于我国实体经济对铁矿石的大量需求,铁矿石期货交易一直受到市场和监管层的高度关注,其成交量被视为事关铁矿石国际定价话语权的重要标杆。
但是笔者注意到,自5月份以来,铁矿石期货市场的流动性正在逐步走向萎缩。众所周知,铁矿石跟螺纹钢是上游跟下游的关系,其历史价格相关性比较高。市场上有个默认的经验公式:“螺纹钢 = 1.6 * 铁矿石 + 0.5 * 焦炭 + 950”,基于此还有专门的套利策略。两者又同是黑色金属,铁矿石是大商所的重要品种,而螺纹钢是上期所的重要品种,历史上成交量都比较高,因此这两者之间可以做一个比较。
下图为铁矿石与螺纹钢在成交量上的对比。可以看到,自5月份以来,铁矿石期货活跃合约的成交量呈现比较明显的下降趋势,最低成交量发生在7月份,大概只有4月底最高成交量的四分之一,下降幅度惊人。而相比之下,螺纹钢活跃合约的成交量虽然在7月份有所下滑,但并没有形成趋势性,极可能只是样本内的正常波动。
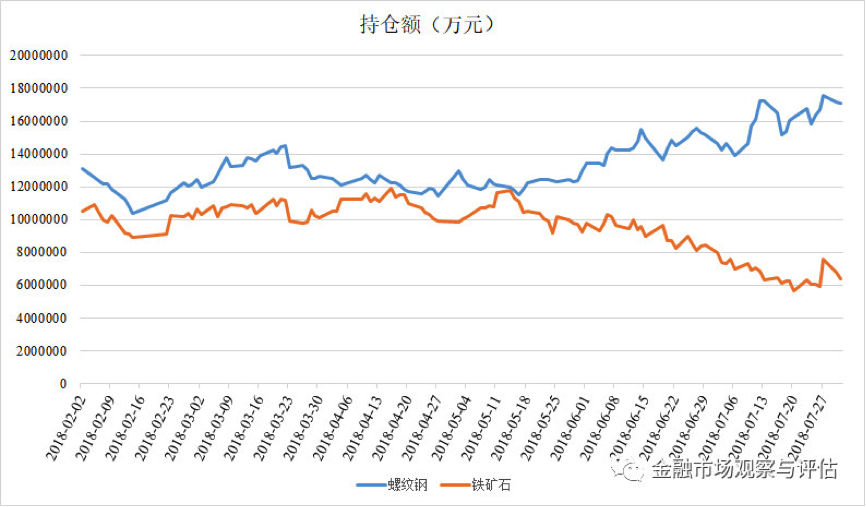
下图为铁矿石与螺纹钢在持仓金额上的对比。很明显,在5月份之前,两者在持仓数据方面的表现相当。但5月份之后,两者走势出现了明显的分化,铁矿石期货的持仓额发生了显著的净流出现象,而螺纹钢期货的持仓额走势完全相反,呈现净流入。
这些资金面和成交量的对比让笔者怀疑铁矿石期货的市场流动性可能也产生了一些变化。市场微结构理论认为,用高频数据来衡量市场流动性的指标可以分为四类:报单厚度、买卖价差、价格冲击弹性和成交速度。但是在实际运用中,尤其是我国期货市场设置有涨跌停板的情况下,很多时候计算这些指标会产生一些实际困难。比如买卖价差的计算,需要用到双边报价,但是如果某时刻内流动性不好,或者触及涨跌停板,那么就只有一个买价或者卖价,无法计算价差。再比如计算价格冲击弹性时,其分母是某段时刻的成交总量,而分子是该段时刻的回报率。如果期货价格触及跌停,此时分子为零,弹性指标也即为零。按照理论,此时流动性最佳,但其实价格在跌停位,并没有任何流动性。计算厚度也是如此,当触及跌停时,厚度只是单边的封单数量或金额,越厚其实代表流动性越差,而不是越好。
考虑到以上实际问题,笔者认为采用每分钟成交价的“非连续性”来衡量市场流动性可能更加合理。如果某品种在一段时间内不成交,则成交价不会发生变化,会呈现出“心电图”状。而反之如果是成交活跃的品种,其价格走势会更像一个连续平滑的“布朗运动”。
下图为铁矿石与螺纹钢自年初至今的1分钟价格走势图,通过对比可以看到,铁矿石期货的价格走势中有很多短平线段,这代表在数分钟内价格没有发生任何变化,意味着流动性变差了。而螺纹钢期货的价格走势相对比较平滑,说明价格在连续变动,流动性较好。
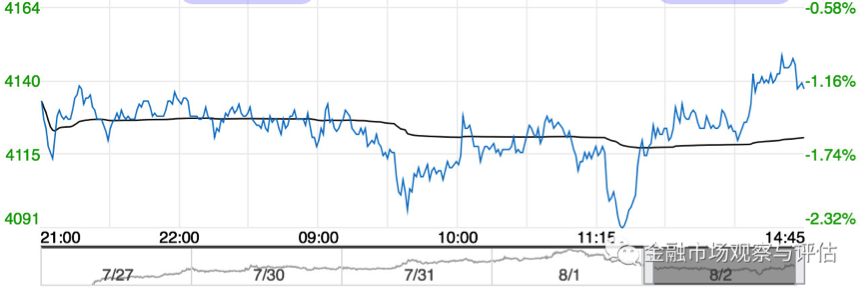
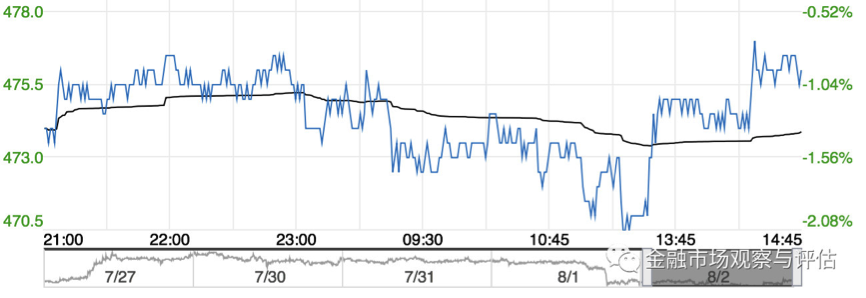
为了进一步说明这个问题,笔者将最近几天的铁矿石期货和螺纹钢期货的分时图进行了对比。第一张图为螺纹钢期货,价格变动较为平滑和连续;第二张图为铁矿石期货,价格变动就明显较多锯齿:
如开篇所讲,铁矿石期货和原油期货都是今年刚引入境外交易者的品种,因此我们也试着比较一下这两者之间的差异。下图为原油期货上市以来两者在成交量和持仓量上的情况:
同样,笔者发现原油期货的成交量和持仓量呈现较为明显的上涨趋势,而铁矿石期货的情况刚好相反,而这些转折点都发生在今年5月份左右。综上所述,我们有足够的数据说明,铁矿石期货的市场流动性确实变差了,无论在成交量、持仓量还是价格连续性上,都在今年5月份之后急剧下降。
那么为什么会出现这样的微结构变化呢?为什么在5月份之后?笔者没有足够的数据做学术研究,但是有一些猜想,供读者参考。4月份以来,市场上一直流传,大商所铁矿石期货价格走势发生剧烈变化的重要原因是出现了对市场价格影响力较大的交易者。这个(些)交易者从事一些疑似价格操纵的交易策略,对原来铁矿石期货市场中的高频交易者造成了毁灭性的打击,直至这些高频交易者纷纷离场。本来铁矿石期货市场上的成交量中就有相当一部分是高频交易者提供的,这些人的黯然离场导致了市场流动性的急剧下滑。
另外一个可能的原因是数字货币交易的日益增长。尽管各国监管层对数字货币仍然持有谨慎甚至争议的态度,但不可否认地是,数字货币交易量正经历前所未有的快速增长。这个过程中也会吸引一些原来在期货市场包括铁矿石期货市场中的投资者参加数字货币交易,导致铁矿石期货交易的萎缩。不过,这个猜想存在一个问题,即它不能解释为什么其他期货品种并没有出现铁矿石期货这样的流动性下滑。
Currently no Comments.
Hot Topics
The 13rd China International Future Forum
The Shanghai Derivatives Energy Forum has received extensive attention from relevant industries both within and outside the borders.
Financial institutions deep explore commodity market opportunities, commodity index financial products show full-scale trend
R-Code for analysis: getKDJ
R-Code@June 06, 2016
New indicator to analyze the arbitrage opportunities between sse50 and csi500
Market review: January 11, 2017
The Great China Bubble: Anniversary Lessons and Outlook
Quant Investment in China A-share market
The hedge strategy between SSE50 and A50--Jan 13,2017
The arbitraging strategy between CSI300 and SSE50
Market review: June 17, 2016
Sleepless in London--Enda Homan(Allied Irish Banks Plc)
MSCI Rebuffs Chinese Equities for Third Time in Blow to Xi
Soros, Druckenmiller among hedgies profiting in market plunge