FangQuant › Commodities Futures
Part A: Review (2019/1/7-2019/1/11)
From January 7, 2019 to January 11, 2019:the closing price of iron ore futures I1905 contract on Friday was 509 yuan, 2 yuan lower than the closing price of the last trading day of last week. The highest price for this week is 517 yuan/ton, and the lowest point is 505 yuan/ton.
This week (2019/1/7-2019/1/11), the total volume of the main contract was 3,981,500 lots, a decrease of 1,431,456 lots from last week. After the close of trading this Friday, the open interest of the main contract was 833,198 lots, a decrease of 52,420 lots from the last trading day of last week.
Notes: The main contract refers to the futures contract with the maximum open interest.
Part B: Market Dynamics
1.Inventory
(1) Port stock of imported iron ore
Under the background of the country's policy of increasing environmental protection and production limits in various regions, the blast furnace start-up of steel mills has been suppressed. In order to increase the production capacity per unit, steel mills' demand for high-quality mines has gradually increased.
According to the inventory data of 45 ports of Mysteel, as of January 11, the inventory of imported mines at 45 ports was 141.82 million tons, a decrease of 1.06 million tons from last week.
Among them, the Australian mine inventory was 75.93 million tons, down 998,900 tons from last week; the Brazilian mine inventory was 35.85 million tons, up 169,600 tons from last week.
The stock of lump ore was 15.56 million tons, a decrease of 30,300 tons from last week; the inventory of pellets was 3,961,700 tons, an increase of 332,500 tons from last week; the inventory of iron concentrate was 7,364,500 tons, a decrease of 370,300 tons from last week.
(2) Available days of steel mill inventory
As of January 11, the average available days of imported iron ore stocks in domestic
large and medium-sized steel mills was 30 days.
This week(2019/1/7-2019/1/11), Mysteel surveyed 247 steel mills with a blast furnace
operating rate of 75.03%, up 0.23% from the previous week and down 0.93% year-on- year; blast furnace ironmaking capacity utilization rate was 76.42%, up 0.39% from the previous week and up 1.19% from the previous year; Steel mill profit rate is 77.73%, up 1.62% from the previous week; the daily average molten iron output was 2,136,900 tons, an increase of 10,800 tons from the previous week and an increase of 33,400 tons year- on-year.
Part C: Transaction Summary
Since 2018/3/26 and up to 2019/1/11 closing, China iron ore futures’ cumulative trading volumes is 356.75 million lots and the cumulative amount of transaction is 17.03 trillion yuan.
Average daily turnover of 1,810,901 lots (2018/3/26-2019/1/11). Open interest declined steadily, with 2,224,492 lots on 2018/3/26 and 1,111,526 lots after the closing of 2019/1/11.
Because DCE raised the delivery quality standards for iron ore futures at the end of 2017, the volume and open interest of iron ore futures showed a downward trend.
Graph: Sum of All DCE Iron Ore Future contracts (2018/3/26-2019/1/11)

|
Graph: Volume (2018/9/3-2019/1/11) |
Graph: Open Interest (2018/9/3-2019/1/11) |
 |
 |
Graph: I1809 and I1901 and I1905 contracts account for the most share of trading volume and open interest (2018/3/26-2019/1/11)
Graph: Average trading distribution over the day (2018/3/26-2019/1/11)

Graph: Average trading distribution over the day (2018/3/26-2019/1/11)
Graph: Daily Fluctuation Range of I.DCE (2018/3/26-2019/1/11)

We can see that the amplitude of Chinese iron ore future in most of the time is lower than 4%, indicating that Chinese iron ore future did not have excessive fluctuations in the day.
Part D: Correlation Analysis
Graph :Price of 2 Iron Ore futures(in CNY,2018/3/26-2019/1/11)

Table:Correlation of 2 Iron Ore futures(in CNY,2018/3/26-2019/1/11)
|
|
I.DCE |
I.DCE FEF.SGX |
|
I.DCE |
1 |
|
|
I.DCE FEF.SGX |
|
1 |
Graph: Price of I.DCE and Iron Ore 62% Fe, CFR North China (Platts) (2018/3/26-2019/1/11)
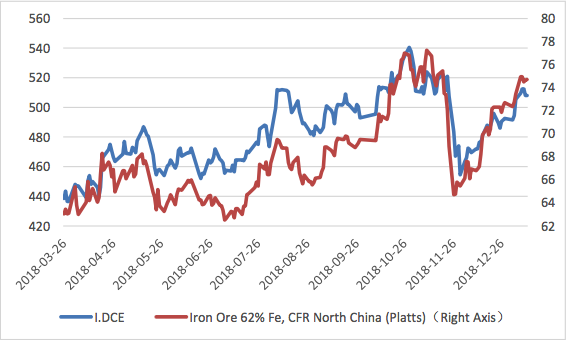
Table:Correlation of I.DCE and Iron Ore 62% Fe, CFR North China (Platts) (in CNY,2018/3/26-2019/1/11)
|
|
I.DCE |
Iron Ore 62% Fe, CFR North China (Platts) |
|
I.DCE |
1 |
|
|
Iron Ore 62% Fe, CFR North China (Platts) |
0.9188 | 1 |
Table:Correlation between iron ore future and other related futures in China (in CNY,2018/3/26-2019/1/11)
|
|
I.DCE | RB.SHF | HC.SHF |
| I.DCE | 1 |
|
|
| RB.SHF | 0.537457 | 1 |
|
| HC.SHF | 0.531144 | 0.764275 | 1 |
As can be seen from the above table, the correlation between China's iron ore future and domestic major related futures is rather significant. The correlation with Rebar future is 53.75%. The trend of hot rolled coil future is also very close to iron ore future, the correlation is more than 53%. On the one hand, the high correlation will stimulate the continuous influx of arbitrage funds, which will help to enrich and optimize the strategy; On the other hand, it is also a sign that China's iron ore future market is maturing, which is conducive to the function of price discovery. It also has great significance for enterprises to use futures tools for hedging.
Graph: I.DCE settle price and USD/CNY (2018/3/26-2019/1/11)

It can be seen that China's iron ore future and the RMB exchange rate are obviously negatively correlated.
Part E: Spread Analysis
Graph :Spread(DCE-SGX)(in CNY,2018/3/26-2019/1/10)

Graph : Spread (I1812 –I1901) (in CNY,2018/3/26-2018/12/14)

Graph : Spread (I1901 –I1905) (in CNY,2018/5/16-2019/1/11)

Graph: Platts Iron Ore Price Index(in USD,2010/4/14-2019/1/10)

Graph:Grade Spread(in USD,2010/4/14-2019/1/10)

Graph:Iron Ore Freight Rate (in USD,2009/1/12-2019/1/10)

Copyright by Fangquant.com
Currently no Comments.
Hot Topics
The 13rd China International Future Forum
The Shanghai Derivatives Energy Forum has received extensive attention from relevant industries both within and outside the borders.
Financial institutions deep explore commodity market opportunities, commodity index financial products show full-scale trend
R-Code for analysis: getKDJ
R-Code@June 06, 2016
New indicator to analyze the arbitrage opportunities between sse50 and csi500
Market review: January 11, 2017
The Great China Bubble: Anniversary Lessons and Outlook
Quant Investment in China A-share market
The hedge strategy between SSE50 and A50--Jan 13,2017
The arbitraging strategy between CSI300 and SSE50
Market review: June 17, 2016
Sleepless in London--Enda Homan(Allied Irish Banks Plc)
MSCI Rebuffs Chinese Equities for Third Time in Blow to Xi
Soros, Druckenmiller among hedgies profiting in market plunge