FangQuant › Financial Futures
A. Improvement of Monetary Conditions
With the shift from "deleveraging" to "stable leverage" in June last year, as well as further monetary policy (reduction, creation of new policy tools, etc.). We believe that the monetary level can be further improved in 2019. In terms of indicators, M2 growth will rebound from 8%.
Graph 1: M1 and M2 and their growth rate changes

Specifically, there are several reasons to support the improvement of monetary conditions:
(1) Both CPI and PPI are depressed, and deflation risk is prominent. In December 2018, CPI was 1.9% year-on-year, ring-to-ring ratio was 0%, PPI was 0.9% year-on-year, ring-to-ring ratio was - 1.0%. All of them fell again, at a lower level, reflecting downward economic pressure. The downturn of CPI indicates that there is no risk of rising inflation, which provides the central bank with room for monetary policy to operate. The downturn of PPI leads to the downturn of corporate profits and the rise of real interest rates, which also promotes the demand for monetary expansion.
Graph 2: CPI(%)

Graph 3: PPI (%)

(2) The recent appreciation of the RMB has eased the pressure on foreign exchange and created space for monetary policy. As we all know, the positive monetary policy increases the money supply and lowers interest rates, which exerts obvious pressure on the value of the currency. Maintaining currency stability will constrain monetary policy. However, due to the recent rise of the RMB exchange rate to around 6.75, the risk of breaking the important gateway 7 is reduced.

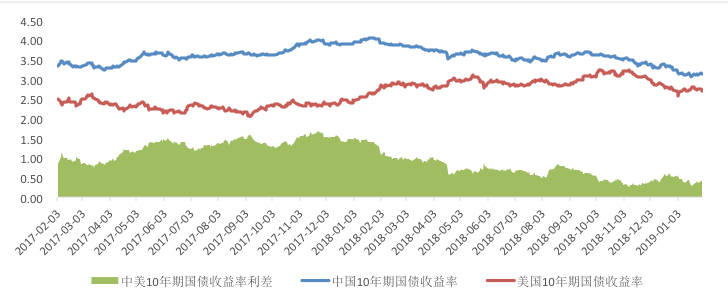
Basically, the industry believes that the US economy is at its peak and the pace of interest rate increase is expected to slow down or even withdraw from the rate increase in 2019; the yield on US bonds has dropped from more than 3% to 2.7%, so even if the yield on Chinese bonds has declined, the spread between China and the US has not been further narrowed, thus alleviating the pressure of RMB devaluation. All these provide space for monetary policy.
Graph 5: 10-year Treasury Bond Yield and Spread (%) between China and the United States
(3) The credit level is tense and needs structural monetary policy adjustment. From the 10-year yield difference of AAA, AA, A-level corporate bonds and 10-year bonds, the risk-free interest rate (i.e., 10-year bond yield) has been at a relatively low level (unfortunately, before 2014/12/10, no A-level corporate bond yield data can be gained by Wind), the current ranking (2019/1/25) is lower than 30%; AAA, AA and other levels reflect the credit level of large enterprises such as state-owned enterprises and listed enterprises; the trend of the ranking quantile is basically the same as the interest rate level (36.4% and 32.9% at present); but the credit spreads of the low rating (A) are at a high level, and the ranking of the current A-level corporate bond and bond yield spreads is at the historical level of 86.2%. Therefore, the level of interest rate deviates significantly from the level of low credit spreads. In view of the fact that the A-grade corporate bond reflects the credit level of low-rated small and medium-sized private enterprises to a certain extent, this data can also prove that banks are reluctant to lend to small and medium-sized enterprises, resulting in the financing level of small and medium-sized enterprises still high under the background of low interest rates; that is, the situation of broad currency and tight credit. Therefore, we believe that the market will maintain demand for structured monetary policy adjustments by the central bank until the deviation between interest rates and low credit ratings is eliminated.
Graph 6: The difference between 10-year AAA, AA, A corporate bonds and bond yields and 10-year bond yields (%)

Graph 7: The historical ranking quantile level of 10-year AAA, AA, A-grade corporate bonds and bond yields and 10-year bond yields

At the same time, the central bank has the following means to improve monetary conditions:
(1) Central Bank lowers the reserve ratio and raises the currency multiplier
Although the reserve ratio has been lowered many times in 2018 and again in January 2019, the reserve ratio of large deposit financial institutions is 13.5%, and that of small and medium-sized deposit financial institutions is 11.5%. Compared with the current US deposit reserve ratio of 2.2%, China's reserve ratio is still very high, and there is still room for reduction.
At the same time, throughout the world, other major developed countries, such as Britain, Canada, Switzerland, Japan and so on, have reduced or cancelled the statutory reserve ratio. The ECB retains a lower reserve ratio, but does not use it as a regulatory tool. The main reason is the change of the main intermediary target of these central banks' monetary policy, that is, the loss of the status of money supply as the intermediary target of policy. It is precisely because of the reduction of the importance of the total monetary target or simply the abolition of the total monetary target that the statutory deposit reserve system, whose main objective is to control the money supply, loses its basis. Therefore, in these countries, commercial banks adjust the reserve ratio according to their own needs and risk control.
On the one hand, compared with the Federal Reserve, China's reserve ratio is still high, there is room for a substantial decline; on the other hand, with the gradual promotion of interest rate marketization in China, the target status of monetary aggregate control has declined, and the central bank's monetary policy tools are constantly enriched, there is a tendency to gradually reduce the reserve ratio until the reserve ratio is abolished as a means of monetary policy control. Therefore, further reduction of the central bank's benchmark is expected.
Graph 8: Reserve Ratio(%)

(2) Enriching monetary policy tools and adjusting the current unbalanced credit pattern.
In view of the credit tension mentioned above, there has been a deviation between lower interest rates and higher spreads on low-rated credit. Monetary policy regulation should pay more attention to the direction of capital investment and smooth policy transmission. Let the funds reach small and middle enterprises as far as possible, rather than detain the banking system, so as to avoid flooding. At present, the new monetary policy instruments launched by the central bank are aiming at this purpose.
Recently (2019/1/25), the Central Bank Bills Swap (CBS) was launched by the Central Bank to support banks to issue supplementary capital for sustainable debt. As the increase of risky assets of banks will accelerate capital consumption, the lack of sufficient capital strength and capacity will hinder credit expansion in the future. As an important channel for commercial banks to supplement other first-class capital, sustainable bonds need to calculate venture capital in the process of inter-bank pledge financing, which reduces its attraction to commercial banks. Therefore, the central bank creates CBS by using central bank pledge financing, and the venture capital is raised to 0, which no longer occupies the venture capital of other commercial banks, so as to enhance the willingness of capital market to subscribe to the bank's sustainable bonds. The market liquidity of high bank's sustainable bonds contributes to credit expansion.
Last year, the central bank set up a target medium-term lending facility (TMLF) on December 19. Oriented medium-term lending facilitation rate is 15 basis points lower than medium-term lending facilitation (MLF) interest rate, intending to further increase financial support for the real economy, especially small and micro enterprises, private enterprises and other key areas. Large banks play an important role in supporting small and micro enterprises and private enterprises. Directed medium-term lending facilitation can provide them with a relatively stable long-term source of funds, enhance the credit supply capacity of small and micro enterprises and private enterprises, reduce financing costs, and improve the liquidity structure of commercial banks and financial markets, and maintain a reasonable and abundant market liquidity.
B. Further inflows of foreign capital
We believe that in 2019, foreign investment will continue to inflow through QFII and Stock Connect channels. Although the cumulative inflows in 2018 have reached new highs, the inflows in January 2019 are still booming. At the same time, the doubling of QFII quota also creates space for foreign capital inflows.
Graph 9: Funds inflow via Stock Connect

Overall, we believe that there are the following reasons to support further inflows of foreign capital into A shares:
(1) A-share valuation is attractive
From PE and PB perspective, compared with the past, the market is at a low level, and compared with other global stock markets, but the growth prospects of China's market are not at a low level. So valuation is attractive to foreign investment.
Specifically, compared with history, the valuation of main A-share indexes we examined, the Shanghai Composite Index, the SSE50, CSI300 300, and CSI500 are all at historic lows. Their PE (in 2019/1/25) were 11.5009, 8.9480, 10.7401 and 16.8384, respectively. The corresponding historical rankings (in recent five years) were 20.70%, 21.30%, 21.20% and 1.80% respectively.
|
Graph 10:PE of Shanghai Composite Index, SSE50, CSI300,
CSI500 |
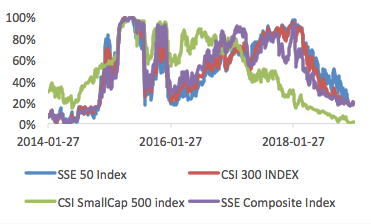
Graph 11:Their PE ranking |
 |
 |
Their PB (in 2019/1/25) were 1.2886, 1.1249, 1.3098 and 1.6012 respectively, and their corresponding historical (in recent five years) rankings were 9.40%, 9.90%, 15.70% and 2.80% respectively.
PB, PE are at a
historic low level, especially in the CSI500, PE and PB are almost at the
bottom of the history.
Valuation of A
shares is also at a low level compared with other global stock markets. Among
them, the representative indexes such as Shanghai-Shenzhen 300 and Shanghai 50
are more attractive than the main indexes of developed countries such as Europe
and the United States. From this point of view, foreign capital inflows will
also tend to be larger-capitalized stocks and weighted stocks.
Table 1: 2019/1/25 Comparison of valuation of major
stock indexes in China and the world
Of course, the attractiveness of valuation
does not simply mean that valuation is relatively low and ignores market growth
potential. In fact, as the world's second largest economy, China is still an
important engine of world economic growth. In 2018, China's GDP actually grew
by 6.4%, ranking in the forefront of the world. Despite downward pressure, even
if GDP falls back to about 6%, it will still grow higher than other countries,
especially developed countries in Europe and the United States. Therefore, the
reasonable valuation should not be lower than the developed countries' stock
index. Therefore, there should be upward repair space in valuation, and the
current low valuation is attractive.
(2) Further opening to the outside world in
domestic policy
With the further implementation of opening
up in the financial field, it is more convenient for foreign capital to enter
China.
In general, a
series of symbolic opening measures have landed one after another, which means
that China's capital market has entered a new stage of opening to the outside
world. Especially with the continuous acceleration of the opening up of China's
capital market and the increasing attraction of the capital market, the
proportion of foreign investors holding financial assets such as stocks, bonds
and futures will further increase.
For examples,
the share-holding ratio of foreign securities firms was liberalized to 51% in
2018, UBS Securities became the first foreign-owned holding securities firm;
QFII quota doubled to 300 billion US dollars in January 2019; and the central
bank's filing of S&P Global Inc., a wholly-owned subsidiary of S&P
Global Inc., in Beijing.
The opening of
foreign capital to China also shows recognition, and the incorporation of A-shares
into MSCI and FTSE Russel is its recognition mark. In June 2018, the entry of A-shares
into the MSCI index came into effect; with the first batch of more than 200
shares formally included in the MSCI index, China's stock market ushered in the
strongest and most sustainable participation of international institutional
investors. Following the incorporation of MSCI, the pace of
internationalization of A-shares continued to advance in 2018: On September 27,
FTSE Russell, the world's second largest index company, announced that it would
incorporate A shares into its global stock index system and classify them into
sub-emerging markets, which would be implemented in June 2019. At the same
time, with the further improvement of opening to the outside world and the
further improvement of investability, the proportion of A-shares in MSCI and
FTSE Russel is expected to further improve.
(3) The financial market will be further
improved, especially the derivatives will be further enriched.
In 2019, the financial market will be
further improved, especially the derivatives will be further enriched, and more
diversified products will further meet the needs of foreign investment.
Specifically, the landing of Scientific Innovation board, the introduction of
new derivatives, and the trend of loosening stock index futures have attracted
foreign capital inflows from different perspectives.
With the landing of the Scientific
Innovation board and the implementation of the pilot registration system, the
variety of A-share stocks is more diverse, and foreign investment will have
more choices. Unlike the approved issuance, under the registration system, the
profit requirements of enterprises are reduced, and more temporarily
unprofitable high-tech enterprises are allowed to go public, thus enriching the
types of A-share stocks and generating more investment opportunities. In
addition, the implementation of the registration system is gradually in line with
the capital markets of developed countries, which will also enhance the
recognition of foreign traders on China's capital markets.
At present, the derivatives market is
developing rapidly. With the continuous enrichment and improvement of
derivatives, it can further meet the needs of complex investment strategies and
attract foreign investment. In recent years, the variety of futures and options
has gradually enriched, which can further meet the diversified investment
needs.
In addition, the stock index futures
trading is loosening, and trading is expected to revive. The loosening policy
of CFFEX on December 2 is conducive to the development of the futures market.
In 2019, it is expected to further loosen the bond and further expand the stock
index futures market.
C、About the unexpected
decrease in annual report
The shares which performance declined sharply mainly
concentrated in small and medium-sized stocks, rather than weight stocks, which
had limited impact on the index. Recently, there
have been some stock performance thunderstorms, which have caused great losses
to the investors involved As it can be seen from Table 2, Table 3: from SSE50
to CSI300, CSI500 to all A-shares, the percentage of performance declining
stocks at all levels (- 50%, 100%, 500%, 1000%, 2000%) increased significantly.
Therefore, on the whole, if net profit (TTM) falls to -500% as performance thunderstorm,
SSE50 fully evades performance thunderstorm stocks due to the characteristics
of index compilation rules. Only ZTE in CSI300 experienced significant
performance drop due to it was the victim of China-US trade war (ZTE should not
have thunderstorm if not for US sanctions, and the stock selection mechanism of
Shanghai 300 can still be regarded as an effective mechanism to evade
performance thunderstorm stocks). In CSI500, the proportion of performance
thunderstorm stocks (1.00%) is also significantly lower than that of the market
as a whole (2.48%). Therefore, the main stock index can effectively avoid performance
thunderstorm stocks.
Copyright by fangquant.com
Graph 12:PB of Shanghai Composite Index, SSE50, CSI300, CSI500
Graph 13:Their PB ranking


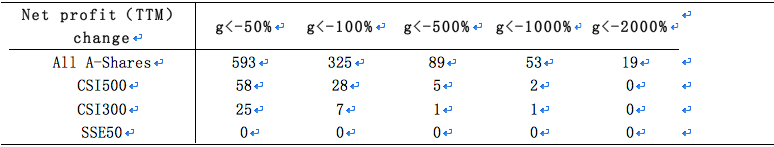 Table 3: The proportion of stocks with deteriorating
performance at all levels (set net profit of P0 in the previous year and P1 in
this year: if P 0 > 0, g = P 1/P 1; if P 0 < 0, g= - P 1/P + 1)
Table 3: The proportion of stocks with deteriorating
performance at all levels (set net profit of P0 in the previous year and P1 in
this year: if P 0 > 0, g = P 1/P 1; if P 0 < 0, g= - P 1/P + 1)

Currently no Comments.
Hot Topics
The 13rd China International Future Forum
The Shanghai Derivatives Energy Forum has received extensive attention from relevant industries both within and outside the borders.
Financial institutions deep explore commodity market opportunities, commodity index financial products show full-scale trend
R-Code for analysis: getKDJ
New indicator to analyze the arbitrage opportunities between sse50 and csi500
R-Code@June 06, 2016
Market review: January 11, 2017
The Great China Bubble: Anniversary Lessons and Outlook
Quant Investment in China A-share market
The hedge strategy between SSE50 and A50--Jan 13,2017
The arbitraging strategy between CSI300 and SSE50
Market review: June 17, 2016
Sleepless in London--Enda Homan(Allied Irish Banks Plc)
MSCI Rebuffs Chinese Equities for Third Time in Blow to Xi
Soros, Druckenmiller among hedgies profiting in market plunge