Part A: Review (2019/2/18-2019/2/22)
From February 18, 2019 to February 22, 2019:the closing price of the main contract of crude oil futures of INE on Friday was 456.8 yuan/barrel, 12.5 yuan higher than the closing price of the last trading day of last week. The highest price for this week is 467.9 yuan/barrel, and the lowest point is 450.5 yuan/barrel.
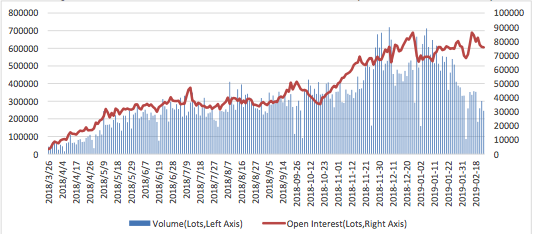
This week (2019/2/18-2019/2/22), the total volume of the main contract was 1,135,858 lots, a decrease of 64,440 lots from last week. After the close of trading this Friday, the open interest of the main contract was 47,084 lots, a decrease of 17,986 lots from the last trading day of last week.
Notes: The main contract refers to the futures contract with the maximum open interest.
Part B: Transaction Summary
Since 2018/3/26 and up to 2019/2/22 closing, Shanghai crude oil futures’ cumulative trading volumes is 67.20 million lots, and the cumulative trading volumes of the first month of listing (2018/3/26-2018/4/25) is 1.33 million lots. The cumulative amount of transaction is 31.48 trillion yuan (2018/3/26-2019/2/22), which is 55.51 times that of the cumulative amount of the first month of listing.
Average daily turnover of the main contract is 1,135,858 lots (2019/2/18-2019/2/22), and average daily turnover of the main contract is 1,200,298 lots (2019/2/11- 2019/2/15). Open interest of all the contracts of crude oil futures of INE also rised steadily, with 3,558 lots on 2018/3/26 and 75,786 lots after the closing of 2019/2/22.
Graph: Sum of All INE Crude Oil Future contracts (2018/3/26-2019/2/22)

|
Graph: Volume (2018/12/24-2019/2/22) |
Graph: Open Interest (2018/12/24-2019/2/22) |
 |
 |
Graph: SC1812 and SC1901 and SC1902 and SC1903 and SC1904 contracts account for the most share of trading volume and open interest (2018/8/1-2019/2/22)

Graph: Average trading distribution over the day (2018/3/26-2019/2/22)

Graph: Daily Fluctuation Range (2018/3/26-2019/2/22)

Compared with the intra day high and low volatility of three major crude oil futures, the amplitude of Chinese crude oil futures in most of the time is lower than Brent and WTI, indicating that Chinese crude oil futures did not have excessive fluctuations in the day because of the significant speculative ratio and the short time of the market.
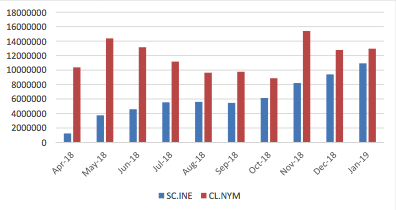
Graph: Volume (SC.INE and CL.NYM)

Graph: Volume (SC.INE and B.IPE)

As can be seen from the above graph, since August 2018, the volume of SC.INE has exceeded the volume of B.IPE.
Part C: Correlation analysis
Graph :Price of 3 crude oil futures(in CNY,2018/3/26-2019/2/22)

Table:Correlation of three crude oil futures (2018/3/26-2019/2/22)
|
|
SC | Brent | WTI |
| SC | 1 |
|
|
| Brent | 0.942501 | 1 |
|
| WTI | 0.849011 | 0.937043 |
1 |
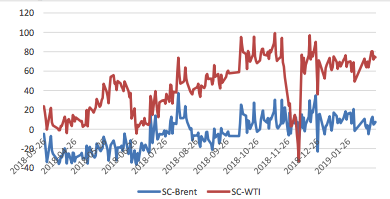
It can be seen that the SC-Brent spread was kept in a stable range, with almost no risk-free arbitrage opportunities. The spread of the price difference with WTI was huge and the high and low points were more than 100 CNY/barrel, which may due to that WTI crude oil cannot be used as the delivery of INE. Therefore, the link between SC and WTI price is not as close as that between Brent and Oman.
Table:Correlation between crude oil futures and major chemical futures in China (2018/3/26-2019/2/22)
| Correlation | Brent | WTI | asphalt | Polypropylene | Polyvinyl chloride | Pure Terephthalic Acid | Linear Low Density Polyethylene | Methanol |
| Firsr month of listing | 0.8437 | 0.8444 | 0.2435 | 0.1122 | 0.5681 | 0.9172 | -0.0234 | -0.1445 |
| Listed so far | 0.9466 | 0.8540 | 0.9355 | 0.9221 | 0.4294 | 0.6877 | 0.7147 |
0.9047 |
Graph: SC.INE close price and USD/CNY (2018/3/26-2019/2/22)

It can be seen that China's crude oil futures and the RMB exchange rate are obviously negatively correlated.
Part D: Spread analysis
Graph :Price Difference(in CNY, 2018/3/26-2019/2/22)

Graph :SC -Oman(in CNY,2018/3/26-2018/9/19)

Graph :SC - Brent(in CNY, 2018/3/26-2019/2/22)

Graph :SC - WTI(in CNY, 2018/3/26-2019/2/22)

Copyright by Fangquant.com