FangQuant › Financial Futures
Market Summary:
Last week, there was generally increase over the market. SSE Composite Index (000001.SH) changed 6.77 % to 2994.01, the market kept rising. Specifically, large cap shares perform much better than small cap shares and we can observe that SSE50 did better than CSI500 (7.49% vs 6.07%).
As for the overall market valuations, though there are rising, they remain at low level in a longer historical view.
As for Credit spread between A-rate corporate bonds, a small drop for 1Y spread is observed. As for the spread between Shibor Rates and Treasury bonds yield, all-term spreads experienced some drop. As for treasury bond yield, last week, 10Y yields experienced some rise.
As for exchange rate, there were diversified performances between inland and offshore rates, that CNY/USD changed -0.16% (up to 16:30 of last Friday) and CNH/USD changed 0.17%.
As for foreign fund flows via both Shanghai and Shenzhen-Hong Kong Stock Connect, last week there were both net inflows for Shanghai and Shenzhen markets. The net inflow over last week was 12.01 billion CNY and the cumulative net inflow was 765.83 billion CNY at last Friday, another historical new high. Specifically, more fund flow in Shenzhen market than Shanghai market.
In sum, the market kept experiencing rebound. Last week both small and large cap shares experienced huge rebound and foreign funds kept inflow, the confidence kept boosting. The market holds its optimistic view. Furthermore, China-US negotiation delayed the tariff rise and MSCI include more A-shares in its indices, the confidence is enhanced, further rise is expected.
News:
The Shanghai Stock Exchange officially promulgates and implements the business rules of setting up a Scientific Innovation Board and pilot registration system.
Further clarify the listing criteria for red-chip enterprises; the relevant red-chip enterprises that meet the requirements of the Circular of the General Office of the State Council transmitting the opinions of the SFC on the pilot issuance of stocks or depository certificates within the territory of innovative enterprises (No. 21, 2018 issued by the State Office) may apply for listing on the Scientific Innovation Board.
Among them, if the market value is not less than 10 billion yuan, or the market value is not less than 5 billion yuan, and the business income in the last year is not less than 500 million yuan, the red-chip enterprises which have independent research and development and international leading technology and are in a comparative advantage position in the competition of the same industry can apply for listing on the Scientific Innovation Board.
We should further optimize the shareholding reduction system; shorten the lock-in period of core technicians' shares in the draft of the Listing Rules of Scientific Innovation Board Stock Exchange and adjust it from three years to one year, after which 25% of pre-issue shares can be reduced annually; optimize the reduction restrictions of shareholders of unprofitable companies, and make gradient arrangements for controlling shareholders, actual controllers, directors and core technicians.
After comprehensive evaluation, according to the principle of steady start and gradual progress, the T + 0 trading mechanism is not included in the business rules issued in this time.
According to the data calculation, the threshold of 500,000 assets and the appropriateness requirement of two years' securities trading experience are more appropriate. About 3 million qualified individual investors in the existing A-share market, together with institutional investors, account for more than 70% of the transactions. Overall, it takes into account both investors' risk tolerance and the liquidity of the GEM market.
1. Indices
(1) Indices Performance
Graph 1: Indices performance over the past 3 months

During last week, SSE Composite Index (000001.SH) changed 6.77 % to 2994.01, CSI 300 INDEX (000300.SH) changed 6.52 % to 3749.71, CSI SmallCap 500 index (000905.SH) changed 6.07 % to 5067.23, SSE 50 Index (000016.SH) changed 7.49 % to 2819.47, FTSE China A50 Index (830009.XI) changed 7.24 % to 12879.60
Graph 2: Sectors performance under Wind Level-2 classification (%)

In the view of sectors, during last week(from 2019-02-22 to 2019-03-01), 24 of 24 Wind Level-2 sector(s) increased while 0 sector(s) dropped. Specifically, Diversified Financials(18.52%), Software & Services(12.77%) and Insurance (11.71%) did the best performance while Semiconductors & Semiconductor Equipment (4.69%), Automobiles & Components(4.80%) and Utilities (5.09%) did the worst performance.
(3) Indices Valuation Measures (TTM)
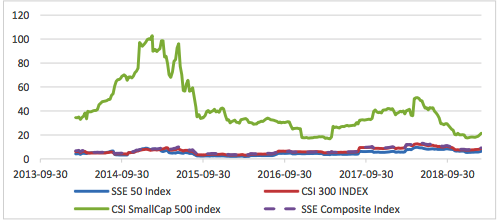
Graph 3: Indices P/E Ratio over recent 5 years (TTM)

The current P/E for SSE50, CSI300, CSI500, SSE Composite Index are 10.1917,12.5011,22.6199,13.3031 respectively.
Graph 4: Indices P/B Ratio in recent 5 years (TTM)

The current P/B for SSE50, CSI300, CSI500, SSE Composite Index are 1.2671,1.5067,1.8808,1.4769 respectively.
Graph 5: Indices P/CFO Ratio in recent 5 years (TTM)
The current P/CFO for SSE50, CSI300, CSI500, SSE Composite Index are 6.3881,8.7293,21.4057,9.2637 respectively.
Graph 6: Indices P/S Ratio in recent 5 years (TTM)

The current P/S for SSE50, CSI300, CSI500, SSE Composite Index are 1.1443,1.2588,1.1749,1.1784 respectively.
Graph 7: Indices CFO/E Ratio (=(P/E Ratio)/(P/CFO Ratio)) in recent 5 years (TTM)

The current CFO/E for SSE50, CSI300, CSI500, SSE Composite Index are 1.5954,1.4321,1.0567,1.4360 respectively.
Graph 8: Indices ROE (=(P/B Ratio)/(P/E Ratio)) over the past 5 years (TTM)

The current ROE for SSE50, CSI300, CSI500, SSE Composite Index are 0.1243,0.1205,0.0831,0.1110 respectively.
2. Interest Rates
The term structure of treasury bonds’ yields is currently upward sloping in concave shape. Specifically, last week, short-term yields short term yield of treasury bond experienced some flctuation and 3M yield now at 2.0%-2.2% level. Furthermore, as for long-term yield, there is a small rise. 10Y yield is about 3.2%-3.4%.
Graph 9: Term Structure Evolvement of Treasury Bonds During Recent 3 Months (%)

3. Credit Risk
Graph 10: Differences Between Shibor Rates and Treasury Yields During The Period Of Recent 3 Month (%)

Graph 11: Differences Between Corporate Bonds Yields (A Rate) and Treasury Yields During The Period Of Recent 3 Month(%)

4. Exchange Rates
Graph 12: USD/CNY, USD/CNH and USD Index in the Period Of Recent 1 Month

5. Foreign Fund Flow
Graph 13: Fund flow via both Shanghai and Shenzhen-Hong Kong Stock Connect in past 1M (100 million CNY)

Graph 14: Fund flow via both Shanghai-Hong Kong Stock Connect in past 1M(100 million CNY)

Graph 15: Fund flow via both Shenzhen-Hong Kong Stock Connect in past 1M(100 million CNY)

6. Index Future Market Liquidity
Graph 16: CSI300 Current/Next Month Contract Roll Spread Distribution (2s frequency)

Graph 17: SSE50 Current/Next Month Contract Roll Spread Distribution (2s frequency)

Graph 18: CSI500 Current/Next Month Contract Roll Spread Distribution (2s frequency)

There are 5 trading days during last week, so the distribution is worked out with 36005 data points for each contract.
Macroeconomic Topic:
On 2019/02/28, the February PMI data is released. China's official manufacturing PMI in February was 49.2, a new low since March 2016, with a forecast of 49.5 and a pre-value of 49.5. China's official non-manufacturing PMI in February was 54.3, with a forecast of 54.5 and a pre-value of 54.7. The comprehensive PMI output index is 52.4, with a pre-value of 53.2.
Graph A: PMI Data
February PMI Data

(2) About 5 Sub-indexes for manufacturing PMI calculation
From the point of view of 5 sub-indexes: (1) the decline of PMI: production is the main reason for the decline of manufacturing PMI. It was reported at 49.5%, changed to contraction zone, with preceding value of 50.9% and it drags PMI for 0.35 percentage points. (2)The decline of PMI: raw material storage is another important reason for the decline of manufacturing PMI. It was reported at 46.3%, still in contraction zone, with preceding value of 48.1% and it drags PMI for 0.18 percentage points. (3)The decline of PMI: employees is relatively minor reason for the decline of manufacturing PMI. It was reported at 47.5%, still in contraction zone, with preceding value of 47.8% and it drags PMI for 0.06 percentage points. (4)The improvement of PMI: new orders, gave an important positive force. It was reported at 50.6%, back to expansion zone, with preceding value of 49.6% and it boosted PMI for 0.30 percentage points. (5)The improvement of PMI: Delivery time of supplier, gave a small positive force for manufacturing PMI. It was reported at 49.8%, back to expansion zone, with preceding value of 50.1% and it boosted PMI for 0.045 percentage points.
Graph B: PMI 5 sub-indexes
Graph C: PMI Change Contribution by 5 Sub-indexes

(2) About 8 Sub-indexes not for manufacturing PMI calculation
2 of 8 sub-indexes are above 50, in expansion zone and the remaining indexes are in contraction zone. Several points need to mention: PMI for new export orders dropped again. PMI for new export orders in February was reported at 45.2%, with a previous value of 46.9%. The foreign trade situation is still grim. Imported PMI declined faster, reaching 44.8% with a previous value of 47.1%. The decline of import PMI indicates that domestic demand is still insufficient. At the same time, it also indicates that although there is a surplus in trade balance, its nature is still a recessionary surplus. That is to say, the surplus is not caused by the increase of exports, but by the faster decline and shrinkage of imports than exports. From the product inventory PMI, February continued to decline, indicating that enterprises continue to take the initiative to inventory in the absence of strong demand.
Graph D: PMI for 8 Sub-indexes not for manufacturing PMI calculation

(3) PMI by enterprises size
From the perspective of PMI of large and medium-sized enterprises, the PMI of medium-sized enterprises, especially small enterprises, has accelerated its decline in the contraction zone. This showed that small and mid-sized enterprises are still in difficult condition. Further directed polices designed for SMEs may be expected.
Graph E: PMI by enterprises size

(4) Summary
Generally speaking, the decline of PMI indicates that the downward pressure of the economy is still relatively large, but it should also be noted that the PMI in February is disturbed by seasonal factors such as Spring Festival factors according to historical experience. We should also see that PMI is expected to show a momentum of improvement due to the intensification of counter-cyclical macro-policy regulation. The PMI of large and medium-sized enterprises has shown a trend of differentiation.
PMI data will also have some impact on the capital market, but the most important aspect of the capital market is the policy aspect. Moreover, the top level has taken the development of capital market as an important grasp to stabilize the economy. Therefore, the impact of economic data on the current capital market should be relatively limited.
Currently no Comments.
Hot Topics
The 13rd China International Future Forum
The Shanghai Derivatives Energy Forum has received extensive attention from relevant industries both within and outside the borders.
Financial institutions deep explore commodity market opportunities, commodity index financial products show full-scale trend
R-Code for analysis: getKDJ
R-Code@June 06, 2016
New indicator to analyze the arbitrage opportunities between sse50 and csi500
Market review: January 11, 2017
The Great China Bubble: Anniversary Lessons and Outlook
Quant Investment in China A-share market
The hedge strategy between SSE50 and A50--Jan 13,2017
The arbitraging strategy between CSI300 and SSE50
Market review: June 17, 2016
Sleepless in London--Enda Homan(Allied Irish Banks Plc)
MSCI Rebuffs Chinese Equities for Third Time in Blow to Xi
Soros, Druckenmiller among hedgies profiting in market plunge