FangQuant › Financial Futures
Market Summary:
Last week, there was generally decrease over the market. SSE Composite Index (000001.SH) changed -0.81 % to 2969.86, the market stopped rising. Specifically, small cap shares perform much better than large cap shares and we can observe that CSI500 did better than SSE50 (3.52% vs -4.75%).
As for the overall market valuations, though there are rising, they remain at low level in a longer historical view.
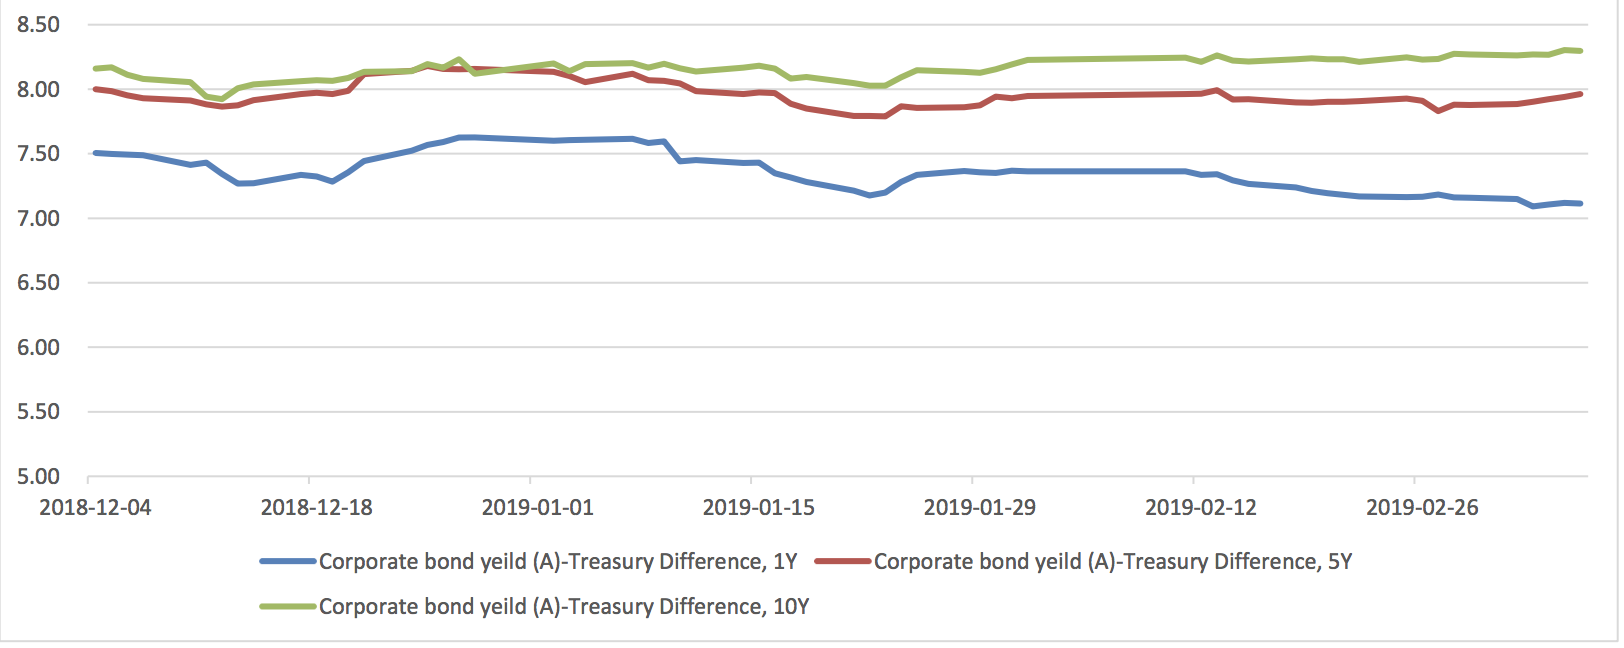
As for Credit spread between A-rate corporate bonds, a small drop for 1Y spread is observed. As for the spread between Shibor Rates and Treasury bonds yield, short-term spread experienced an obvious rise. As for treasury bond yield, last week, 10Y yields experienced some drop.
As for exchange rate, there were some depreciation for both inland and offshore rates, that CNY/USD changed 0.28% (up to 16:30 of last Friday) and CNH/USD changed 0.26%.
As for foreign fund flows via both Shanghai and Shenzhen-Hong Kong Stock Connect, last week there were both net inflows for Shanghai and Shenzhen markets. The net inflow over last week was 1.66 billion CNY and the cumulative net inflow was 767.50 billion CNY at last Friday, another historical new high. Specifically, more fund flow in Shenzhen market than Shanghai market. Actually, at the late of last week there is a trend of fund outflow.
In sum, there are obvious diversified performances between large and small cap shares. With the short view research report issued on Friday, the market realized that the short-term rise in large cap shares are significant so that experiencing some fluctuation is possible. However, rotation is observed, small cap shares such represented by CSI500 or GEM may have more opportunity in flowing period.
News:
(1)21st Century Economic Report: Huang Qifan, Vice President of China International Economic Exchange Center, said that from the perspective of capital market supply, there should be at least 6 supplies. At first, the supply of basic system, namely registration system and delisting system. Secondly, the capital market lacks long-term capital, which is also a supply-side problem. Thirdly, our securities companies have lost the most basic function of investment banks. Without this function, China's investment banks are not doing very well, and their industry status is lower than that of bank and insurance. Fourth, it is related to thousands of listed companies. Fifth, it has something to do with our institutional investors. Of course, there's also the science scrap board.
(2) China Securities Journal: After China Insurance was given a "sell" rating by CITIC Construction Investment Securities, CITIC Construction Investment Securities was also given a "sell" rating by Huatai Securities. On the same day, China Insurance Corporation and CITIC Construction Investment both fell 10%. Industry insiders said that the issue of "sell" rating research reports to alert customers of risks is the normal practice of analysts should be content, do not need to be over-interpreted.
(3) Shanghai Securities Journal: Two bearish research papers stirred the nerves of the market, the earliest decision to sell a large amount of funds, not sincerely believe that overvalued stock prices will return to the fundamentals under the influence of market rules. Instead, according to their usual mode of thinking, they concluded that behind these two rare short-sighted research papers there are "things", "backgrounds" and "guidance". Therefore, they choose to "adapt" to the powerful external force they imagine, selling all overvalued or not overvalued stocks.
(4) Securities Times: Fang Xinghai, Vice Chairman of CSRC: does not comment on the short report issued by securities analysts.
(5) Central Bank: China's M2 grew by 8% year on year in February, with an expected 8.4% increase and a pre-value of 8.4%. M0's money supply fell by 2.4% year on year, with an expected increase of 10% and a pre-value increase of 17.2%. RMB loans increased by 885.8 billion yuan, an increase of 46.5 billion yuan, an increase of 950 billion yuan and a pre-value of 323 billion yuan. At the end of February, the stock of social financing scale was 205.68 trillion yuan, an increase of 10.1% compared with the same period of last year; in the first two months, the total increment of social financing scale was 5.31 trillion yuan, an increase of 1.05 trillion yuan compared with the same period of last year.
1. Indices
(1) Indices Performance
Graph 1: Indices performance over the past 3 months

During last week, SSE Composite Index (000001.SH) changed -0.81 % to 2969.86, CSI 300 INDEX (000300.SH) changed -2.46 % to 3657.58, CSI SmallCap 500 index (000905.SH) changed 3.52 % to 5245.70, SSE 50 Index (000016.SH) changed -4.75 % to 2685.59, FTSE China A50 Index (830009.XI) changed -4.51 % to 12298.11.
(2) Sectors PerformanceGraph 2: Sectors performance under Wind Level-2 classification (%)

In the view of sectors, during last week(from 2019-03-01 to 2019-03-08), 17 of 24 Wind Level-2 sector(s) increased while 7 sector(s) dropped. Specifically, Software & Services(13.22%), Semiconductors & Semiconductor Equipment (9.22%) and Technology Hardware & Equipment(5.90%) did the best performance while Consumer Services (-2.08%), Insurance (-1.61%) and Banks(-1.55%) did the worst performance.
(3) Indices Valuation Measures (TTM)
Graph 3: Indices P/E Ratio over recent 5 years (TTM)
The current P/E for SSE50, CSI300, CSI500, SSE Composite Index are 9.7303,12.1532,23.2484,13.1280 respectively.
Graph 4: Indices P/B Ratio in recent 5 years (TTM)
The current P/B for SSE50, CSI300, CSI500, SSE Composite Index are 1.2098,1.4648,1.9374,1.4581 respectively.
Graph 5: Indices P/CFO Ratio in recent 5 years (TTM)
The current P/CFO for SSE50, CSI300, CSI500, SSE Composite Index are 6.0989,8.6541,22.0583,9.1373 respectively.
Graph 6: Indices P/S Ratio in recent 5 years (TTM)
The current P/S for SSE50, CSI300, CSI500, SSE Composite Index are 1.0925,1.2239,1.2099,1.1632 respectively.


Graph 7: Indices CFO/E Ratio (=(P/E Ratio)/(P/CFO Ratio)) in recent 5 years (TTM)

The current CFO/E for SSE50, CSI300, CSI500, SSE Composite Index are 1.5954,1.4043,1.0540,1.4367 respectively.
Graph 8: Indices ROE (=(P/B Ratio)/(P/E Ratio)) over the past 5 years (TTM)

The current ROE for SSE50, CSI300, CSI500, SSE Composite Index are 0.1243,0.1205,0.0833,0.1111 respectively.
2. Interest Rates
The term structure of treasury bonds’ yields is currently upward sloping in concave shape. Specifically, last week, short-term yields short term yield of treasury bond experienced some fluctuation and 3M yield now at 2.0%-2.2% level. Furthermore, as for long-term yield, there is a small drop. 10Y yield is about 3.0%-3.2%.
Graph 9: Term Structure Evolvement of Treasury Bonds During Recent 3 Months (%)

3. Credit Risk
Graph 10: Differences Between Shibor Rates and Treasury Yields During The Period Of Recent 3 Month (%)

Graph 11: Differences Between Corporate Bonds Yields (A Rate) and Treasury Yields During The Period Of Recent 3 Month(%)
4. Exchange Rates
Graph 12: USD/CNY, USD/CNH and USD Index in the Period Of Recent 1 Month

5. Foreign Fund Flow
Graph 13: Fund flow via both Shanghai and Shenzhen-Hong Kong Stock Connect in past 1M (100 million CNY)

Graph 14: Fund flow via both Shanghai-Hong Kong Stock Connect in past 1M(100 million CNY)

Graph 15: Fund flow via both Shenzhen-Hong Kong Stock Connect in past 1M(100 million CNY)

6. Index Future Market Liquidity
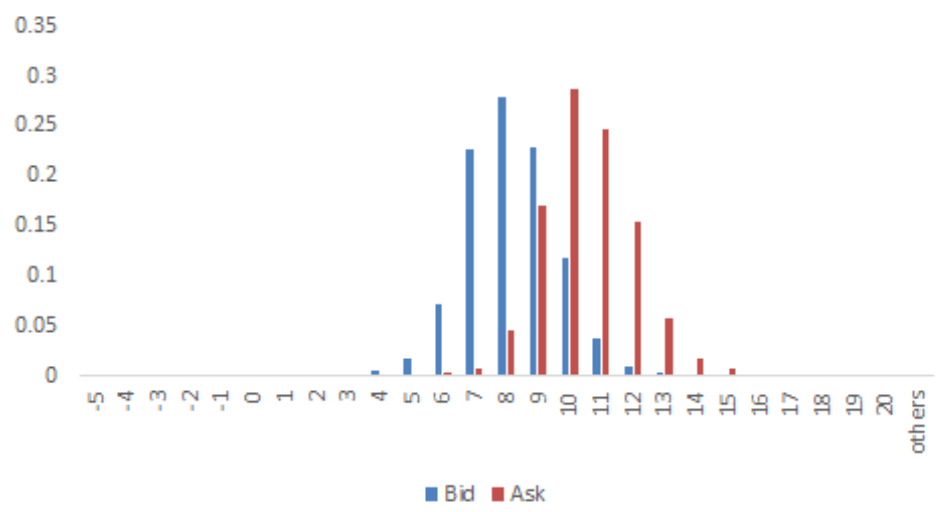
Graph 16: CSI300 Current/Next Month Contract Roll Spread Distribution (2s frequency)
Graph 17: SSE50 Current/Next Month Contract Roll Spread Distribution (2s frequency)

Graph 18: CSI500 Current/Next Month Contract Roll Spread Distribution (2s frequency)

There are 5 trading days during last week, so the distribution is worked out with 36005 data points for each contract.
Macroeconomic Topic:
On 2019/3/9, the national bureau of statistics released price data. The data showed that year-on-year CPI continued to fall, but it picked up ring ratio. PPI remained unchanged from the previous month. The data showed that the year-on-year and ring ratio CPI were 1.5 percent and 1 percent, respectively, compared with pre-value of 1.7 percent and 0.5 percent, respectively. Year-on-year and ring ratio PPI were 0.1 percent and -0.5 percent, respectively, compared with the previous figures of 0.1 percent and -0.1 percent, respectively.
February Price Data
(1) CPI Data
Graph A: CPI Data

The year-on-year ratio drop of the CPI in February was still significantly affected by the year-on-year drop in food prices, which was 0.7 percent year-on- year, compared with the previous 1.9 percent. In food, the negative growth of the price of pork, eggs and fresh fruit is obviously pulling down the price of food.
Affected by the slight year-on-year decline in oil prices, the CPI for transport and communications was reported at -1.2%, among which the CPI for transport fuel is closely related to oil prices which was down 2.9 percent, but a significant alleviation from the previous decline of 6.9 percent as oil prices were rebounding after falling in the fourth quarter of last year.
Core CPI, which excludes food and energy, also fell to 1.8 percent from 1.9 percent, due to a high base last year. Data show that the consumer goods CPI also fell year-on-year. In terms of services, education, culture and entertainment, they also fell year-on-year. However, the CPI of healthcare rebounded. Residential CPI also picked up slightly.
Graph B: year-on-year CPI: by Food, Non-Food, Core, Services, Consumer Goods (%)

Graph C: year-on-year CPI: by Food Alcohol and Tobacco, Clothing, Residence, Household Goods & Services, Transportation & Communications, Education, Culture & Entertainment, Healthcare (%)

(2) PPI Data
Graph D: PPI Data (%)

The means of production PPI was -0.1 percent year-on-year, unchanged from the previous month. The means of livelihoods PPI, was 0.4 percent, compared with the previous value of 0.6 percent. The fall in PPI of the means of production was mainly affected by the fall in prices of durable consumer goods. Among the means of production, the rise in PPI of raw materials was slightly lower than that before. From the month-on-month data, PPI of the means of production was reported at 0%, and the previous value was -0.8%.The means of livelihoods PPI was -0.1% month-on-month, compared with a previous reading of 0.Among them, durable and general consumer goods fell significantly, which may be related to the active destocking during the Spring Festival season and the long holiday.
Graph E: PPI Data, by means of production and means of livelihoods

(3) Summary
Overall, prices or in February to a great extent, are under the influence of the Spring Festival, especially influenced by food prices, but look from the core CPI is relatively stable. The Government’s Work Report this year still puts the price control level at 3%, which is not difficult to achieve. In theory, it is allowing room for monetary policy.
Copyright by fangquant.com
Currently no Comments.
Hot Topics
The 13rd China International Future Forum
The Shanghai Derivatives Energy Forum has received extensive attention from relevant industries both within and outside the borders.
Financial institutions deep explore commodity market opportunities, commodity index financial products show full-scale trend
R-Code for analysis: getKDJ
R-Code@June 06, 2016
New indicator to analyze the arbitrage opportunities between sse50 and csi500
Market review: January 11, 2017
The Great China Bubble: Anniversary Lessons and Outlook
Quant Investment in China A-share market
The hedge strategy between SSE50 and A50--Jan 13,2017
The arbitraging strategy between CSI300 and SSE50
Market review: June 17, 2016
Sleepless in London--Enda Homan(Allied Irish Banks Plc)
MSCI Rebuffs Chinese Equities for Third Time in Blow to Xi
Soros, Druckenmiller among hedgies profiting in market plunge