FangQuant › Financial Futures
Market Summary:
Last week, there was generally increase over the market. SSE Composite Index (000001.SH) changed 2.73 % to 3104.15. Specifically, small cap shares perform much better than large cap shares and we can observe that CSI500 did better thanSSE50 (4.91% vs 1.44%).
As for the overall market valuations, though there are rising, they remain at middle level for large cap shares but low for small cap in a longer historical view.
As for Credit spread between A-rate corporate bonds, there is no obvious change. As for the spread between Shibor Rates and Treasury bonds yield, short- term spreads experienced some drop. As for treasury bond yield, last week, also no obvious change.
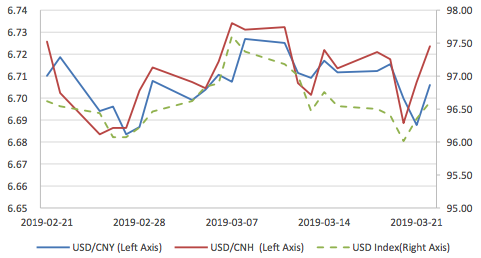
As for exchange rate, there were diversified performances between inland and offshore rates, that CNY/USD changed -0.08% (up to 16:30 of last Friday) and CNH/USD changed 0.15%.
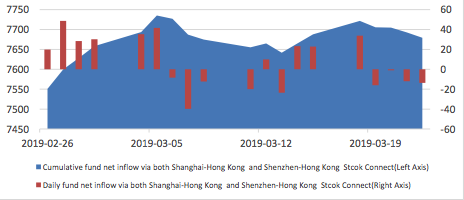
As for foreign fund flows via both Shanghai and Shenzhen-Hong Kong Stock Connect, last week there were net inflows for Shanghai but outflow for Shenzhen markets. The net inflow over last week was -0.87 billion CNY and the cumulative net inflow was 767.91 billion CNY at last Friday.
In sum, though market kept rising, the foreign fund suspends its inflow. Exactly, except for Monday, its kept outflow for 4 consecutive trading days, which indicate a less confident status. Also, in a valuation view, large cap shares represented by index like CSI300 and SSE50 had rebounded to a certain level. Thus, there are less chance for overall huge increase.
News:
Yi Gang President of Central Bank: at the China Development Forum: we will continue to expand the opening of the financial industry and promote high- quality economic development. In the future, with the development of China's financial market, the proportion of direct financing will increase, and part of debt financing will be converted into equity financing, which is conducive to the stability of macro-leverage ratio. Five considerations for further expanding the opening of the financial industry are as follows: Firstly, we should adhere to the coordination and promotion of the opening of the financial services industry, the opening of the financial market and the reform of the RMB exchange rate formation mechanism. Secondly, we should fully implement the management system of national treatment plus negative list before admission. Thirdly, we should improve the institutional rules of the opening up of the financial industry and realize the institutional and systematic opening up. Fourth, improve the business environment. Fifth, improve financial supervision.
Minister of Finance Liu Kun: We must ensure that taxes and fees in all industries are only reduced and not increased. Reducing the standard of urban workers' pension insurance payment to 16% in all places, reducing general expenditure, and continuing to increase the scale of infrastructure construction, supporting new energy vehicles and tapping rural consumption potential in response to downward economic pressures. We will speed up the issuance and use of local government bonds, strive to complete the issuance of the new 3.08 trillion yuan local government debt limit for the whole year by the end of September, and urge all localities to speed up the allocation of funds and use them on projects in a timely manner so as to give full play to the positive role of stabilizing local investment and expanding domestic demand. We will increase the implementation of central and local measures to reduce general expenditure and recover long-term deposited funds by coordinating the income deficit and mobilizing the budget stabilization adjustment fund. We will further optimize the expenditure structure and use the limited funds on the cutting edge. In terms of fiscal throttling, in addition to rigid and compulsory expenditure, the Ministry of Finance in this year's budget report requires that general expenditure be reduced by more than 5%. In fact, the central government has reduced general expenditure by more than 10%.
Wind: The new regulation of financial futures hedging will be implemented, and the scope of futures-cash matching index funds has been expanded. The original index futures spot matching contains only 20 index funds, such as Shanghai 50ETF, Shanghai 300ETF and Shanghai 500ETF. After adjustment, it can cover more than 200 index funds of all stock-based ETF and LOF.
Sina: Han Zheng, Standing Committee of the Political Bureau of the CPC Central Committee and Vice Premier of the State Council, said that China would further reduce the "negative list", further reduce tariffs and ease the difficulty of customs clearance. China will better create a legal, international and convenient business environment, and better attract and protect foreign investment. It is forbidden to force foreign investors to transfer technology and strengthen the protection of intellectual property rights. Establishing a system of punishing infringement, improving policy transparency and predictability, respecting international practices, treating enterprises registered in China equally and equally, so that foreign-funded enterprises can achieve better development.
1. Indices
(1) Indices Performance
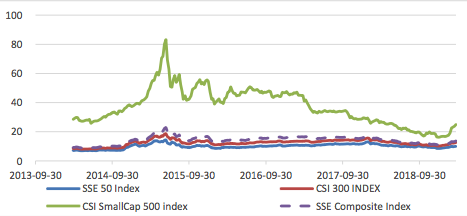
Graph 1: Indices performance over the past 3 months

During last week, SSE Composite Index (000001.SH) changed 2.73 % to 3104.15, CSI 300 INDEX (000300.SH) changed 2.37 % to 3833.80, CSI SmallCap 500 index (000905.SH) changed 4.91 % to 5622.14, SSE 50 Index (000016.SH) changed 1.44 % to 2795.39, FTSE China A50 Index (830009.XI) changed 1.45 % to 12835.38.
(2) Sectors Performance
Graph 2: Sectors performance under Wind Level-2 classification (%)
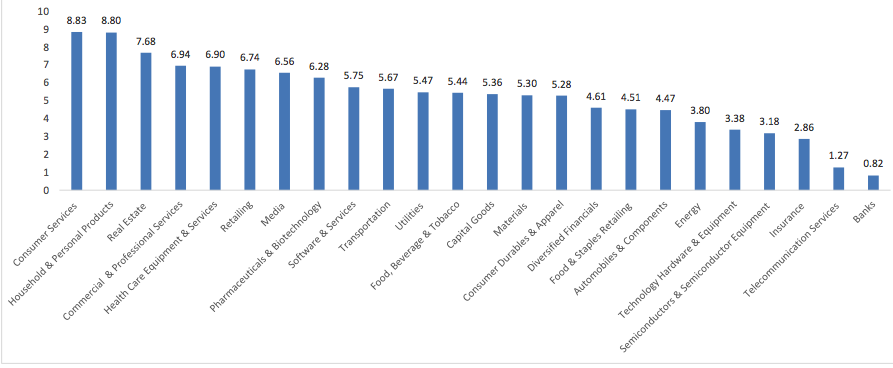
In the view of sectors, during last week(from 2019-03-15 to 2019-03-22), 24 of 24 Wind Level-2 sector(s) increased while 0 sector(s) dropped. Specifically, Consumer Services (8.83%), Household & Personal Products(8.80%) and Real Estate (7.68%) did the best performance while Banks(0.82%), Telecommunication Services (1.27%) and Insurance (2.86%) did the worst performance.
(3) Indices Valuation Measures (TTM)
Graph 3: Indices P/E Ratio over recent 5 years (TTM)
The current P/E for SSE50, CSI300, CSI500, SSE Composite Index are 9.9505,12.5707,24.9170,13.6484 respectively.
Graph 4: Indices P/B Ratio in recent 5 years (TTM)

The current P/B for SSE50, CSI300, CSI500, SSE Composite Index are 1.2407,1.5162,2.0810,1.5183 respectively.
Graph 5: Indices P/CFO Ratio in recent 5 years (TTM)

The current P/CFO for SSE50, CSI300, CSI500, SSE Composite Index are 6.2943,9.0334,22.9127,9.5890 respectively.
Graph 6: Indices P/S Ratio in recent 5 years (TTM)

The current P/S for SSE50, CSI300, CSI500, SSE Composite Index are 1.1150,1.2620,1.2971,1.2078 respectively.
Graph 7: Indices CFO/E Ratio (=(P/E Ratio)/(P/CFO Ratio)) in recent 5 years (TTM)

The current CFO/E for SSE50, CSI300, CSI500, SSE Composite Index are 1.5809,1.3916,1.0875,1.4233 respectively.
Graph 8: Indices ROE (=(P/B Ratio)/(P/E Ratio)) over the past 5 years (TTM)

The current ROE for SSE50, CSI300, CSI500, SSE Composite Index are 0.1247,0.1206,0.0835,0.1112 respectively.
2. Interest Rates
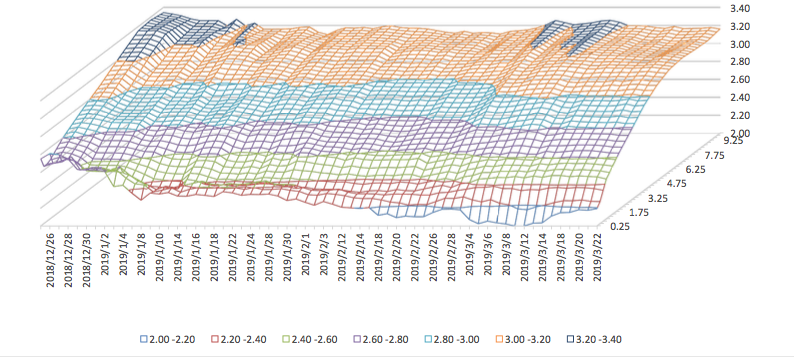
The term structure of treasury bonds’ yields is currently upward sloping in concave shape. Specifically, last week, short-term yields short term yield of treasury bond experienced some fluctuation and 3M yield now at 2.0%-2.2% level. Furthermore, as for long-term yield, there is a small drop. 10Y yield is about 3.2%-3.4%.
Graph 9: Term Structure Evolvement of Treasury Bonds During Recent 3 Months (%)
3. Credit Risk
Graph 10: Differences Between Shibor Rates and Treasury Yields During The Period Of Recent 3 Month (%)

Graph 11: Differences Between Corporate Bonds Yields (A Rate) and Treasury Yields During The Period Of Recent 3 Month(%)

4. Exchange Rates
Graph 12: USD/CNY, USD/CNH and USD Index in the Period Of Recent 1 Month
5. Foreign Fund Flow
Graph 13: Fund flow via both Shanghai and Shenzhen-Hong Kong Stock Connect in past 1M (100 million CNY)
Graph 14: Fund flow via both Shanghai-Hong Kong Stock Connect in past 1M(100 million CNY)

Graph 15: Fund flow via both Shenzhen-Hong Kong Stock Connect in past 1M(100 million CNY)

6. Index Future Market Liquidity
Graph 16: CSI300 Current/Next Month Contract Roll Spread Distribution (2s frequency)

Graph 17: SSE50 Current/Next Month Contract Roll Spread Distribution (2s frequency)
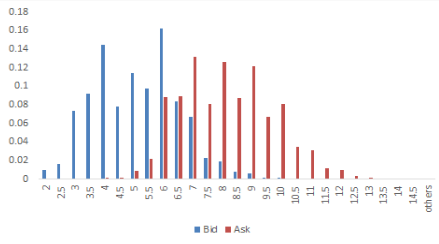
Graph 18: CSI500 Current/Next Month Contract Roll Spread Distribution (2s frequency)

There are 5 trading days during last week, so the distribution is worked out with 36005 data points for each contract.
Macroeconomic Topic:
From January to February, China's urban fixed assets investment was 6.1% year on year, with an expected 6.1% and a pre-value of 5.9%. Here, the investment in real estate development nationwide reached 1209 billion yuan, an increase of 11.6% in nominal terms over the same period last year, an increase of 2.1 percentage points over the whole year of 2018.
February Fixed Assets Data
Data from January to February show that fixed asset investment has rebounded, mainly due to higher real estate and infrastructure investment, while the growth rate of manufacturing investment has slowed down significantly. From January to February, the national fixed assets investment increased by 6.1% year-on-year, an increase of 0.2 percentage points over the whole year of 2018.
Graph A: Investment Completion of Fixed Assets (100m RMB)

Real estate investment grew faster. From January to February, the investment in real estate development increased by 11.6% year-on-year, and the
growth rate was 2.1 percentage points higher than that of last year.
Infrastructure construction rebound. The investment in infrastructure increased by 4.3% year-on-year, an increase of 0.5 percentage points over the
whole year of last year.
Manufacturing investment has fallen sharply. From January to February, the growth rate of manufacturing investment was 5.9%, which was 3.6
percentage points lower than that of last year.
Graph B: Investment Completion of Real Estate Development, Manufacturing Industry, Infrastructure Construction

Private investment completion of fixed assets declined. From January to February, the cumulative growth rate of private fixed assets investment was
7.5% year-on-year, which was 1.2 percentage points lower than the previous period.
Graph C: Private Investment Completion of Fixed Assets

According to the government's work report, counter-cyclical fiscal, monetary and employment control policies will probably land one after another in the year. So, the fixed asset investment should have a guarantee, especially with the police of ‘improve weak points’. Thus, future improvement of it is possible.
Copyright by Fangquant.com
Currently no Comments.
Hot Topics
The 13rd China International Future Forum
The Shanghai Derivatives Energy Forum has received extensive attention from relevant industries both within and outside the borders.
Financial institutions deep explore commodity market opportunities, commodity index financial products show full-scale trend
R-Code for analysis: getKDJ
R-Code@June 06, 2016
New indicator to analyze the arbitrage opportunities between sse50 and csi500
Market review: January 11, 2017
The Great China Bubble: Anniversary Lessons and Outlook
Quant Investment in China A-share market
The hedge strategy between SSE50 and A50--Jan 13,2017
The arbitraging strategy between CSI300 and SSE50
Market review: June 17, 2016
Sleepless in London--Enda Homan(Allied Irish Banks Plc)
MSCI Rebuffs Chinese Equities for Third Time in Blow to Xi
Soros, Druckenmiller among hedgies profiting in market plunge