FangQuant › Commodities Futures
Part A: Review (2019/3/18-2019/3/22)
From March 18, 2019 to March 22, 2019:the closing price of iron ore futures I1905 contract on Friday was 615.50 yuan, 11.50 yuan lower than the closing price of the last trading day of last week. The highest
price for this week is 645.00 yuan/ton, and the lowest point is 601.00 yuan/ton.
This week (2019/3/18-2019/3/22), the total volume of the main contract was lots, an increase of lots from last week. After the close of trading this Friday, the open interest of the main contract was 959594.00 lots, a decrease of 135870.00 lots from the last trading day of last week.
Notes: The main contract refers to the futures contract with the maximum open interest.
Part B: Transaction Summary
Since 2018/3/26 and up to 2019/3/22 closing, China iron ore futures’ cumulative trading volumes is 450.14 million lots and the cumulative amount of transaction is 22.60 trillion yuan.
Average daily turnover of 1860086 lots (2018/3/18-2019/3/22). Open interest declined steadily, with 2,224,492 lots on 2018/3/26 and 1711938 lots after the closing of 2019/3/22.
Because DCE raised the delivery quality standards for iron ore futures at the end of 2017, the volume and open interest of iron ore futures showed a downward trend.
Sum of All DCE Iron Ore Future contracts (2018/3/26-2019/3/22)

Graph:Volume (2018/9/3-2019/3/22)

Graph: Open Interest (2018/9/3-2019/3/22)
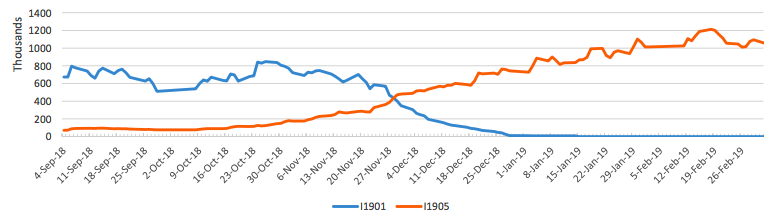
Graph:I1809 and I1901 and I1905 contracts account for the most share of trading volume and open interest (2018/3/26-2019/3/22)

Graph:Average trading distribution over the day (2018/3/26-2019/3/22)

Graph:Daily Fluctuation Range of I.DCE (2018/3/26-2019/3/22)

We can see that the amplitude of Chinese iron ore future in most of the time is lower than 4%, indicating that Chinese iron ore future did not have excessive fluctuations in the day.
Part C: Correlation Analysis
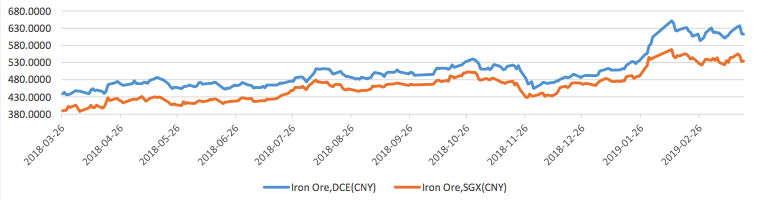
Graph:Price of Two Iron Ore futures(in CNY,2018/3/26-2019/3/21)
Graph:Correlation of 2 Iron Ore futures(in CNY,2018/3/26-2019/3/21)
I.DCE
Iron Ore 62% Fe, CFR North China (Platts)
I.DCE
FEF.SGX
0.9596
1
1
Graph:Price of I.DCE and Iron Ore 62% Fe, CFR North China (Platts) (2018/3/26-2019/3/21)

Graph:Correlation of I.DCE and Iron Ore 62% Fe, CFR North China (Platts) (in CNY,2018/3/26-2019/3/21)
|
|
I.DCE |
I.DCE FEF.SGX |
|
I.DCE |
1 |
|
|
Iron Ore 62% Fe, CFR North China (Platts) |
0.9400 | 1 |
Graph:Correlation between iron ore future and other related futures in China(in CNY,2018/3/26- 2019/3/21)
|
|
I.DCE | RB.SHF | HC.SHF |
| I.DCE | 1 |
|
|
| RB.SHF |
0.526614148
|
1 |
|
| HC.SHF |
0.505865594 |
0.78128699 |
1 |
As can be seen from the above table, the correlation between China's iron ore future and domestic major related futures is rather significant. The correlation with Rebar future is 52.66%. The trend of hot rolled coil future is also very close to iron ore future, the correlation is more than 50%. On the one hand, the high correlation will stimulate the continuous influx of arbitrage funds, which will help to enrich and optimize the strategy; On the other hand, it is also a sign that China's iron ore future market is maturing, which is conducive to the function of price discovery. It also has great significance for enterprises to use futures tools for hedging.
IDCE settle price and USD/CNY (2018/3/26-2019/3/21)

It can be seen that China's iron ore future and the RMB exchange rate are obviously negatively correlated.
Part D: Spread Analysis
Spread(DCE-SGX)(in CNY,2018/3/26-2019/3/21

Spread (I1905 –I1903) (in CNY, 2018/5/16-2019/3/22)

Spread (I1907 –I1905) (in CNY,2018/7/16-2019/3/22)

Platts Iron Ore Price Index(in USD,2010/4/14-2019/3/21)

Grade Spread(in USD,2010/4/14-2019/3/21)

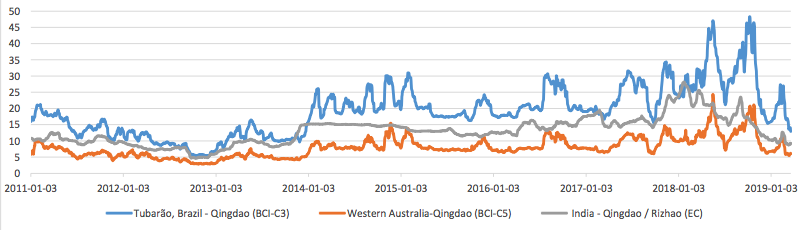
Iron Ore Freight Rate (in USD,2009/1/12-2019/3/21)
Copyright by fangquant.com
Currently no Comments.
Hot Topics
The 13rd China International Future Forum
The Shanghai Derivatives Energy Forum has received extensive attention from relevant industries both within and outside the borders.
Financial institutions deep explore commodity market opportunities, commodity index financial products show full-scale trend
R-Code for analysis: getKDJ
New indicator to analyze the arbitrage opportunities between sse50 and csi500
R-Code@June 06, 2016
Market review: January 11, 2017
The Great China Bubble: Anniversary Lessons and Outlook
Quant Investment in China A-share market
The hedge strategy between SSE50 and A50--Jan 13,2017
The arbitraging strategy between CSI300 and SSE50
Market review: June 17, 2016
Sleepless in London--Enda Homan(Allied Irish Banks Plc)
MSCI Rebuffs Chinese Equities for Third Time in Blow to Xi
Soros, Druckenmiller among hedgies profiting in market plunge