Market Summary:
Last week, there was obvious fluctuation over the market, the market dropped then rebounded. SSE Composite Index (000001.SH) changed -0.43 % to 3090.76. Specifically, large cap shares perform much better than small cap shares and we can observe that SSE50 did better than CSI500 (1.54% vs -1.32%).
As for the overall market valuations, though there are rising, they remain at middle level for large cap shares but low for small cap in a longer historical view.
As for Credit spread between A-rate corporate bonds, there is small rise for 5Y,10Y spreads but some drop for 1Y spread. As for the spread between Shibor Rates and Treasury bonds yield, short-term spreads experienced some fluctuation. As for treasury bond yield, last week, also no obvious change.
As for exchange rate, there were diversified performances between inland and offshore rates, that CNY/USD changed 0.21% (up to 16:30 of last Friday) and CNH/USD changed -0.01%.
As for foreign fund flows via both Shanghai and Shenzhen-Hong Kong Stock Connect, last week there were net inflows for Shenzhen but outflow for Shanghai markets. The net inflow over last week was -0.74 billion CNY and the cumulative net inflow was 767.17 billion CNY at last Friday.
In sum, the market experienced obvious fluctuation last week, foreign fund flow out for 10 billion on Monday, but got back on Friday. Fluctuation is intensified.
News:
U.S. National Economic Adviser Kudrow: It is expected that U.S. economic growth will return to 3 percent; the Federal Reserve should not tighten its policy just for the sake of economic prosperity; the Federal Reserve should cut interest rates to protect U.S. economic expansion; the threat to global economic growth and constrained inflation all indicate that the Federal Reserve should cut interest rates; and the Trump Administration will not replace Federal Reserve Chairman Powell.
China Securities News: At present, banks are increasing the recommendation of large deposit receipts. The interest rate of large deposit receipts of many agricultural and commercial banks is up 55% from the benchmark interest rate. Experts say that large deposit receipts and structured deposits will become a new tool for collecting deposits as Capital-Guaranteed financing will withdraw from the historical arena. In the next few years, the phenomenon of resident deposits being diverted will continue, and the slowdown of bank deposits growth has a long-term nature.
Shanghai Securities Journal: The list of 28 companies accepted by Scientific Innovation is "subtext" - mechanism is more important than rank. At present, this list is a list that fully respects the wishes of enterprises and the operation of the market. Some people rush to get started, but may not be the first to appear on the stage.
China's official manufacturing PMI in March was 50.5, up 1.3 percentage points from the previous year, returning to the critical point and hitting a new high since September 2018, with an expected 49.6 and a pre-value of 49.2.Statistical Bureau: In March, PMI of manufacturing industry returned to the expansion zone after three consecutive months below the critical point. Production activities accelerated and domestic demand continued to improve. The overall growth of non-manufacturing industry was stable and rapid. The business activity index of banks, securities and insurance industries was in a high boom zone of over 57.0%. Total business volume grew rapidly and business activities were more active.
1. Indices
(1) Indices Performance
Graph 1: Indices performance over the past 3 months

During last week, SSE Composite Index (000001.SH) changed -0.43 % to 3090.76, CSI 300 INDEX (000300.SH) changed 1.01 % to 3872.34, CSI SmallCap 500 index (000905.SH) changed -1.32 % to 5547.66, SSE 50 Index (000016.SH) changed 1.54 % to 2838.51, FTSE China A50 Index (830009.XI) changed 2.02 % to 13094.88.
(2) Sectors Performance
Graph 2: Sectors performance under Wind Level-2 classification (%)

In the view of sectors, during last week(from 2019-03-22 to 2019-03-29), 10 of 24 Wind Level-2 sector(s) increased while 14 sector(s) dropped. Specifically, Food, Beverage & Tobacco(5.63%), Consumer Services (5.14%) and Consumer Durables & Apparel(1.93%) did the best performance while Media (-7.86%), Telecommunication Services (-4.94%) and Energy (-2.28%) did the worst performance.
(3) Indices Valuation Measures (TTM)
Graph 3: Indices P/E Ratio over recent 5 years (TTM)

The current P/E for SSE50, CSI300, CSI500, SSE Composite Index are 10.0128,12.6711,24.9170,13.6033 respectively.
Graph 4: Indices P/B Ratio in recent 5 years (TTM)

The current P/B for SSE50, CSI300, CSI500, SSE Composite Index are 1.2341,1.5150,2.0534,1.5047 respectively.
Graph 5: Indices P/CFO Ratio in recent 5 years (TTM)

The current P/CFO for SSE50, CSI300, CSI500, SSE Composite Index are 7.1901,10.1202,22.1515,10.6573 respectively.
Graph 6: Indices P/S Ratio in recent 5 years (TTM)

The current P/S for SSE50, CSI300, CSI500, SSE Composite Index are 1.1129,1.2624,1.2773,1.1966 respectively.
Graph 7: Indices CFO/E Ratio (=(P/E Ratio)/(P/CFO Ratio)) in recent 5 years (TTM)

The current CFO/E for SSE50, CSI300, CSI500, SSE Composite Index are 1.3926,1.2521,1.1248,1.2764 respectively.
Graph 8: Indices ROE (=(P/B Ratio)/(P/E Ratio)) over the past 5 years (TTM)

The current ROE for SSE50, CSI300, CSI500, SSE Composite Index are 0.1233,0.1196,0.0824,0.1106 respectively.
2. Interest Rates
The term structure of treasury bonds’ yields is currently upward sloping in concave shape. Specifically, last week, short-term yields short term yield of treasury bond experienced some fluctuation and 3M yield now at 2.0%-2.2% level. Furthermore, as for long-term yield, there is a small drop. 10Y yield is about 3.2%-3.4%.
Graph 9: Term Structure Evolvement of Treasury Bonds During Recent 3 Months (%)

3. Credit Risk
Graph 10: Differences Between Shibor Rates and Treasury Yields During The Period Of Recent 3 Month (%)

Graph 11: Differences Between Corporate Bonds Yields (A Rate) and Treasury Yields During The Period Of Recent 3 Month(%)

4. Exchange Rates
Graph 12: USD/CNY, USD/CNH and USD Index in the Period Of Recent 1 Month

5. Foreign Fund Flow
Graph 13: Fund flow via both Shanghai and Shenzhen-Hong Kong Stock Connect in past 1M (100 million CNY)

Graph 14: Fund flow via both Shanghai-Hong Kong Stock Connect in past 1M(100 million CNY)

Graph 15: Fund flow via both Shenzhen-Hong Kong Stock Connect in past 1M(100 million CNY)

6. Index Future Market Liquidity
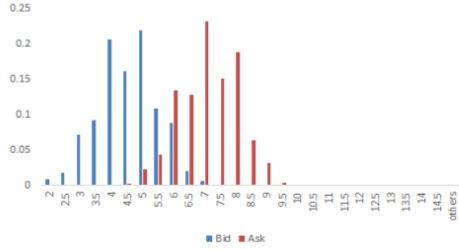
Graph 16: CSI300 Current/Next Month Contract Roll Spread Distribution (2s frequency)

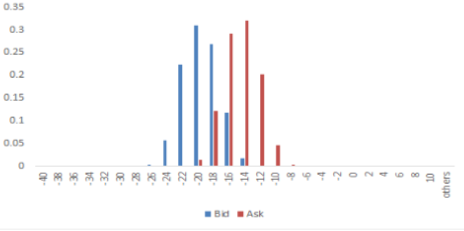
Graph 17: SSE50 Current/Next Month Contract Roll Spread Distribution (2s frequency)

Graph 18: CSI500 Current/Next Month Contract Roll Spread Distribution (2s frequency)

There are 5 trading days during last week, so the distribution is worked out with 36005 data points for each contract.
The industry enterprises data was released last week, From January to February, the total profits of industrial enterprises above the scale reached 708.01 billion yuan, down 14.0% from the same period last year. The total revenues of industrial enterprises above the scale reached 14.78 trillion yuan, up 3.3% from the same period last year.
February Industry Enterprises Data
From January to February, the total profits of industrial enterprises above the scale reached 708.01 billion yuan, down 14.0% from the same period last year. The low rise in total revenue and drop in profit margin are the 2 main reasons for the drop in total profits.
Graph A: Industrial Enterprises: Total Profit

The growth rate of enterprise revenue is significantly lower than that of last year (3.3% vs 10.1%). Profit margins and cost margins have deteriorated. From January to February, the profit margin of enterprises' revenue was 4.8%, which was significantly lower than that in total year of 2018 (6.49%) and the same period last year (6.1%). The deterioration of profit margin and cost margin is mainly due to the significant decline in the growth rate of enterprise revenue, while the cost is relatively rigid, which increased to 84.21%, 0.33 percentage points higher than that in 2018.
Graph B: Industrial Enterprises: Operating Revenue

Graph C: Industrial Enterprises: Profit Margin and Cost Ratio

Private companies outperform state-owned ones in earnings. As a result of a series of policy incentives for private enterprises, the profit differentiation between state-owned enterprises and private enterprises continues to narrow. From January to February, profits of state-owned enterprises fell by 24.2%, 36.8 percentage points compared with 2018, while profits of private enterprises fell by 5.8%, fell by 17.7 percentage points compared with 2018. The profit performance of private enterprises is significantly better than that of state-owned enterprises. The business environment of private enterprises and small and medium-sized enterprises is gradually improving, and the effect of earlier policies is gradually showing.
Graph D: Industrial Enterprises: Total Profit Growth for Private and State-owned enterprises

In general, the situation in industry enterprise looks not optimistic, downward pressure in economy is obvious.
However, the factors of the Spring Festival also disturb the economic data of January and February and the profit of enterprises. According to the statistics bureau's calculation, excluding the factors of the Spring Festival, the total profit of Industrial Enterprises above the scale declined slightly as compared with the same period last year.
Copyright by fangquant.com