FangQuant › Financial Futures
Market Summary:
Last week, there was obvious increase over the market. SSE Composite Index (000001.SH) changed 5.04 % to 3246.57. Specifically, small cap shares perform much better than large cap shares and we can observe that CSI500 did better than SSE50 (5.84% vs 4.00%).
As for the overall market valuations, though there are rising, they remain at middle level for large cap shares but relatively low for small cap in a longer historical view.
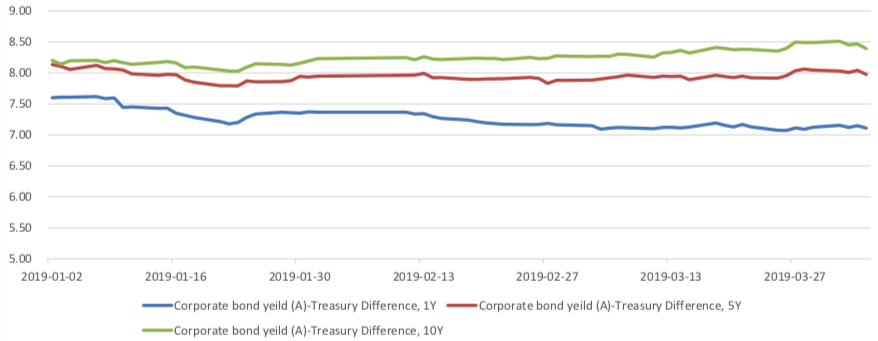
As for Credit spread between A-rate corporate bonds, there is small fluctuation. As for the spread between Shibor Rates and Treasury bonds yield, short- term spreads experienced some drop. As for treasury bond yield, last week, long-term yield experienced some rise.
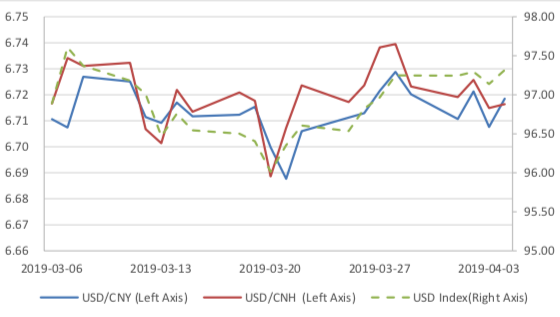
As for exchange rate, there were some appreciation for inland and offshore rates, that CNY/USD changed -0.03% up to 16:30 of last Friday) and CNH/USD changed -0.1%
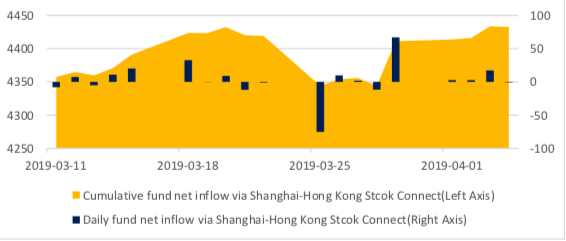
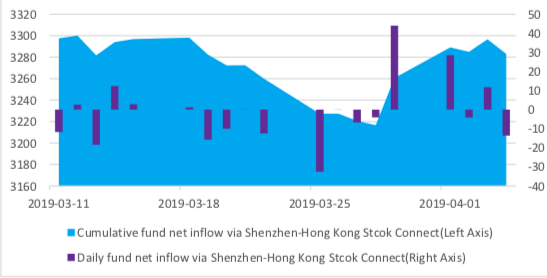
As for foreign fund flows via both Shanghai and Shenzhen-Hong Kong Stock Connect, last week there were net inflows for Shenzhen and Shanghai markets. The net inflow over last week was 4.41 billion CNY and the cumulative net inflow was 771.58 billion CNY at last Friday.
In sum, the market experienced obvious increase last week, foreign fund flow in again. The market still holds large confidence about the prospect. As China-US trade negotiation reached another optimistic result, market should be boosted by this.
News:
1. Xinhua News Agency: [US President Trump meets Liu He] Liu He said that in the past two days, the economic and trade teams of the two sides have conducted fruitful consultations, especially on important issues such as the text of economic and trade agreements. Trump said that I am glad to see that great progress has been made in the bilateral economic and trade negotiations. He hoped that the economic and trade teams of the two sides will continue to work hard to solve the remaining problems and strive for an early comprehensive and historic agreement, which will not only benefit the United States and China, but also the world. I look forward to meeting with Chairman Xi and witnessing this great moment together after the two sides have reached an agreement.
2. CCTV: Boeing CEO apologized for two crashes and admitted that there were problems with the flight system, which could lead to pilots losing control of the aircraft in some dangerous situations.
3. British Prime Minister Teresa May sent a letter to Tusk, President of the European Council, in which she was informed of her proposal to extend the date of EU withdrawal to June 30. Britain is committed to ratifying the EU withdrawal agreement by May 23. Sterling has little volatility against the dollar for the time being.
4. China Securities Journal: sponsorship agencies’ following investment become a major new measure of scientific creation board, the ratio of securities firms to investment will be about 2% - 5%. Industry insiders said that securities firms’ following investment test the pricing ability of investment banks, but also put forward higher requirements for alternative investment capital. Recently, many securities firms have concentrated financing of nearly 100 billion yuan.
5. U.S. National Economic Adviser Kudrow: The U.S. economy may need to cut interest rates; there is no need for the Federal Reserve to raise interest rates without inflation; the Federal Reserve must understand that the U.S. economy needs supply-side growth; Trump does not put pressure on the Federal Reserve, but expresses his views; Trump's choice of Federal Reserve governor prefers a stable dollar.
1. Indices
(1) Indices Performance
Graph 1: Indices performance over the past 3 months

During last week, SSE Composite Index (000001.SH) changed 5.04 % to 3246.57, CSI 300 INDEX (000300.SH) changed 4.90 % to 4062.23, CSI SmallCap 500 index (000905.SH) changed 5.84 % to 5871.56, SSE 50 Index (000016.SH) changed 4.00 % to 2951.98, FTSE China A50 Index (830009.XI) changed 3.94 % to 13610.36.
(2) Sectors PerformanceGraph 2: Sectors performance under Wind Level-2 classification (%)
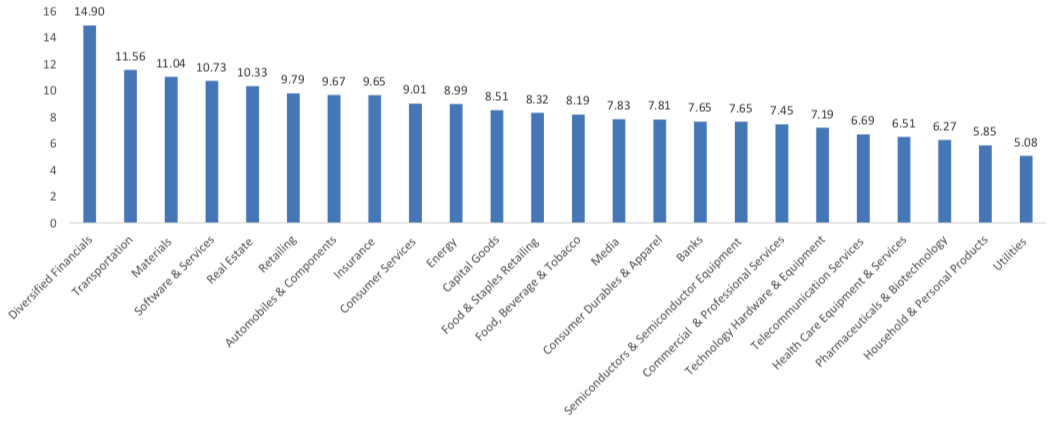
In the view of sectors, during last week(from 2019-03-29 to 2019-04-04), 24 of 24 Wind Level-2 sector(s) increased while 0 sector(s) dropped. Specifically, Diversified Financials(14.90%), Transportation(11.56%) and Materials (11.04%) did the best performance while Utilities (5.08%), Household & Personal Products(5.85%) and Pharmaceuticals & Biotechnology(6.27%) did the worst performance.
(3) Indices Valuation Measures (TTM)
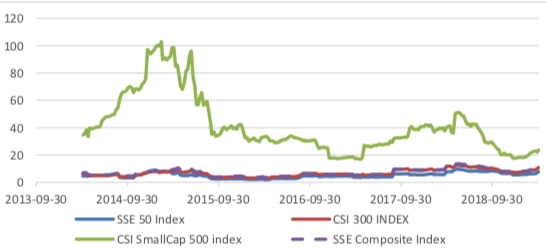
Graph 3: Indices P/E Ratio over recent 5 years (TTM)
The current P/E for SSE50, CSI300, CSI500, SSE Composite Index are 10.0128,12.6711,24.9170,13.6033 respectively.
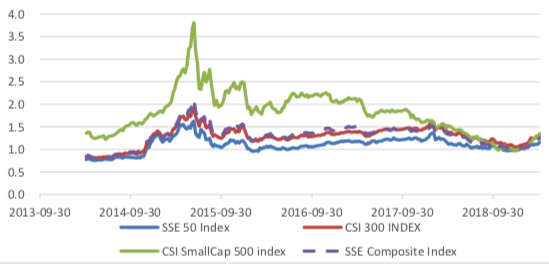
Graph 4: Indices P/B Ratio in recent 5 years (TTM)
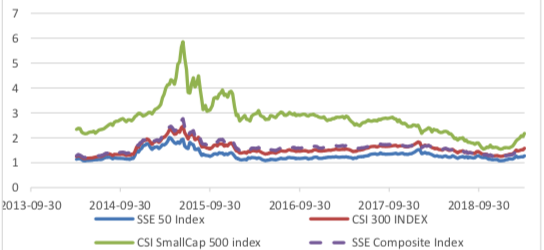
The current P/B for SSE50, CSI300, CSI500, SSE Composite Index are 1.2341,1.5150,2.0534,1.5047 respectively.
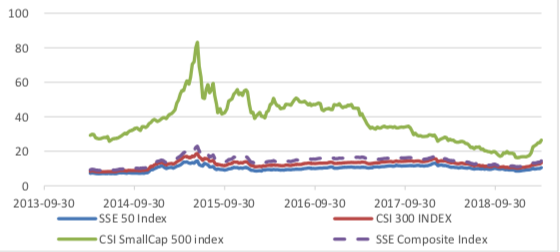
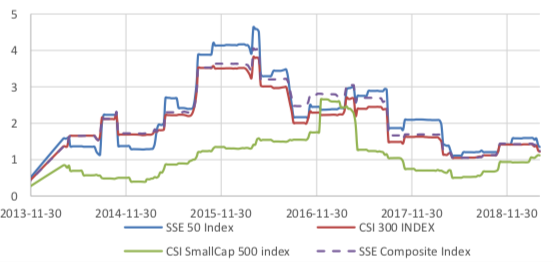
Graph 5: Indices P/CFO Ratio in recent 5 years (TTM)
The current P/CFO for SSE50, CSI300, CSI500, SSE Composite Index are 7.1901,10.1202,22.1515,10.6573 respectively.
Graph 6: Indices P/S Ratio in recent 5 years (TTM)
The current P/S for SSE50, CSI300, CSI500, SSE Composite Index are 1.1129,1.2624,1.2773,1.1966 respectively.
Graph 7: Indices CFO/E Ratio (=(P/E Ratio)/(P/CFO Ratio)) in recent 5 years (TTM)
The current CFO/E for SSE50, CSI300, CSI500, SSE Composite Index are 1.3926,1.2521,1.1248,1.2764 respectively.
Graph 8: Indices ROE (=(P/B Ratio)/(P/E Ratio)) over the past 5 years (TTM)
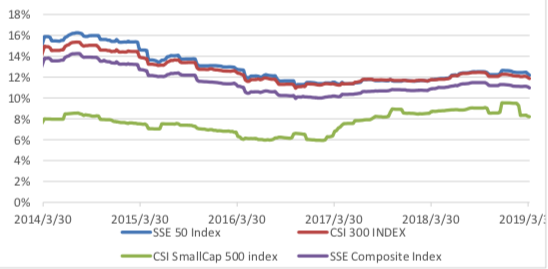 The current ROE for SSE50, CSI300, CSI500, SSE Composite Index are 0.1233,0.1196,0.0824,0.1106 respectively.
2. Interest Rates
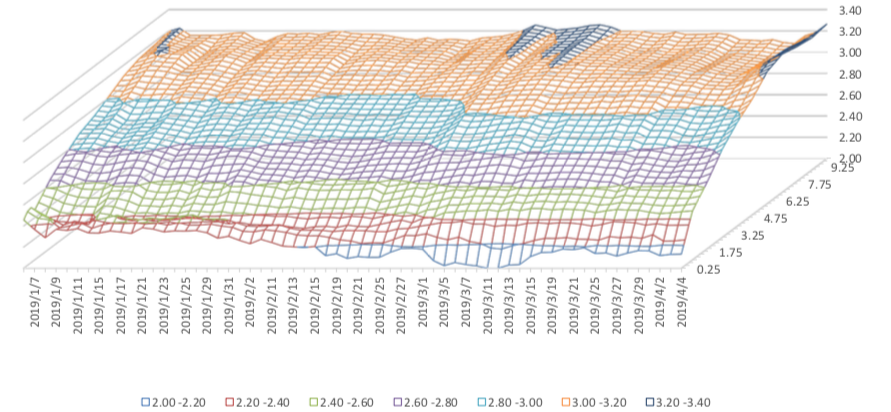
The term structure of treasury bonds’ yields is currently upward sloping in concave shape. Specifically, last week, short-term yields short term yield of treasury bond experienced some fluctuation and 3M yield now at 2.0%-2.2% level. Furthermore, as for long-term yield, there is a small rise. 10Y yield is about 3.2%-3.4%.
Graph 9: Term Structure Evolvement of Treasury Bonds During Recent 3 Months (%)
3. Credit Risk
Graph 10: Differences Between Shibor Rates and Treasury Yields During The Period Of Recent 3 Month (%)

Graph 11: Differences Between Corporate Bonds Yields (A Rate) and Treasury Yields During The Period Of Recent 3 Month(%)
4. Exchange Rates
Graph 12: USD/CNY, USD/CNH and USD Index in the Period Of Recent 1 Month
5. Foreign Fund Flow
Graph 13: Fund flow via both Shanghai and Shenzhen-Hong Kong Stock Connect in past 1M (100 million CNY)

Graph 14: Fund flow via both Shanghai-Hong Kong Stock Connect in past 1M(100 million CNY)
Graph 15: Fund flow via both Shenzhen-Hong Kong Stock Connect in past 1M(100 million CNY)
6. Index Future Market Liquidity
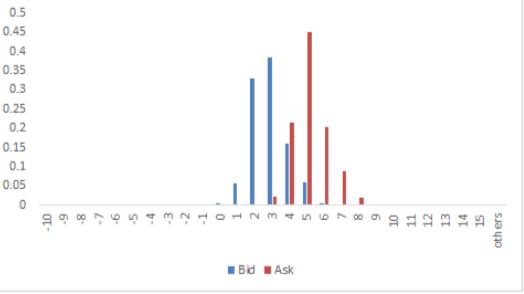
Graph 16: CSI300 Current/Next Month Contract Roll Spread Distribution (2s frequency)
Graph 17: SSE50 Current/Next Month Contract Roll Spread Distribution (2s frequency)
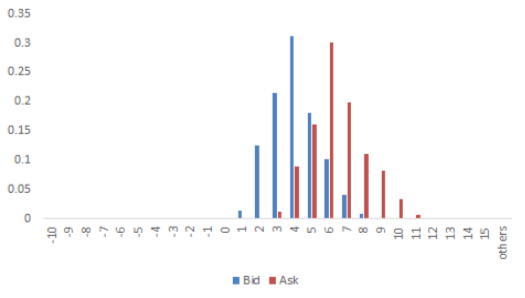
Graph 18: CSI500 Current/Next Month Contract Roll Spread Distribution (2s frequency)

There are 4 trading days during last week, so the distribution is worked out with 28804 data points for each contract.
Macroeconomic Topic:
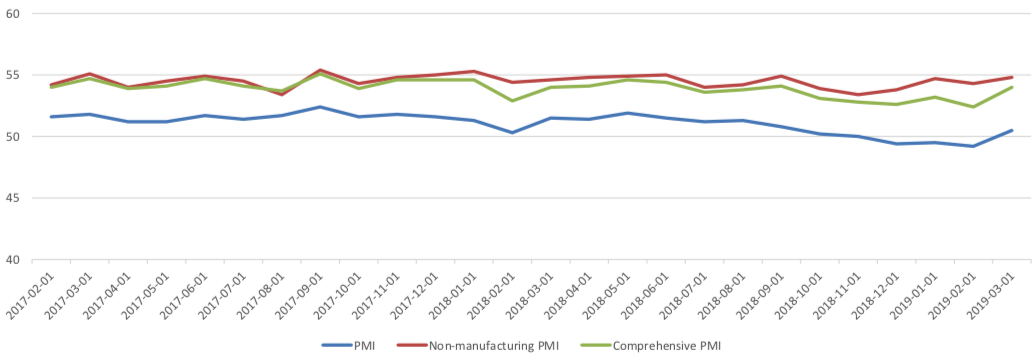
On 2019/03/31, the March PMI data is released. In March, China's PMI data showed a rebound, in which manufacturing PMI returned to the expansion area after three months of separation, reporting 50.5%, with a pre-value of 49.2%; non-manufacturing PMI rose slightly to 54.8%, with a pre-value of 54.3%, and comprehensive PMI rose to 54%, with a pre-value of 52.4%.
Graph A: PMI Data 60
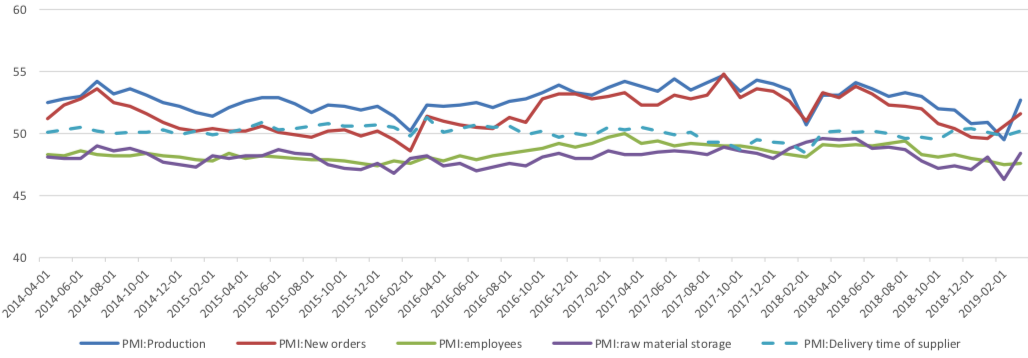
(1) About 5 Sub-indexes for manufacturing PMI calculation
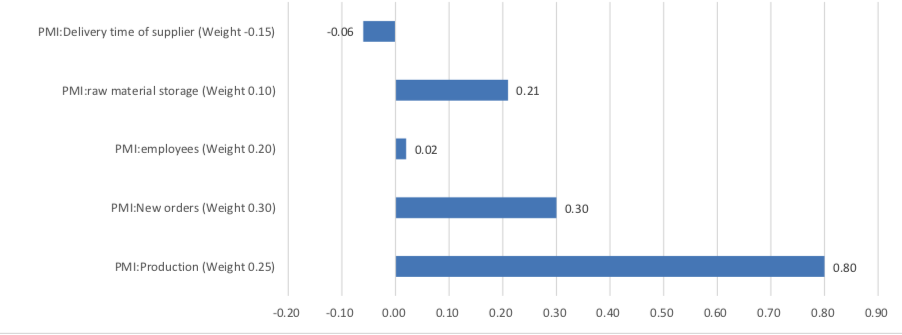
From the point of view of 5 sub-indexes: (1) the increase of PMI: production was the main reason for the increase of manufacturing PMI. It was reported at 52.7%, changed to expansion zone, with preceding value of 49.5% and it promoted PMI for 0.8 percentage points. (2) The improvement of PMI: new orders, gave an important positive force. It was reported at 51.6%, stay in expansion zone, with preceding value of 50.6% and it boosted PMI for 0.30 percentage points. (3) The increase of PMI: raw material storage was another important reason for the increase of manufacturing PMI. It was reported at 48.4%, still in contraction zone, with preceding value of 46.3% and it boosted PMI for 0.21 percentage points. (4) The rise of PMI: Employees was relatively minor reason for the rebound of manufacturing PMI. It was reported at 47.6%, still in contraction zone, with preceding value of 47.5% and it boosted PMI for 0.02 percentage points. (5) The worse of PMI: Delivery time of supplier, gave a small negative force for manufacturing PMI. It was reported at 50.2%, back to contraction zone, with preceding value of 49.8% and it draged PMI for -0.06 percentage points.
Graph B: PMI 5 sub-indexes
Graph C: PMI Change Contribution by 5 Sub-indexes
(2) About 8 Sub-indexes not for manufacturing PMI calculation
4 of 8 sub-indexes are above 50, in expansion zone and the remaining indexes are in contraction zone. Several points need to mention: The PMI of new export orders in March rose from 45.2% to 47.1%, but it is still in the contraction zone. Compared with new export orders PMI, import PMI also in the contraction zone rebounded sharply to 48.7, with a pre-value of 44.8%. As a result, the difference between new export orders PMI and import PMI dropped sharply to -1.6%, a new low for many years, which shows that China's import and export trade may face new challenges, and the surplus of trade balance may shrink substantially, even a deficit, in the face of the slowdown of world economic growth and trade protectionism. The rise of PMI in raw material purchasing price may indicate a rebound in PPI ring-to-ring data in March compared with February.
Graph D: PMI for 8 Sub-indexes not for manufacturing PMI calculation

(3) PMI by enterprises size
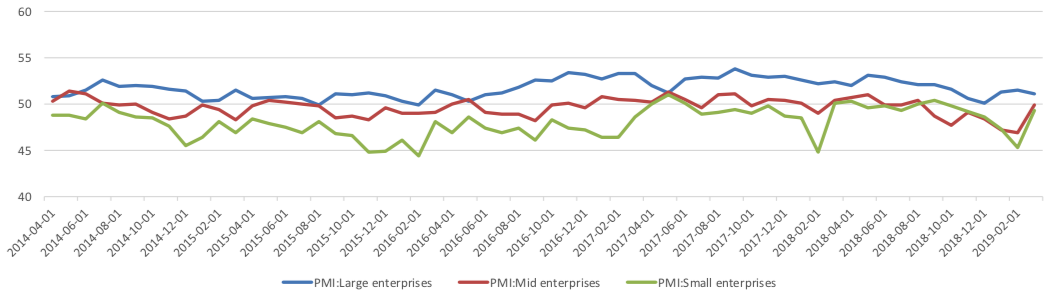
From the perspective of enterprises size, the PMI of large-sized enterprises has fallen, but the PMI of small and medium-sized enterprises has rebounded, but it is still in the contraction zone. The decline of PMI in large enterprises is mainly due to the expected decline of production PMI and production activities, and other sub-indicators are rising compared with the previous values. On the contrary, the production activities of small and medium-sized enterprises are expected to rebound substantially, which shows that small and medium-sized enterprises have greatly increased their confidence after various support policies.
Graph E: PMI by enterprises size
(4) Summary
Generally speaking, rebound of PMI data indicates that the counter-cycle polices are somewhat show their effectiveness and changed the prospect. However, the employment data did not rebound significantly, and more measures may be needed. As a leading measurement, the rebound of PMI may indicate rebound of other economic data and boost the market confidence.
Copyright by fangquant.com
Currently no Comments.
Hot Topics
The 13rd China International Future Forum
The Shanghai Derivatives Energy Forum has received extensive attention from relevant industries both within and outside the borders.
Financial institutions deep explore commodity market opportunities, commodity index financial products show full-scale trend
R-Code for analysis: getKDJ
R-Code@June 06, 2016
New indicator to analyze the arbitrage opportunities between sse50 and csi500
Market review: January 11, 2017
The Great China Bubble: Anniversary Lessons and Outlook
Quant Investment in China A-share market
The hedge strategy between SSE50 and A50--Jan 13,2017
The arbitraging strategy between CSI300 and SSE50
Market review: June 17, 2016
Sleepless in London--Enda Homan(Allied Irish Banks Plc)
MSCI Rebuffs Chinese Equities for Third Time in Blow to Xi
Soros, Druckenmiller among hedgies profiting in market plunge