FangQuant › Financial Futures
Market Summary:
Last week, there was generally decrease over the market. SSE Composite Index (000001.SH) changed -1.78 % to 3188.63. Specifically, large cap shares perform slightly better than small cap shares and we can observe that SSE50 did better than CSI500 (-1.07% vs -2.68%). The trading activity shrank as the average daily turnover dropped to 856.13 billion RMB, a decrease of 11.87%.
Unlike previous periods, fund flow via stock connect programs continued to show outflow over the whole week. The cumulative outflows over last week was 12.90 billion RMB. That is, the foreign fund showed hesitation.
However, at the end of last week, the central bank released the financing and monetary data, all of them far beyond the expectation. In historical view, rising financing data indicates recover of the economy in following period and rising monetary data is usually linked with bull market. Thus, the market mood may still be ignited during next period.
Also, valuation measures are not at high level, the current PE for SSE Composite Index, is 14.08, at 38.60% percent rank level of its historic data over past 1200 trading days. Still region for valuation boost if there is confidence.
News:
(1) Xinhua News Agency: The 39th Ministerial Conference of the International Monetary and Finance Commission ended in Washington on the 13th. A communique released after the meeting said that global economic growth slowed down and risks preference remained downward. These risks include trade tensions, policy uncertainty, geopolitical risks, and sudden sharp tightening of the financial environment in the context of limited policy space, historically high debt levels and increased financial vulnerability. The Committee calls on all countries to continue to take measures to reduce global economic risks, improve economic resilience and, if necessary, act quickly to consolidate economic growth.
(2) Xinhua News Agency: Chen Yulu, deputy governor of the Central Bank, said that China's stock market was showing signs of bottoming and recovery. As international institutional investors diversify their portfolio investments and China further opens its bond and stock markets, foreign portfolio investment inflows reached a record $120 billion last year. Given the increasing inclusion of RMB-denominated assets in international indices, the potential for foreign securities investment inflows is increasing.
(3) China Foundation News: With the publication of listed companies' annual reports in 2018 coming to an end, the heavy positions of well-known private equity institutions have also surfaced. Ten billion private equity firms such as Freshwater Spring Investment, Jinglin Asset, Gaoyi Asset, Chongyang Investment and so on have made many moves at the low market in the fourth quarter of last year. They have not only adhered to the market, but also made many new bids. They have their own preferences for buying growth or value stocks. There are also different layout ideas for private equity such as Chengquan Capital and Forest Garden Investment.
(4) First Financial Daily: Since March 20, the Central Bank has not carried out counter-repurchase operations for 17 consecutive working days. Market participants generally believe that liquidity pressure next week will be the key point to observe the liquidity regulation of the central bank. This month's tax period will be delayed due to the small and long vacation, and the impact of the next week's tax period will gradually increase. With MLF maturity, credit consumption and overstock, government bond issuance and payment and other factors, currency liquidity data will be further under pressure. There is little doubt that the central bank will restart liquidity investment in time and stabilize the fluctuation of market interest rates. The suspense of which tools to choose will also be revealed.
(5) Liu Kun, Minister of Finance: At present, China's economy is speeding up the transformation from high- speed growth to high-quality development, the economic structure continues to optimize and upgrade, new momentum continues to grow significantly, and the role of consumption as a driving force continues to increase. China will continue to substantially relax market access, strengthen the protection of intellectual property rights, strictly implement the newly promulgated Foreign Investment Law, implement larger tax cuts and fee reductions, and create a more attractive investment and business environment.
(6) MSCI: The conversion of MSCI All China Indexes to MSCI China All Share Indexes was postponed until November 26, which was scheduled for June 1. According to Shanghai Securities Journal, Xie Zhengdai, MSCI Asia-Pacific Research Director and Managing Director, said that the delay in the conversion of the MSCI China-wide index did not affect its tracking of capital inflows.
1. StockMarket
(1) Indices Performance
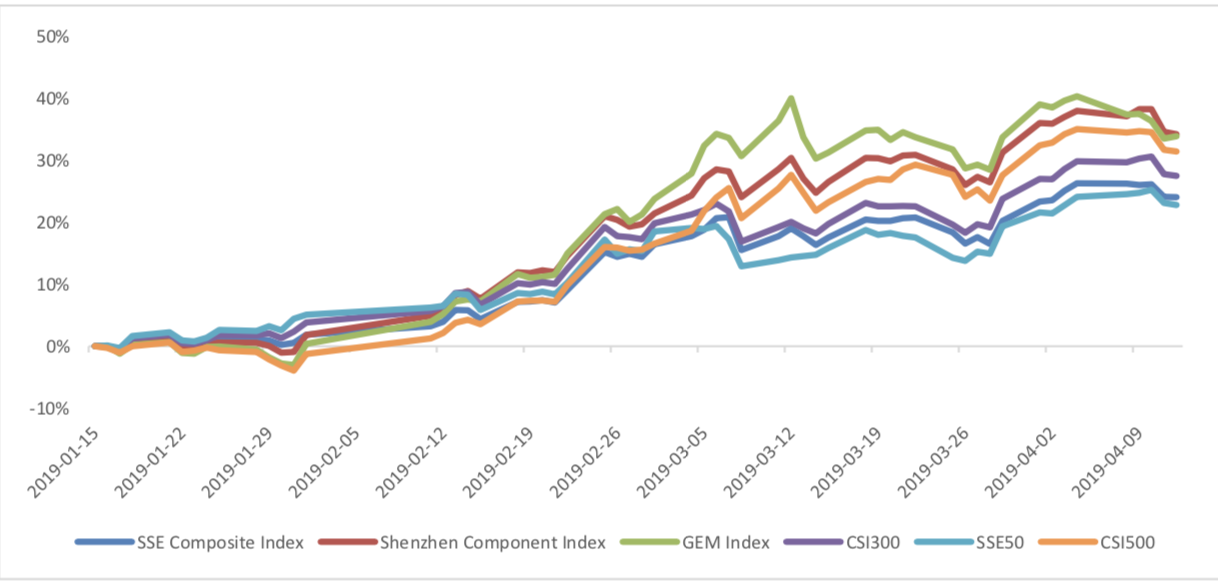
During last week, SSE Composite Index (000001.SH) changed -1.78 % to 3188.63, SHENZHEN COMPONENT INDEX (399001.SZ) changed -2.72 % to 10132.34, ChiNext PRICE INDEX (399006.SZ) changed -4.59 % to 1695.73, CSI 300 INDEX (000300.SH) changed -1.81 % to 3988.62, CSI SmallCap 500 index (000905.SH) changed -2.68 % to 5714.37, SSE 50 Index (000016.SH) changed -1.07 % to 2920.52.
Graph 1: Indices Performance over past 3 months
The average daily turnover of the whole market during past 5 trading days is 856.13 billion CNY, it decreased 11.87% compared with the previous period.
Graph 2: Market turnover

(2) Sectors Performance
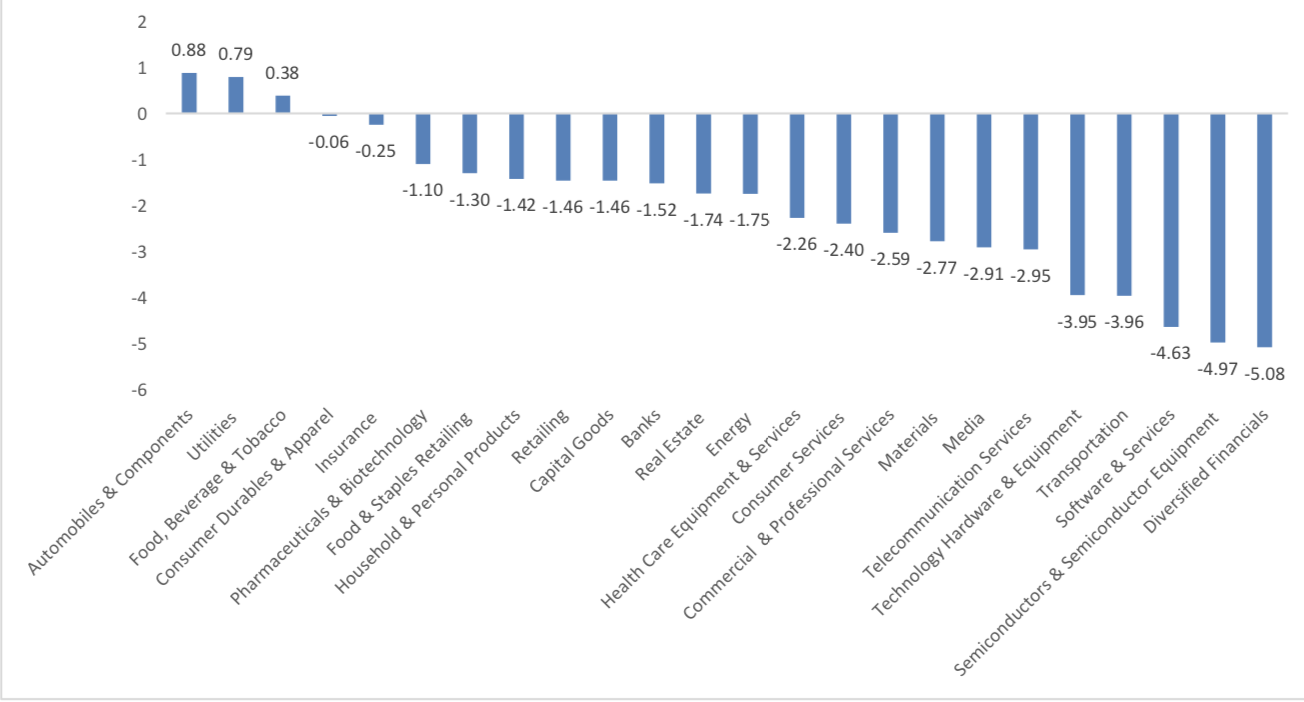
In the view of sectors, during last week(from 2019-04-05 to 2019-04-12), 3 of 24 Wind Level-2 sector(s) increased while 21 sector(s) dropped. Specifically, Automobiles & Components(0.88%), Utilities (0.79%) and Food, Beverage & Tobacco(0.38%) did the best performance while Diversified Financials(-5.08%), Semiconductors & Semiconductor Equipment (-4.97%) and Software & Services(- 4.63%) did the worst performance.
Graph 3: Sectors performance under Wind Level-2 classification (%)
(3) Indices Valuation (TTM)
The current PE for SSE Composite Index, Shenzhen Component Index, GEM Index, CSI300, SSE50, CSI500 are 14.08 , 25.42 , 54.02 , 13.05 , 10.31 , 25.92 respectively; and these indices are at 38.60%, 41.20%, 60.60%, 55.70%, 52.90%, 19.20% percent rank level of their historic data, respectively
Graph 4: PE of 6 indices

Graph 5: PE percent rank of 6 indices (calculated by data of past 1200 trading days, only 1Y data is presented on the graph)

The current PB for SSE Composite Index, Shenzhen Component Index, GEM Index, CSI300, SSE50, CSI500 are 1.52 ,2.68 ,4.74 ,1.52 ,1.24 , 2.07 respectively, and these indices are at 32.10%, 30.10%, 38.60%, 52.20%, 55.70%, 15.30% percent rank level of their historic data, respectively.
Graph 6: PB of 6 indices

Graph 7: PB percent rank of 6 indices (calculated by data of past 1200 trading days, only 1Y data is presented on the graph)

(4) Foreign Fund Flow
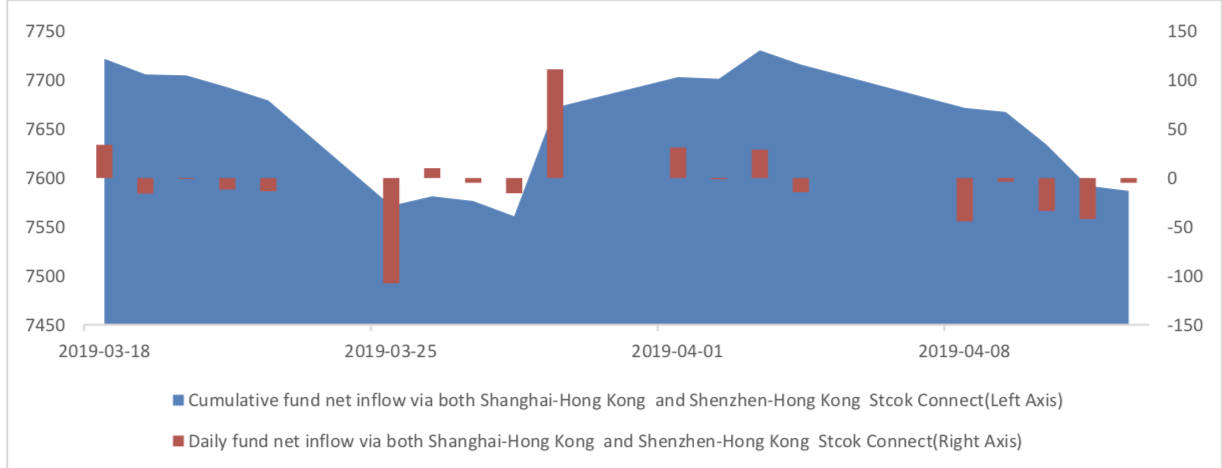
During last week the total foreign fund flow via Stock Connect is -12.90 billion RMB, and the cumulative inflows was 758.68 billion RMB. Specifically, the fund flow via Shanghai-Hong Kong Stock Connect is -3.82 billion RMB and the fund flow via Shenzhen-Hong Kong Stock Connect is -9.09 billion RMB.
Graph 8: Fund flow via both Shanghai and Shenzhen-Hong Kong Stock Connect in past 1M (100 million CNY)
Graph 9: Fund flow via Shenzhen-Hong Kong Stock Connect in past 1M (100 million CNY)
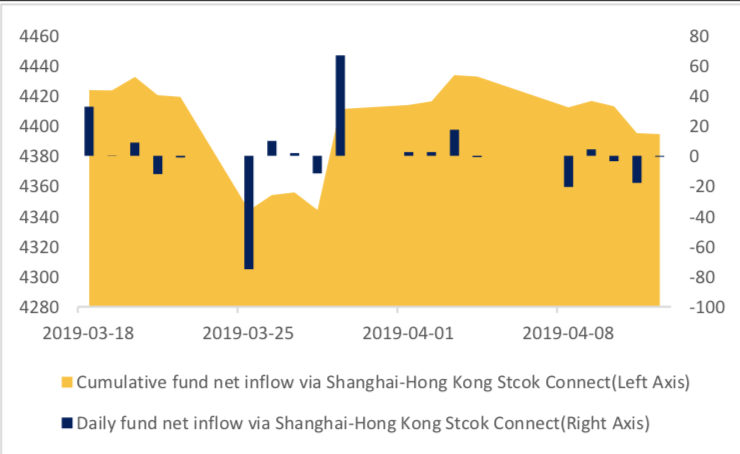
Graph 10: Fund flow via both Shanghai-Hong Kong Stock Connect in past 1M (100 million CNY)

2. Index Futures
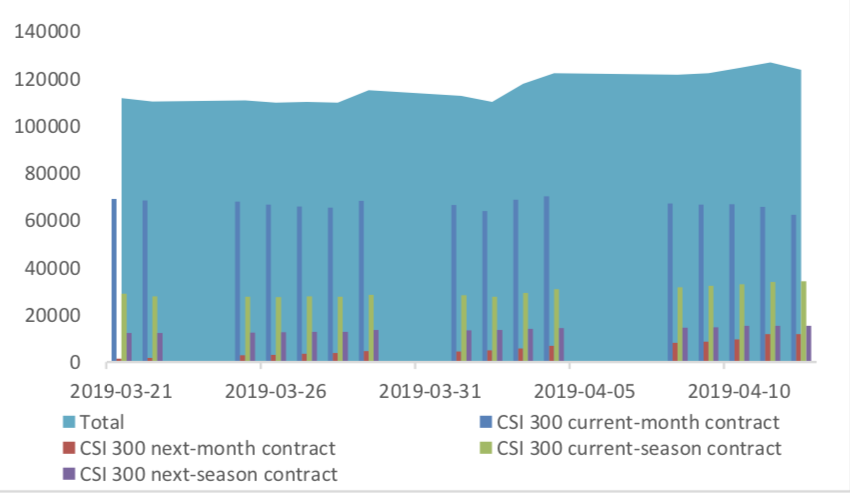
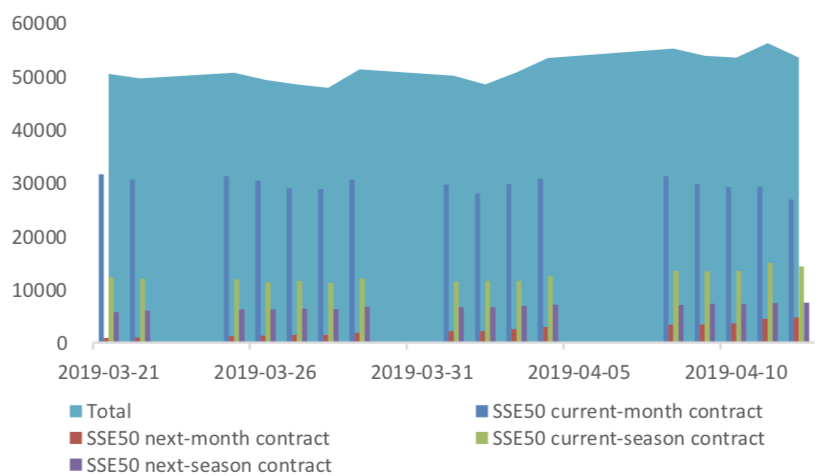
(1) Trading Volume and Open Interests
During past 5 trading days the average trading volume for CSI300(IF), SSE50(IH), CSI500(IC) contracts
are 107265 (9.86%),44935 (7.87%),74041 (-2.44%) lots, respectively. On the last trading day, the total open interests for them are 123645 (1.24%),53522 (0.20%),99584 (-0.86%) lots respectively.
Graph 11: CSI300 Index futures’ trading volume

Graph 12: CSI300 Index futures’ open interests
Graph 13:SSE50 Index futures’ trading volume

Graph 14: SSE50 Index futures’ open interests
Graph 15: CSI500 Index futures’ trading volume

Graph 16: CSI500 Index futures’ open interests

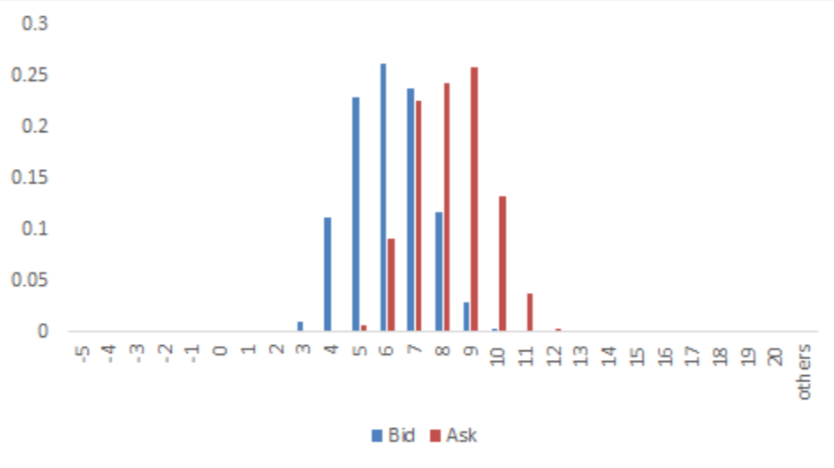
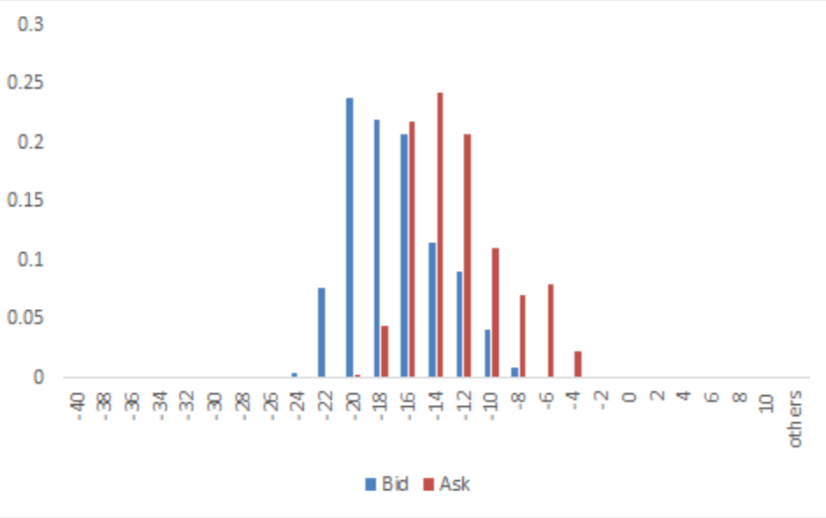
(2) Roll Level Bid-Ask Distribution
There are 5 trading days during last week, so the distribution is worked out with 36005 data points for each contract pair.
Graph 17: CSI300 Current/Next Month Distribution (2s frequency)
Graph 18: SSE50 Current/Next Month Contract Roll Spread Distribution (2s frequency)

Graph 19: CSI500 Current/Next Month Contract Roll Spread Distribution (2s frequency)
3. Financial Markets
(1) Interest Rates
The term structure of treasury bonds’ yields is currently upward sloping in concave shape.
Specifically, last week, short-term yields short term yield of Treasury bond experienced some fluctuation and 3M yield now at 2.0%-2.2% level. Furthermore, as for long-term yield, there is a small upward move. 10Y yield is about 3.2%-3.4%.
Graph 20: Term Structure Evolvement of Treasury Bonds Yields During Recent 3 Months (%)

As for Shibor rates, short-term rates experienced significant fluctuation. Specifically, O/N rate experienced obvious increase to 2.6%-2.8% level.
Graph 21: Term Structure Evolvement of Shibor Rates During Recent 3 Months (%)

(2) ExchangeRates
During last week, CNY/USD changed -0.06% to 6.7145 and offshore rate, CNH/USD, changed -0.10% to 6.7096 and USD index changed -0.38%.
Graph 22: USD/CNY, USD/CNH and USD Index

Macroeconomic Topic:
The central bank released financial and monetary data on Friday and most of which exceeded market expectations, indicating that the counter-cyclical adjustment of monetary policy continued to exert. The data showed that the new social finance scale in March reached 2860 billion yuan, a year-on-year increase of 80.41%. the cumulative month value reached 8180 billion yuan, a year-on-year increase of 39.71%.
March Finance Data
(1) Social Financing Data
Graph A: Total Social Financing Data(100m RMB)

In on-balance-sheet financing, New RMB loans reached 1959.1 billion yuan, an increase of 71.48% over the same period last year. However, the proportion of new RMB loans in the new social finance scale has declined, accounting for 68%, compared with 72% in the same period last year. Under the background of relatively stable exchange rate of RMB, foreign currency loans only added 278 million RMB loans, which shrank sharply from the same period last year.
Graph B: On-balance-sheet Financing Data(100m RMB)

From the perspective of new off-balance sheet financing, driven by the acceptance of bills of exchange and trust loan business, off-balance sheet business recovered slightly, but the entrusted loan business continued to shrink, and the new off-balance sheet business accounted for 3% of the new social finance scale.
Graph C: Off-balance-sheet Financing Data(100m RMB)

In terms of the direct financing, new direct financing fell in March compared with the same period last year, while equity financing and bond financing declined comprehensively. Direct financing was 339.426 billion yuan, of which bond financing was 327.60 billion yuan, while equity financing was 11.83 billion yuan. In the same period last year, direct financing amounted to 394.02 billion yuan. Direct financing accounted for 12% of the new social finance scale, which was lower than 25% in the same period last year. We believe that in order to improve the financing structure and stabilize the macro-leverage ratio, the recovery of direct financing, especially equity financing, should be a big probability event.
Graph D: Direct Financing Data(100m RMB)

(2) Monetary Data
Data show that in March, M0 fell back to - 2.4%, M1 rose from 2% to 4.6%, but M2 dropped from 8 to 8.6%.
Graph E: M1 and M2 data

The negative factors of M2 are as follows: deposit of non-bank financial institution has a more decrease of 722.4 billion yuan.
The positive factors of M2 are as follows: firstly, fiscal deposits has an increase drop of 212.6 billion yuan; secondly, deposits of non-financial enterprises increased by 756 billion yuan; thirdly, household deposits increased by 347.6 billion yuan
(3) Summary
In March, social financing was lower than 4635.252 billion yuan in January (January is often the peak of the new social financing scale in the whole year), but it reached the highest level in March in history. The relative peak year in March was 2013, 2014, 2016 and 2017, and March was often the second peak month of the new social financing scale. The 80.46% year-on-year increase was mainly attributed to the counter- cyclical adjustment of monetary policy and the low base of the same period last year.
Copyright by fangquant.com
Currently no Comments.
Hot Topics
The 13rd China International Future Forum
The Shanghai Derivatives Energy Forum has received extensive attention from relevant industries both within and outside the borders.
Financial institutions deep explore commodity market opportunities, commodity index financial products show full-scale trend
R-Code for analysis: getKDJ
R-Code@June 06, 2016
New indicator to analyze the arbitrage opportunities between sse50 and csi500
Market review: January 11, 2017
The Great China Bubble: Anniversary Lessons and Outlook
Quant Investment in China A-share market
The hedge strategy between SSE50 and A50--Jan 13,2017
The arbitraging strategy between CSI300 and SSE50
Market review: June 17, 2016
Sleepless in London--Enda Homan(Allied Irish Banks Plc)
MSCI Rebuffs Chinese Equities for Third Time in Blow to Xi
Soros, Druckenmiller among hedgies profiting in market plunge