Part A: Review (2019/4/8-2019/4/12)
From April 1, 2019, to April 12, 2019:the closing price of iron ore futures I1909 contract on Friday was 653.5 yuan, 21.92 yuan higher than the closing price of the last trading day of last week. The highest
price for this week is 653.00 yuan/ton, and the lowest point is 631.58 yuan/ton.
This week (2019/4/8-2019/4/12), the total volume of the main contract was 10118474.00 lots, an increase of 2674666.00 lots from last week. After the close of trading this Friday, the open interest of the main contract was 1201784.00 lots, an increase of 423196.00 lots from the last trading day of last week.
Notes: The main contract refers to the futures contract with the maximum open interest.
Part B: Transaction Summary
Since 2018/3/26 and up to 2019/4/12 closing, China iron ore futures’ cumulative trading volumes is 484.79 million lots and the cumulative amount of transaction is 24.83 trillion yuan.
Average daily turnover of 1,874,982 lots (2018/3/18-2019/4/12). Open interest declined steadily, with 2,224,492 lots on 2018/3/26 and 1,946,110 lots after the closing of 2019/4/12.
Because DCE raised the delivery quality standards for iron ore futures at the end of 2017, the volume and open interest of iron ore futures showed a downward trend.
Sum of All DCE Iron Ore Future contracts (2018/3/26-2019/4/12)

Graph:Volume (2018/9/3-2019/4/12)

Graph: Open Interest (2018/9/3-2019/4/12)

Graph:I1901 and I1905 and I1909 contracts account for the most share of trading volume and open interest (2018/3/26-2019/4/12)

Graph:Average trading distribution over the day (2018/3/26-2019/4/12)

Graph:Daily Fluctuation Range of I.DCE (2018/3/26-2019/4/12)

We can see that the amplitude of Chinese iron ore future in most of the time is lower than 4%, indicating that Chinese iron ore future did not have excessive fluctuations in the day.
Part C: Correlation Analysis
Graph:Price of Two Iron Ore futures(in CNY,2018/3/26-2019/4/11)

Graph:Correlation of 2 Iron Ore futures(in CNY,2018/3/26-2019/4/12)
|
|
I.DCE |
Iron Ore 62% Fe, CFR North China (Platts) |
|
I.DCE |
1 |
|
|
FEF.SGX |
0.8442 |
1 |
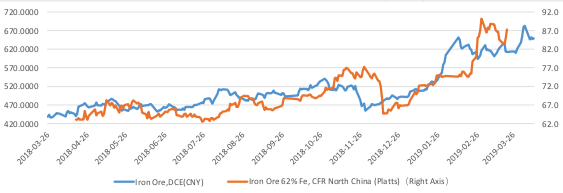
Graph:Price of I.DCE and Iron Ore 62% Fe, CFR North China (Platts) (2018/3/26-2019/4/12)

Graph:Correlation of I.DCE and Iron Ore 62% Fe, CFR North China (Platts) (in CNY,2018/3/26-2019/4/12)
|
|
I.DCE |
I.DCE FEF.SGX |
|
I.DCE |
1 |
|
|
Iron Ore 62% Fe, CFR North China (Platts) |
0.8191 |
1 |
|
|
I.DCE | RB.SHF | HC.SHF |
| I.DCE | 1 |
|
|
| RB.SHF |
0.431629866
|
1 |
|
| HC.SHF |
0.465284072
|
0.69107787
|
1 |
IDCE settle price and USD/CNY (2018/3/26-2019/4/11)
It can be seen that China's iron ore future and the RMB exchange rate are obviously negatively correlated.
Part D: Spread Analysis
Spread(DCE-SGX)(in CNY,2018/3/26-2019/4/11)

Spread (I1907 –I1905) (in CNY,2018/7/16-2019/4/11)

Platts Iron Ore Price Index(in USD,2010/4/14-2019/4/11)
Grade Spread(in USD,2010/4/14-2019/4/11)
Iron Ore Freight Rate (in USD,2009/1/12-2019/4/11)


