FangQuant › Financial Futures
Market Summary:
Last week, only 2 trading days, there was small decrease over the market. SSE Composite Index (000001.SH) changed -0.26 % to 3078.34. Specifically, large cap shares perform much better than small cap shares and we can observe that SSE50 did better than CSI500 (1.81% vs -1.86%). The trading activity shrank obviously.
As we expected at last week, the foreign fund suspended its outflow after the market experiencing obvious drop. However, valuation is not at low level for large cap blue-chip shares, so there should not be obvious opportunity for valuation repairing. Thus, if there is any, confidence should be originated from other sources.
At the end of April, the newest PMI data was released by statistic department. Though it is still above 50, the expansion line, it shrank obviously compared with previous period and below expectation, indicating the downward pressure of the economy is not far away. As a leading indicator of the economy, this may indicate shrinking of other measures and be a force to drag market confidence.
We add arbitrage opportunity review since this week. Under our assumption, we found obvious arbitrage opportunities for CSI300 and SSE50 current-month contract on Monday (4/29), and some opportunities for CSI500 current-month contract on Tuesday (4/30).
News:
(1) Xinhua News Agency: Statistics Bureau recently released data showing that in the first quarter, China’s service industry added value increased by 7% year-on-year, 0.6% and 0.9% higher than GDP and secondary industry added value respectively; the service industry added value accounted for 57.3% of GDP, 0.6% higher than the same period last year.
(2) Shanghai Securities journal: Analysts believe that inflation is an important macroeconomic indicator of concern to the Federal Reserve. Despite the recent good economic data, the Federal Reserve will not change its monetary policy expectations. On the Chinese market, Zhou Wenqun, manager of Fidelity International Fund, believes that China’s economy may improve in the second half of this year and is very optimistic about the consumer enterprises related to the continuous upgrading and high-end consumption in China.
(3) Sina: Zhang Bin, Chief Representative of the Hong Kong Representative Office of the Shanghai Stock Exchange: Internationalization is the top priority of the Shanghai Stock Exchange after the launch of the Science Creative Board; Shang’s progress is slightly slow, but the overall work is still progressing smoothly; Shanghai-London Stock Connect’s rule-making is mature and complete, and securities dealers, issuers and depository banks are also in-depth communication with the exchanges of the two places, which may be the day ahead. It will come out.
(4) Sina: Mao Zhirong, managing director of the Hong Kong Stock Exchange and co-head of the Mainland Affairs Section, said that since the opening of Shanghai and Shenzhen to Hong Kong, we have been constantly listening to the needs of the market in order to improve the interconnection mechanism. He disclosed that he was working with the Shanghai and Shenzhen Stock Exchanges on holiday arrangements for Shanghai and Shenzhen-Hong Kong links. If the mainland market is closed during the holidays and the Hong Kong market is still open, mainland investors are allowed to sell shares through Shanghai and Shenzhen-Hong Kong links.
(5) Wind: [Summary of Fed Chairman Powell’s Press Conference] 1. Interest rate hike prospects: without seeing strong reasons for interest rate hikes or cuts, the current position is appropriate; 2. Excess Reserve Ratio (IOER): IOER cuts are minor technical adjustments, which do not mean a change in FOMC policy; 3. Economic status quo: economic growth and employment growth are stronger than the Committee’s expectations; Supported by stable fundamentals; 4. Responding to Trump’s request for interest rate reduction: short-term political issues are not taken into account in FOMC decision-making; 5. Inflation level: unexpected decline in core inflation, there may be some temporary factors at work, which are expected to rise; 6. Overseas risks: some risks appear moderate to a certain extent, and the risk of hard exit from Europe is reduced.
(6) Xinhua Perspective: Liu He, member of the Political Bureau of the CPC Central Committee, Vice Premier of the State Council and Chinese leader of the Sino-US Comprehensive Economic Dialogue, held the 10th round of high-level Sino-US economic and trade consultation in Beijing with U.S. Trade Representative Lethizer and Finance Minister Mnuchin. In accordance with the established arrangements, the two sides will hold the eleventh round of high-level economic and trade consultation between China and the United States in Washington next week.
(7) Shanghai Securities Daily: The second round of inquiries on the Securities Creative Board has been launched. Several enterprises have received the second round of inquiries from the Shanghai Stock Exchange through the auditing system. Till April 30, a total of 98 enterprises had accepted applications, and 78 had already sent out the first round of inquiries.
1. StockMarket
(1) Indices Performance
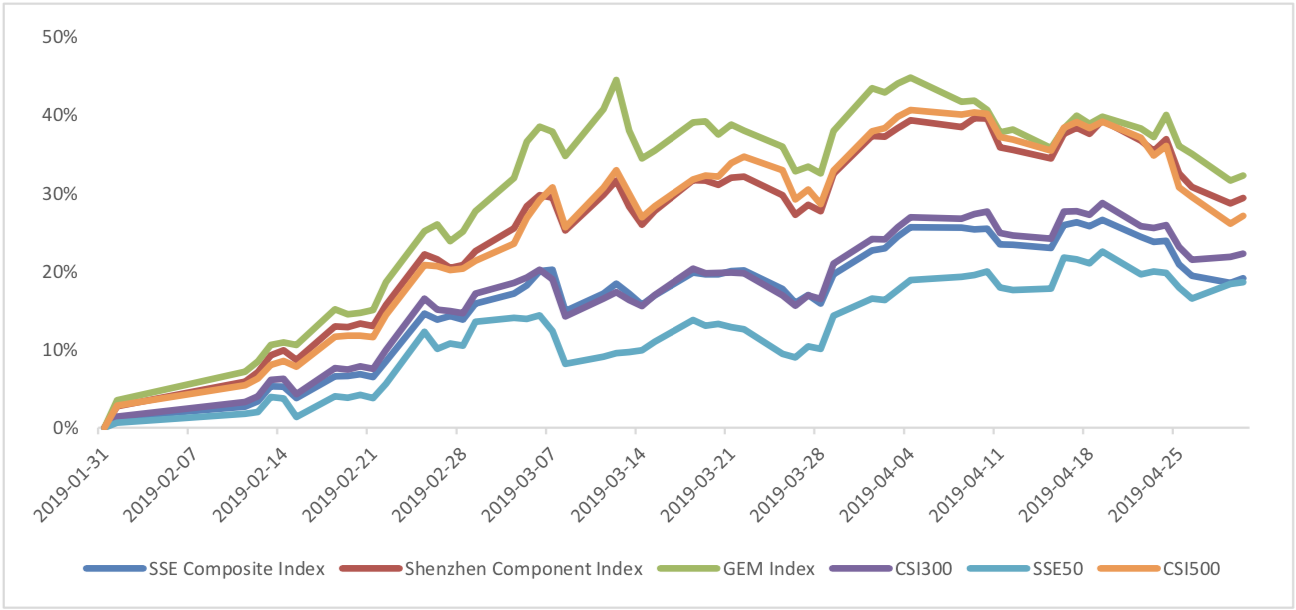
During last week, SSE Composite Index (000001.SH) changed -0.26 % to 3078.34, SHENZHEN COMPONENT INDEX (399001.SZ) changed -1.09 % to 9674.53, ChiNext PRICE INDEX (399006.SZ) changed -2.05 % to 1623.78, CSI 300 INDEX (000300.SH) changed 0.62 % to 3913.21, CSI SmallCap 500 index (000905.SH) changed -1.86 % to 5307.56, SSE 50 Index (000016.SH) changed 1.81 % to 2945.24.
Graph 1: Indices Performance over past 3 months
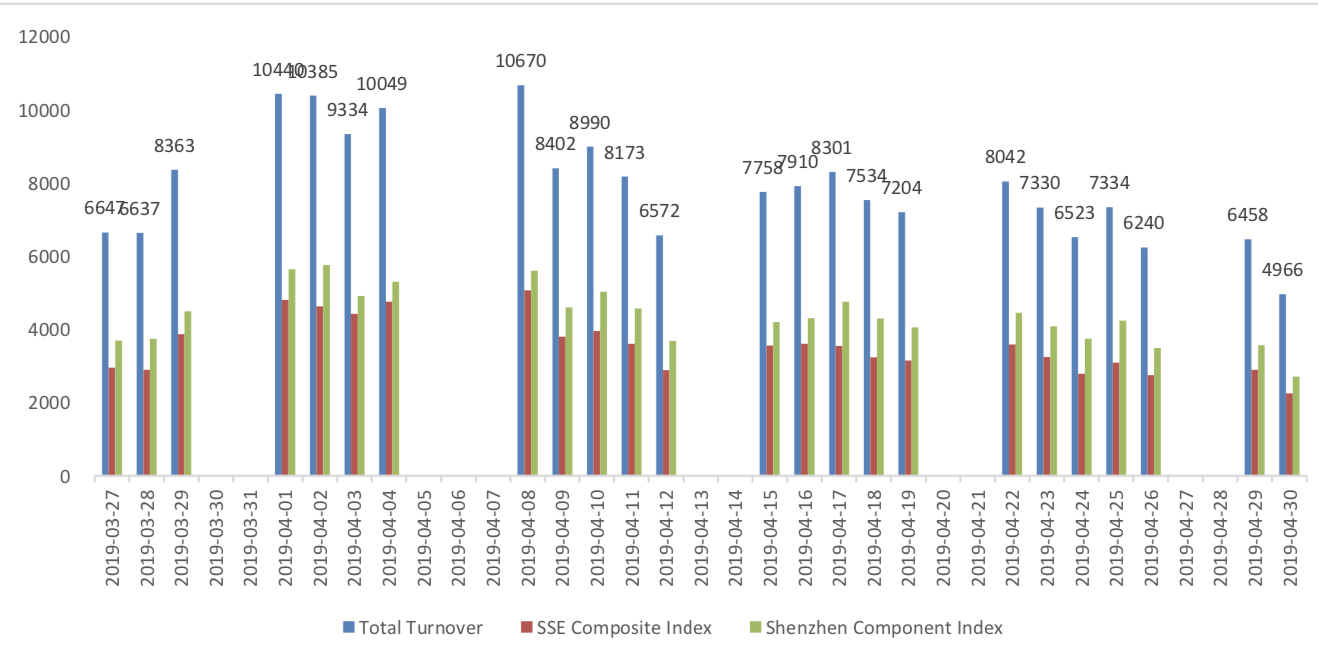
The average daily turnover of the whole market during past 5 trading days is 630.41 billion CNY, it decreased 17.94% compared with the previous 5-trading day period.
Graph 2: Market turnover
(2) Sectors Performance
In the view of sectors, during last week (from 2019-04-26 to 2019-04-30), 5 of 24 Wind Level-2 sector(s) increased while 19 sector(s) dropped. Specifically, Food & Staples Retailing (3.87%), Insurance (2.11%) and Household & Personal Products(0.80%) did the best performance while Semiconductors & Semiconductor Equipment (-5.52%), Telecommunication Services (-5.06%) and Media (-4.50%) did the worst performance.
Graph 3: Sectors performance under Wind Level-2 classification (%)

(3) Indices Valuation (TTM)
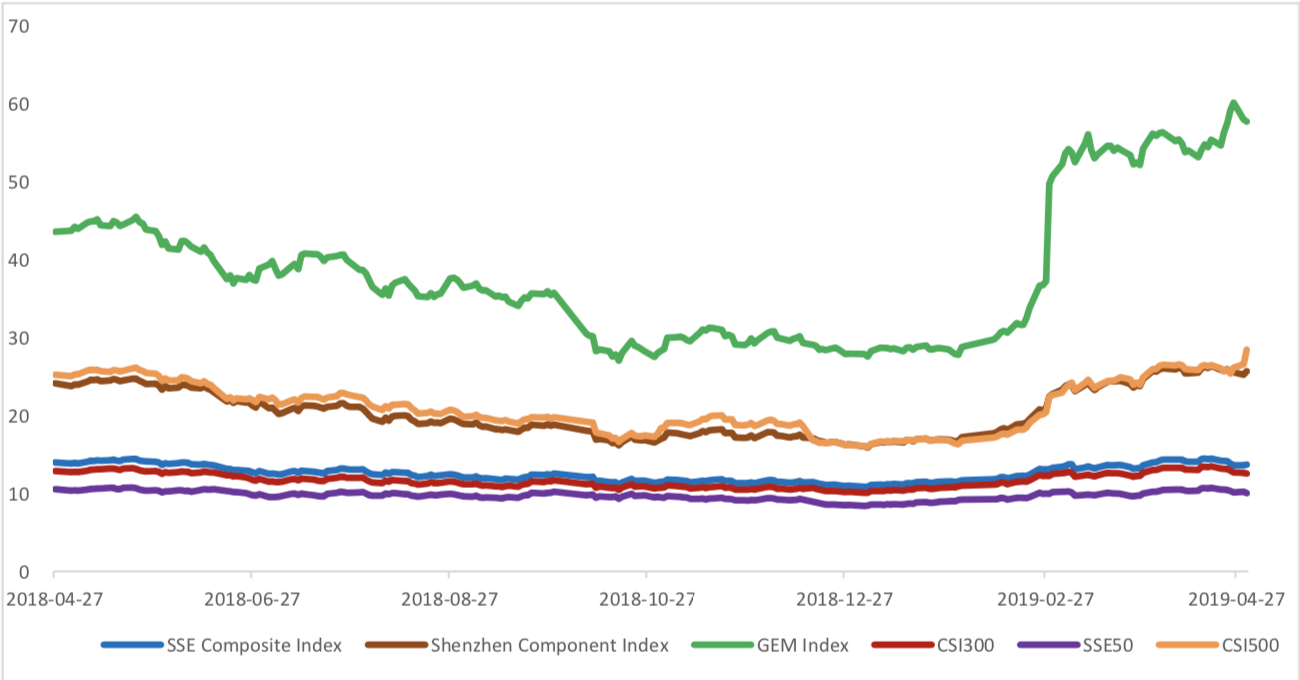
The current PE for SSE Composite Index, Shenzhen Component Index, GEM Index, CSI300, SSE50, CSI500 are 13.7177, 25.6769, 57.7105, 12.5732, 10.0487, 28.4464respectively; and these indices are at 31.70%, 41.30%, 71.10%, 43.20%, 43.50%, 28.90% percent rank level of their historic data, respectively
Graph 4: PE of 6 indices
Graph 5: PE percent rank of 6 indices (calculated by data of past 1200 trading days, only 1Y data is presented on the graph)

The current PB for SSE Composite Index, Shenzhen Component Index, GEM Index, CSI300, SSE50, CSI500 are 1.5185,2.6827,4.7397,1.5190,1.2443, 2.0682respectively, and these indices are at 32.10%, 30.10%, 38.60%, 52.20%, 55.70%, 15.30% percent rank level of their historic data, respectively.
Graph 6: PB of 6 indices

Graph 7: PB percent rank of 6 indices (calculated by data of past 1200 trading days, only 1Y data is presented on the graph)

(4) Foreign Fund Flow
Last week, there were 2 trading days for northward channel open for stock connect programs. During last week the total foreign fund flow via Stock Connect is 3.99 billion RMB, and the cumulative inflows was 749.17 billion RMB. Specifically, the fund flow via Shanghai-Hong Kong Stock Connect is 3.36 billion RMB and the fund flow via Shenzhen-Hong Kong Stock Connect is 0.63 billion RMB.
Graph 8: Fund flow via both Shanghai and Shenzhen-Hong Kong Stock Connect in past 1M (100 million CNY)

Graph 9: Fund flow via Shenzhen-Hong Kong Stock Connect in past 1M (100 million CNY)

Graph 10: Fund flow via both Shanghai-Hong Kong Stock Connect in past 1M (100 million CNY)

2. Index Futures
(1) Trading Volume and Open Interests
During past 5 trading days the average trading volume for CSI300(IF), SSE50(IH), CSI500(IC) contracts
are 129371 (7.80%, compared with the previous 5-trading day period),58496 (4.42%),99290 (27.36%) lots, respectively. On the last trading day, the total open interests for them are 121870 (-2.65%),61037 (2.24%),110006 (7.74%) lots respectively.
Graph 11: CSI300 Index futures’ trading volume

Graph 12: CSI300 Index futures’ open interests

Graph 13:SSE50 Index futures’ trading volume
Graph 14: SSE50 Index futures’ open interests

Graph 15: CSI500 Index futures’ trading volume

Graph 16: CSI500 Index futures’ open interests

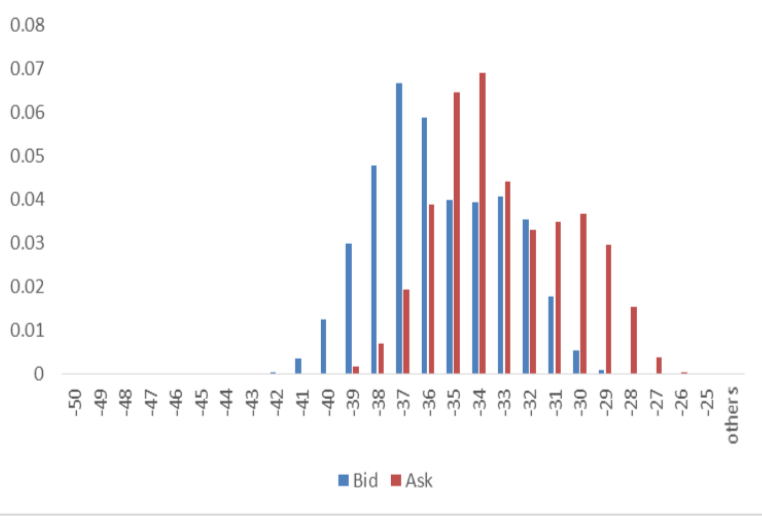
(2) Roll Level Bid-Ask Distribution
There are 2 trading days during last week, so the distribution is worked out with 14402 data points for each contract pair.
Graph 17: CSI300 Current/Next Month Contract Roll Spread Distribution (2s frequency)

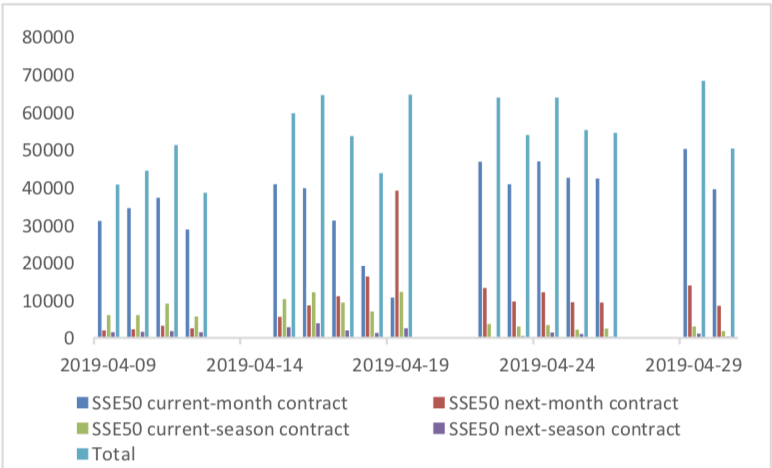
Graph 18: SSE50 Current/Next Month Contract Roll Spread Distribution (2s frequency)

Graph 19: CSI500 Current/Next Month Contract Roll Spread Distribution (2s frequency)
(3) Weekly Review of Future (Current Month)-Spot Arbitrage Opportunity
Assumption: risk-free rate: 3%; security borrowing cost: 8%; trading expense for spot: 0.025%; trading expense for futures: 0.005%; margin rates for futures contracts: 0.11 for CSI300 and SSE50, 0.13 for CSI500; margin rate for security borrowing: 0.3 (or 130% maintain rate).
When real price spread is out of theoretical range (calculated by our assumption), there exists absolute future-spot arbitrage opportunity.
Graph 20: Future (Current Month)-Spot Arbitrage Opportunity for CSI300 contract (in the view of price difference)

Graph 21: Future (Current Month)-Spot Arbitrage Opportunity for SSE50 contract (in the view of price difference)

Graph 22: Future (Current Month)-Spot Arbitrage Opportunity for CSI500 contract (in the view of price difference)

3. Financial Markets
(1) Interest Rates
The term structure of treasury bonds’ yields is currently upward sloping in concave shape.
Specifically, last week, short-term yields short term yield of Treasury bond experienced some fluctuation and 3M yield now at 2.2%-2.4% level. Furthermore, as for long-term yield, there is a small fluctuation. 10Y yield is about 3.2%-3.4%.
Graph 23: Term Structure Evolvement of Treasury Bonds Yields During Recent 3 Months (%)

As for Shibor rates, short-term rates experienced significant fluctuation. Specifically, O/N rate experienced obvious decrease to 1.6%-1.8% level.
Graph 24: Term Structure Evolvement of Shibor Rates During Recent 3 Months (%)

(2) ExchangeRates
During last week (up to 2019/04/30), CNY/USD changed -0.02% to 6.7366 and offshore rate, CNH/USD, changed -0.01% to 6.7378 and USD index changed -0.52%.
Graph 25: USD/CNY, USD/CNH and USD Index

Macroeconomic Topic:
On 2019/04/30, the March PMI data was released. The data showed a pullback in the PMI in April after a rebound in March. The manufacturing PMI was 50.1 percent, with pre-value of 50.5 percent. The non- manufacturing PMI was at 54.3 percent, with pre-value of 54.8 percent, while the composite PMI was at 53.4 percent, with pre-value of 54 percent.
April PMI Data
Graph A: PMI Data 60

(1) About 5 Sub-indexes for manufacturing PMI calculation
From the point of view of 5 sub-indexes: (1) the decline of PMI: production is the main reason for the decline of manufacturing PMI. It was reported at 52.1%, still in expansion zone, with preceding value of 52.7% and it drags PMI for 0.15 percentage points. (2)The decline of PMI: raw material storage is another important reason for the decline of manufacturing PMI. It was reported at 47.2%, still in contraction zone, with preceding value of 48.4% and it drags PMI for 0.12 percentage points. (3)The decline of PMI: employees is one relatively minor reason for the decline of manufacturing PMI. It was reported at 47.2%, still in contraction zone, with preceding value of 47.6% and it drags PMI for 0.08 percentage points. It was the lowest since December 2015. (4)The decline of PMI: new orders, is another relatively minor reason for the decline of manufacturing PMI. It was reported at 51.4%, still in expansion zone, with preceding value of 51.6% and it dragged PMI for 0.06 percentage points. (5)The improvement of PMI: Delivery time of supplier, gave a small positive force for manufacturing PMI. It was reported at 49.9%, back to expansion zone, with preceding value of 50.2% and it boosted PMI for 0.05 percentage points.
Graph B: PMI 5 sub-indexes

Graph C: PMI Change Contribution by 5 Sub-indexes

(2) About 8 Sub-indexes not for manufacturing PMI calculation
4 of 8 sub-indexes are above 50, in expansion zone and the remaining indexes are in contraction zone. Several points need to mention: there was a big rebound in the new export orders, with the PMI for new export orders rebounding from 47.1 per cent to 49.2 per cent, although still in contraction zone. In terms of new export orders, large and medium-sized enterprises have improved to varying degrees. Among them, the PMI of new export orders of small and medium-sized enterprises has improved most obviously, although the PMI of new export orders of large and medium-sized enterprises is still in the contraction zone. The PMI: Prospects for Production and Business Activities fell to 56.5 percent from 56.8 percent.
Graph D: PMI for 8 Sub-indexes not for manufacturing PMI calculation

(3) PMI by enterprises size
From the perspective of PMI of large and medium-sized enterprises, large enterprises have a slight decline in the expansion area, while small and medium-sized enterprises are still in the contraction area, and medium-sized enterprises have a decline, while small enterprises have a rise. The main reason for the differentiation of large and medium-sized enterprises lies in the production PMI.
Graph E: PMI by enterprises size

(4) Summary
We have noticed that the changes of PMI data are also seasonal to a certain extent. PMI tends to rebound to a certain extent in March after the Spring Festival, and then fall to a certain extent in April. However, the drop in this year was deeper.
Overall, although the PMI data shows that the PMI in expansion area, just back slightly the earlier than before. However, from the manufacturing PMI sub-index: production fell back, raw material inventory decreased, new orders of PMI continues to decline, prospects for production and business activities drop, especially in manufacturing PMI’s employment sub-index, which is not out of dropping trend and creating periodic low, verify the economic downward pressure alarm is not lift.
Copyright by fangquant.com
Currently no Comments.
Hot Topics
The 13rd China International Future Forum
The Shanghai Derivatives Energy Forum has received extensive attention from relevant industries both within and outside the borders.
Financial institutions deep explore commodity market opportunities, commodity index financial products show full-scale trend
R-Code for analysis: getKDJ
R-Code@June 06, 2016
New indicator to analyze the arbitrage opportunities between sse50 and csi500
Market review: January 11, 2017
The Great China Bubble: Anniversary Lessons and Outlook
Quant Investment in China A-share market
The hedge strategy between SSE50 and A50--Jan 13,2017
The arbitraging strategy between CSI300 and SSE50
Market review: June 17, 2016
Sleepless in London--Enda Homan(Allied Irish Banks Plc)
MSCI Rebuffs Chinese Equities for Third Time in Blow to Xi
Soros, Druckenmiller among hedgies profiting in market plunge