FangQuant › Financial Futures
Market Summary:
Last week, there was generally obvious decrease over the market. SSE Composite Index (000001.SH) changed -5.64 % to 3086.40. Specifically, large cap shares perform slightly better than small cap shares and we can observe that SSE50 did better than CSI500 (-4.92% vs -6.92%). The trading activity shrank as the average daily turnover dropped to 709.37 billion RMB, a decrease of 8.37%.
Unlike previous periods, fund flow via stock connect programs continued to show outflow over the whole week (for 4 days of stock connect open). The cumulative outflows over last week was 12.77 billion RMB. Usually, as foreign fund generally prefers valuation stocks and the valuation level over recent weeks was not as attractive (e.g. PE of SSE50 and CSI300 were at around 50-60% percent rank level) as before due to sudden market increase, foreign investors may prefer to lock the profit. However, due to obvious decrease, valuation level shrank significantly, foreign funds may stop continuous outflow.
After TMLF, the central bank also made a statement on the direction of monetary policy. On April 25, central bank officials said that prudent monetary policy was generally properly and moderately tightened, which had not been relaxed and could not be said to be tightened now. Undertaking such operations as reverse repurchase or MLF does not mean that the direction of monetary policy should be relaxed, but only to adjust short-term liquidity.
With several weeks of observation, we find that the long-term interest rate (10Y Treasury bond yield) has experienced continuous rising. Thus, the term structure is more up-ward sloping, indicating tighten liquidity prospect. As the central bank indicated no future relaxing or tightening and broke the rumors of ‘decrease reserve ratio’ twice, there may be no future reserve ratio drop, which was expected by the market, in short term. Then, long-term interest rate rose over recent weeks.
CFFEX, relaxed restrictions on index futures trading. Last week, index futures trading was more activated, total open index and total trading volume both increased.
News:
(1) Shanghai Securities Daily: Wang Yong of Shanghai Stock Exchange: In May, the Shanghai Stock Exchange will start the whole-network test for Scientific Innovation board, and plan to complete all technical and institutional preparations by the end of May.
(2) The U.S. dollar index hit its highest level in nearly two years on Monday amid growing economic polarization between the United States and other major developed countries, Xinhua reported. However, the market expects the U.S. economy to grow with insufficient momentum, and the U.S. dollar index may weaken. Paul Ashworth, chief US economist at Kaishou Macro, an international economic analyst, predicts that the US economy will continue to slow this year and force the Fed to cut interest rates by the end of this year.
(3) Wind: the outcome list of the second "one belt and one way" International Cooperation summit has been released. The list includes the initiatives or initiatives initiated by the Chinese side, the multi bilateral cooperation documents signed during the summit or on the eve of the summit, the multilateral cooperation platform established under the framework of the Summit Forum, the list of investment projects and projects, the financing projects, and the cooperation between Chinese and foreign local governments and enterprises. There are 283 items in 6 categories. Xi Jinping: the entrepreneur meeting held during the forum attracted many business people and signed a project cooperation agreement with a total amount of about $64 billion. These achievements fully show that building the "one belt and one road" should conform to the trend and win the hearts of the people, the people and the world.
(4) Securities Regulatory Commission responds to "relax the requirements of IPO earnings and speed up the pace of audit": I will adhere to the normal issuance of new shares, strictly follow the existing laws and regulations, audit the main board, small and medium-sized board, GEM start-ups, and there is no new adjustment in the audit policy; the next step will give full play to the important role of capital market in allocating resources, continue to maintain the normal issuance of new shares, and strictly control capital. Entry barriers will increase market predictability and better serve the high-quality development of the real economy.
(5) The total profit of Industrial Enterprises above the scale in March was 589.52 billion yuan, up 13.9% from the same period last year, while the total profit in January-March was 1297.2 billion yuan, down 3.3% from the same period last year. The Statistics Bureau interpreted that the growth rate of industrial profits rose sharply in March: the growth of production and sales accelerated, and the price stably rose, which increased industrial profits by about 26.8 billion yuan year-on-year, 4.5 percentage points more than that in January-February; the profits of key industries such as automobile, petroleum processing, steel and chemical industry recovered markedly; and the benefits of industrial enterprises improved.
(6)China Securities Daily: Market participants said that, in view of the current rebound, the main driving force is the restoration of valuation brought about by liquidity improvement, but in the near future it has gradually turned to the fundamental performance drive; the rebound logic is still valid, which means that the rebound will not end there, so the market shocks should be more patient.
1. StockMarket
(1) Indices Performance
During last week, SSE Composite Index (000001.SH) changed -5.64 % to 3086.40, SHENZHEN COMPONENT INDEX (399001.SZ) changed -6.12 % to 9780.82, ChiNext PRICE INDEX (399006.SZ) changed -3.38 % to 1657.82, CSI 300 INDEX (000300.SH) changed -5.61 % to 3889.27, CSI SmallCap 500 index (000905.SH) changed -6.92 % to 5408.03, SSE 50 Index (000016.SH) changed -4.92 % to 2892.86.
Graph 1: Indices Performance over past 3 months

The average daily turnover of the whole market during past 5 trading days is 709.37 billion CNY, it decreased 8.37% compared with the previous period.
Graph 2: Market turnover

In the view of sectors, during last week(from 2019-04-19 to 2019-04-26), 1 of 24 Wind Level-2 sector(s) increased while 23 sector(s) dropped. Specifically, Telecommunication Services (0.92%), Food, Beverage & Tobacco(-0.66%) and Insurance (-2.09%) did the best performance while Automobiles & Components(-8.73%), Capital Goods(-7.80%) and Materials (-7.54%) did the worst performance.
Graph 3: Sectors performance under Wind Level-2 classification (%)

(3) Indices Valuation (TTM)
The current PE for SSE Composite Index, Shenzhen Component Index, GEM Index, CSI300, SSE50, CSI500 are 13.6287, 25.5295, 60.1376, 12.6942, 10.1395, 26.1323respectively; and these indices are at 30.40%, 40.70%, 78.10%, 45.60%, 46.00%, 20.60% percent rank level of their historic data, respectively
Graph 4: PE of 6 indices

Graph 5: PE percent rank of 6 indices (calculated by data of past 1200 trading days, only 1Y data is presented on the graph)

The current PB for SSE Composite Index, Shenzhen Component Index, GEM Index, CSI300, SSE50, CSI500 are 1.5185,2.6827,4.7397,1.5190,1.2443, 2.0682respectively, and these indices are at 32.10%, 30.10%, 38.60%, 52.20%, 55.70%, 15.30% percent rank level of their historic data, respectively.
Graph 6: PB of 6 indices

Graph 7: PB percent rank of 6 indices (calculated by data of past 1200 trading days, only 1Y data is presented on the graph)

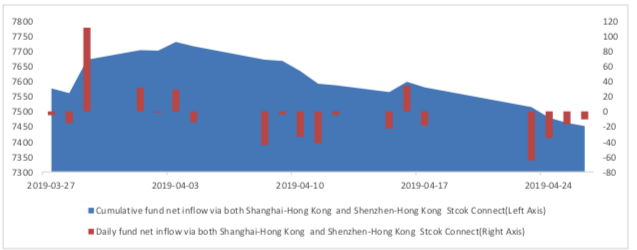
(4) Foreign Fund Flow
During last week the total foreign fund flow via Stock Connect is -12.77 billion RMB, and the cumulative inflows was 745.19 billion RMB. Specifically, the fund flow via Shanghai-Hong Kong Stock Connect is -8.34 billion RMB and the fund flow via Shenzhen-Hong Kong Stock Connect is -4.43 billion RMB.
Graph 8: Fund flow via both Shanghai and Shenzhen-Hong Kong Stock Connect in past 1M (100 million CNY)
Graph 9: Fund flow via Shenzhen-Hong Kong Stock Connect in past 1M (100 million CNY)

Graph 10: Fund flow via both Shanghai-Hong Kong Stock Connect in past 1M (100 million CNY)

2. Index Futures
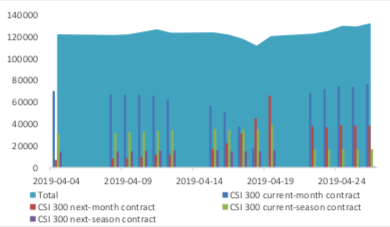
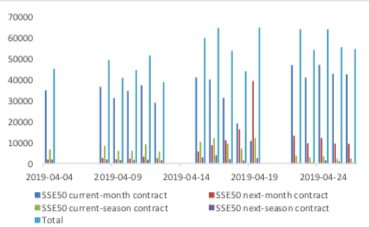
(1) Trading Volume and Open Interests
During past 5 trading days the average trading volume for CSI300(IF), SSE50(IH), CSI500(IC) contracts
are 132270 (9.22%),58344 (1.86%),88506 (10.00%) lots, respectively. On the last trading day, the total open interests for them are 132304 (9.71%),62871 (5.22%),107322 (14.95%) lots respectively.
Graph 11: CSI300 Index futures’ trading volume

Graph 12: CSI300 Index futures’ open interests
Graph 13:SSE50 Index futures’ trading volume
Graph 14: SSE50 Index futures’ open interests

Graph 15: CSI500 Index futures’ trading volume

Graph 16: CSI500 Index futures’ open interests

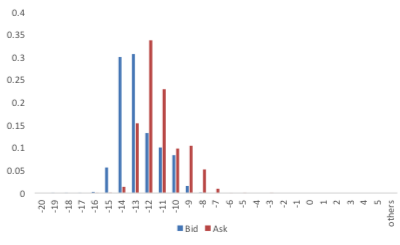
(2) Roll Level Bid-Ask Distribution
There are 5 trading days during last week, so the distribution is worked out with 36005 data points for each contract pair.
Graph 17: CSI300 Current/Next Month Contract Roll Spread Distribution (2s frequency)

Graph 18: SSE50 Current/Next Month Contract Roll Spread Distribution (2s frequency)
Graph 19: CSI500 Current/Next Month Contract Roll Spread Distribution (2s frequency)

3. Financial Markets
(1) Interest Rates
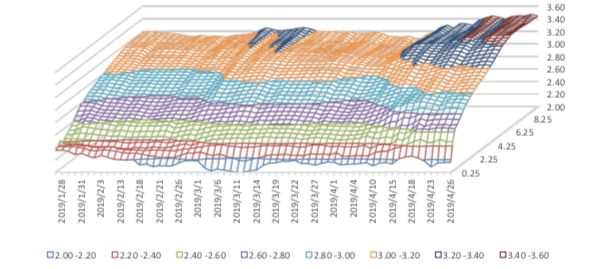
The term structure of treasury bonds’ yields is currently upward sloping in concave shape.
Specifically, last week, short-term yields short term yield of Treasury bond experienced some fluctuation and 3M yield now at 2.0%-2.2% level. Furthermore, as for long-term yield, there is a small upward move. 10Y yield is about 3.4%-3.6%.
Graph 20: Term Structure Evolvement of Treasury Bonds Yields During Recent 3 Months (%)
As for Shibor rates, short-term rates experienced significant fluctuation. Specifically, O/N rate experienced obvious decrease to 2.0%-2.2% level.
Graph 21: Term Structure Evolvement of Shibor Rates During Recent 3 Months (%)

(2) ExchangeRates
During last week, CNY/USD changed 0.52% to 6.7381 and offshore rate, CNH/USD, changed 0.54% to 6.7384 and USD index changed 0.68%.
Graph 22: USD/CNY, USD/CNH and USD Index

Macroeconomic Topic:
From January to March, China's urban fixed assets investment was 10.19 trillion RMB, a 6.3% year-on- year increase, with a pre-value of 6.1%. Here, the investment in real estate development nationwide reached 2.38 trillion yuan, an year-on-year increase of 11.8% in nominal terms.
March Fixed Assets Data
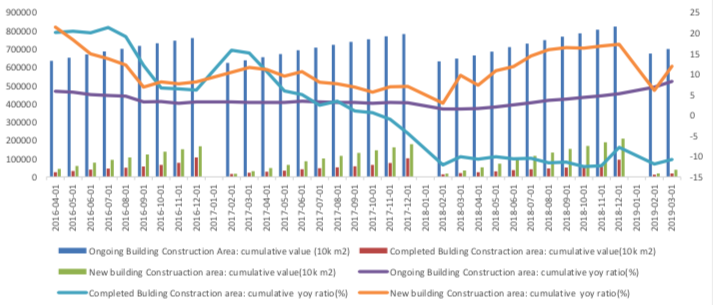
From January to March, the cumulative growth rate of fixed assets investment was 6.3% year-on-year, continuing the slow recovery trend. From the structural point of view, the growth rate of real estate investment has slightly increased, manufacturing investment has slightly declined, and infrastructure investment has continued to rise.
Graph A: Investment Completion of Fixed Assets (100m RMB)

Real estate investment grew even faster. Infrastructure construction rebound. Manufacturing investment has fallen sharply.
Graph B: Investment Completion of Real Estate Development, Manufacturing Industry, Infrastructure Construction

From January to March, the investment in real estate development increased by 11.8% year-on-year, and the growth rate was 2.1 percentage points higher than that of last year. From building construction data, the growth rate of new construction area (11.9%), ongoing construction area (8.2%) and completed construction area has rebounded (-10.8%), among which the marginal rebound rate of new construction area is the largest. It seems that the improvement of real estate demand should be related to the centralized release of pre-suppressed demand under the "city-by-city" policy.
Graph C: Build Construction Data
Infrastructure investment grew by 4.4% year on year, 0.1 percentage point higher than the previous period. It is expected that with the counter-cyclical policy, the growth rate of infrastructure investment will rebound in the future.
This period of manufacturing investment continued the downward trend last month, down 1.3 percentage points to 4.6% from last month. The negative suppression of corporate profit decline still exists. Structurally, automotive manufacturing, equipment manufacturing and non-ferrous metals have fallen significantly; computer growth has rebounded significantly year-on-year, but it is mainly affected by the lower data in the previous period.
Private investment completion of fixed assets still declined. From January to March, the cumulative growth rate of private fixed assets investment was 6.4% year-on-year, which was 1.1 percentage points lower than the previous period.
Graph D: Private Investment Completion of Fixed Assets
In the future, the investment in fixed assets will be affected by the implementation of counter-cyclical policies and the resilience of real estate investment, and the growth rate of investment may rebound slightly.
Copyright by fangquant.com
Currently no Comments.
Hot Topics
The 13rd China International Future Forum
The Shanghai Derivatives Energy Forum has received extensive attention from relevant industries both within and outside the borders.
Financial institutions deep explore commodity market opportunities, commodity index financial products show full-scale trend
R-Code for analysis: getKDJ
R-Code@June 06, 2016
New indicator to analyze the arbitrage opportunities between sse50 and csi500
Market review: January 11, 2017
The Great China Bubble: Anniversary Lessons and Outlook
Quant Investment in China A-share market
The hedge strategy between SSE50 and A50--Jan 13,2017
The arbitraging strategy between CSI300 and SSE50
Market review: June 17, 2016
Sleepless in London--Enda Homan(Allied Irish Banks Plc)
MSCI Rebuffs Chinese Equities for Third Time in Blow to Xi
Soros, Druckenmiller among hedgies profiting in market plunge