FangQuant › Financial Futures
Market Summary:
Last week, there was generally decrease over the market. SSE Composite Index (000001.SH) changed -1.02 % to 2852.99. Specifically, large cap shares perform slightly better than small cap shares and we can observe that SSE50 did better than CSI500 (-1.21% vs -2.04%). The trading activity shrank as the average daily turnover dropped to 451.40 billion RMB, a decrease of 10.81%.
Fund flow via stock connect programs continued to show outflow over the whole week. The cumulative outflows over last week was 16.34 billion RMB.
RMB exchange rate stopped trend of depreciation. Also, at the weekend, Guo Shuqing said in his speech that China's economic fundamentals determine that the RMB cannot continue to depreciate, speculative shorting of the RMB will inevitably suffer huge losses.
Furthermore, we observed plenty of arbitrage opportunities last week with indices futures. CSI500 indices future show obvious discount relative to spot. For CSI300 contracts, next-month and current-month contract price difference show arbitrage opportunities on 5/20. For SSE50 contracts, next-month and current- month contract price difference show arbitrage opportunities on almost the whole week.
News:
(1) The Central Bank and the Banking Insurance Regulatory Commission answered the reporter's questions on taking over the contractor bank: After taking over, the contractor bank will maintain its normal operation by providing liquidity support, timely allocation of sufficient cash, ensuring smooth operation of the payment system, and constantly increase policy support for small and medium-sized banks to further improve their corporate governance, so that the development of small and medium-sized banks will be healthier.
(2) People's Daily Zhong Sheng commentary article pointed out that for some time, the United States government has abused its national power and frequently opened fire on China's high-tech enterprises such as Huawei, who have made strenuous efforts to reach the forefront of the world. The United States refuses to compete, which hinders development and progress. The "blockade" of its opponents cannot guarantee its leading position, and the improper means are by no means the "trump card" of the United States in an invincible position. Refusing to compete will only impact the global supply chain and add unnecessary risks to the world economy.
(3) Wind: FTSE Russell announced the quarterly changes of its global stock index series in June 2019 in the early morning of May 25, including the list of A shares included in its global stock index series, which will take effect after the closing date of June 21. A total of 1097 A-shares were listed, including 292 large-cap stocks, 422 medium-cap stocks, 376 small-cap stocks and 7 Micro-Cap stocks.
(4) The "2009 Tsinghua Wudaokou Global Financial Forum" sponsored by Tsinghua University was held from May 25 to 26. Guo Shuqing appointed Mr. Xiao Yuanqi to read the speech on behalf of him because of temporary arrangements. Guo Shuqing said in his speech that China's economic fundamentals determine that the RMB cannot continue to depreciate, speculative shorting of the RMB will inevitably suffer huge losses.
(5) Lu Lei, deputy director of the State Administration of Foreign Exchange, issued the China Financial Policy Report 2019, pointing out that structural adjustment focuses on the development of direct financing, while the financial system dominated by indirect financing cannot fully serve to support the development of modern economy. The development of direct finance can realize the virtuous circle of serving the development of real economy and financial system at the same time.
1. StockMarket
(1) Indices Performance
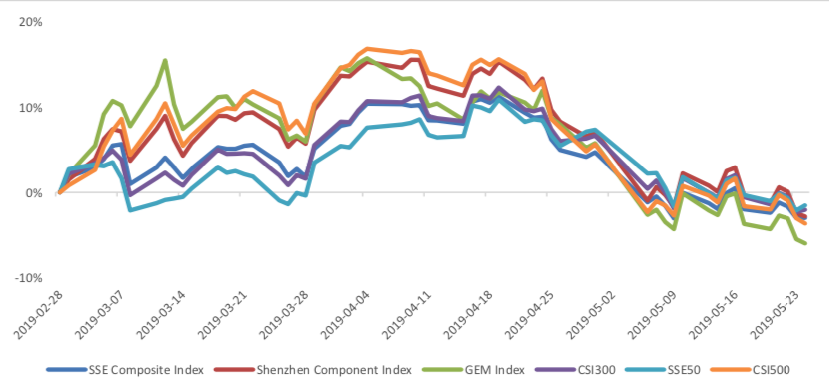
During last week, SSE Composite Index (000001.SH) changed -1.02 % to 2852.99, SHENZHEN COMPONENT INDEX (399001.SZ) changed -2.48 % to 8776.77, ChiNext PRICE INDEX (399006.SZ) changed -2.37 % to 1443.75, CSI 300 INDEX (000300.SH) changed -1.50 % to 3593.91, CSI SmallCap 500 index (000905.SH) changed -2.04 % to 4841.76, SSE 50 Index (000016.SH) changed -1.21 % to 2702.03.
Graph 1: Indices Performance over past 3 months
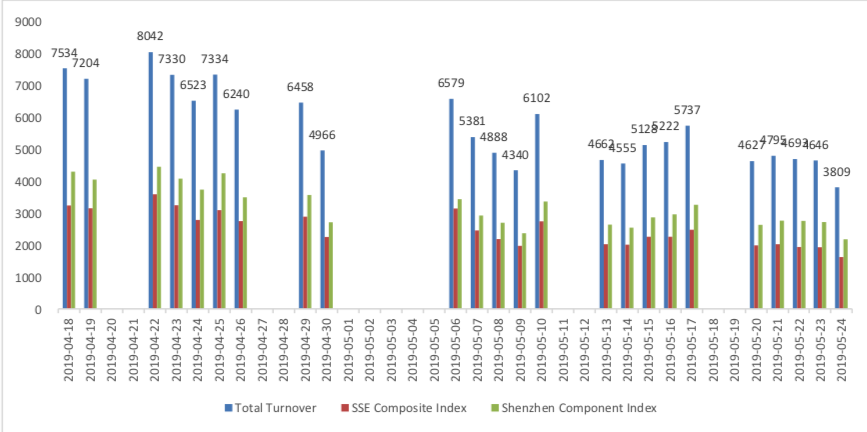
The average daily turnover of the whole market during past 5 trading days is 451.40 billion CNY, it decreased 10.81% compared with the previous 5-trading day period.
Graph 2: Market turnover
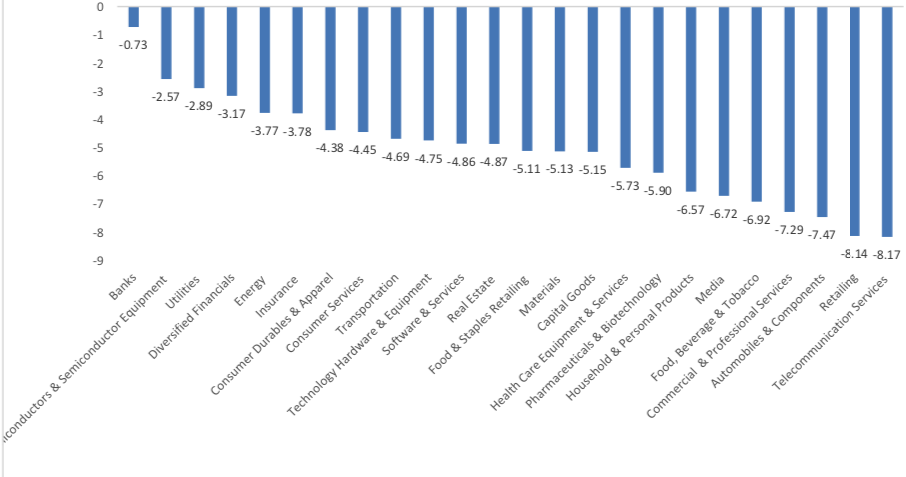
In the view of sectors, during last week (from 2019-05-17 to 2019-05-24), 0 of 24 Wind Level-2 sector(s) increased while 24 sector(s) dropped. Specifically, Banks(-0.73%), Semiconductors & Semiconductor Equipment (-2.57%) and Utilities (-2.89%) did the best performance while Telecommunication Services (-8.17%), Retailing(-8.14%) and Automobiles & Components(-7.47%) did the worst performance.
Graph 3: Sectors performance under Wind Level-2 classification (%)
(3) Indices Valuation (TTM)
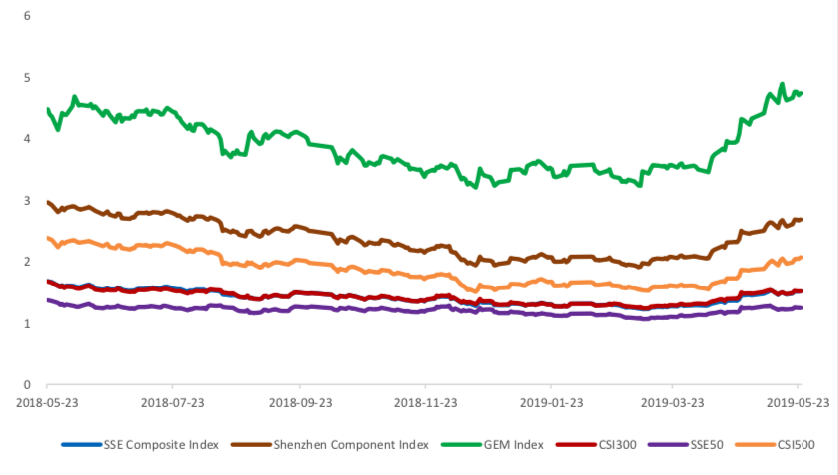
The current PE for SSE Composite Index, Shenzhen Component Index, GEM Index, CSI300, SSE50, CSI500 are 12.7208, 23.0201, 51.8011, 11.6409, 9.3490, 25.9808respectively; and these indices are at 22.10%, 30.20%, 53.50%, 25.90%, 23.10%, 19.90% percent rank level of their historic data, respectively
Graph 4: PE of 6 indices
Graph 5: PE percent rank of 6 indices (calculated by data of past 1200 trading days, only 1Y data is presented on the graph)

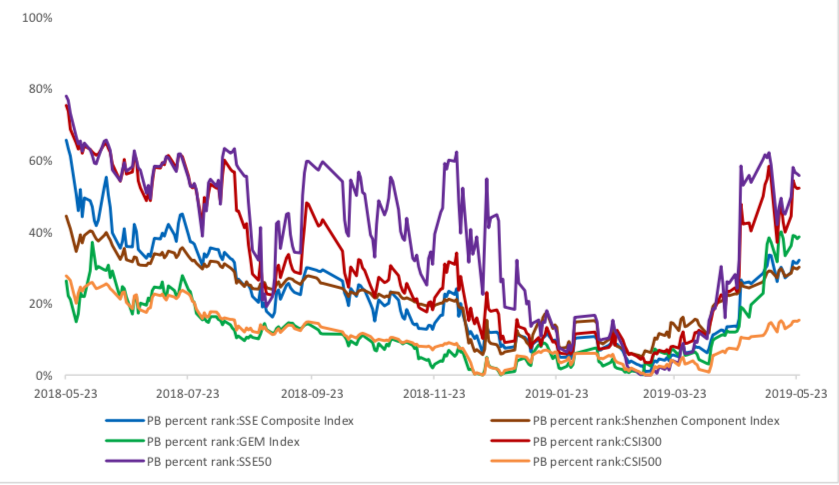
The current PB for SSE Composite Index, Shenzhen Component Index, GEM Index, CSI300, SSE50, CSI500 are 1.5185,2.6827,4.7397,1.5190,1.2443, 2.0682respectively, and these indices are at 32.10%, 30.10%, 38.60%, 52.20%, 55.70%, 15.30% percent rank level of their historic data, respectively.
Graph 6: PB of 6 indices
Graph 7: PB percent rank of 6 indices (calculated by data of past 1200 trading days, only 1Y data is presented on the graph)
(4) Foreign Fund Flow
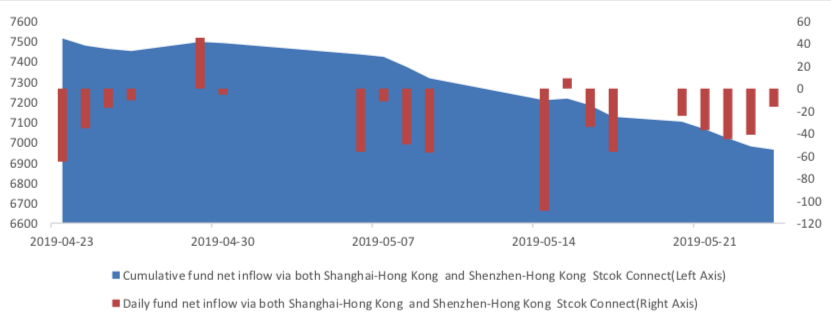
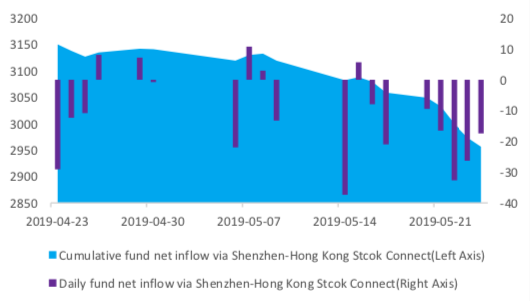
Last week, there were 5 trading days for northward channel open for stock connect programs. During last week the total foreign fund flow via Stock Connect is -16.34 billion RMB, and the cumulative inflows was 696.43 billion RMB. Specifically, the fund flow via Shanghai-Hong Kong Stock Connect is -6.09 billion RMB and the fund flow via Shenzhen-Hong Kong Stock Connect is -10.25 billion RMB.
Graph 8: Fund flow via both Shanghai and Shenzhen-Hong Kong Stock Connect in past 1M (100 million CNY)
Graph 9: Fund flow via Shenzhen-Hong Kong Stock Connect in past 1M (100 million CNY)
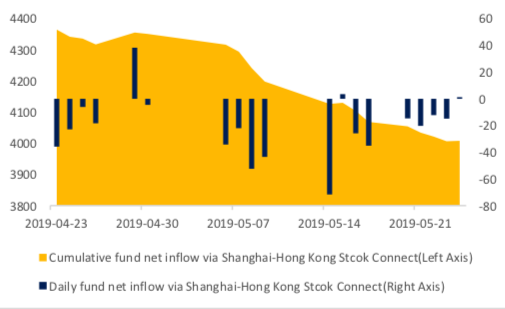
Graph 10: Fund flow via both Shanghai-Hong Kong Stock Connect in past 1M (100 million CNY)
2. Index Futures
(1) Trading Volume and Open Interests
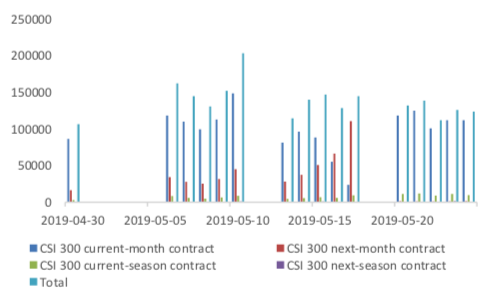
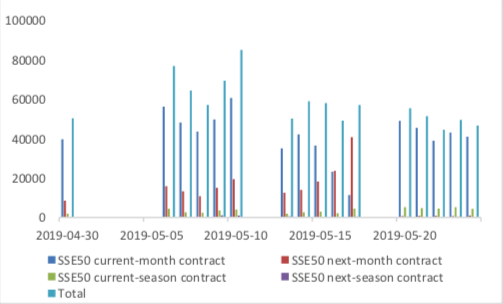
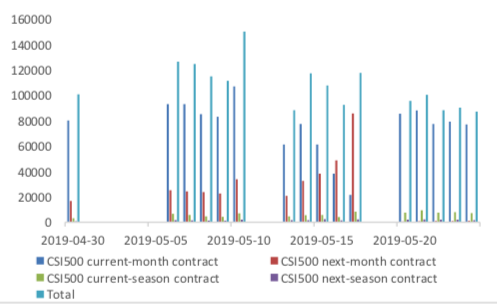
During past 5 trading days the average trading volume for CSI300(IF), SSE50(IH), CSI500(IC) contracts
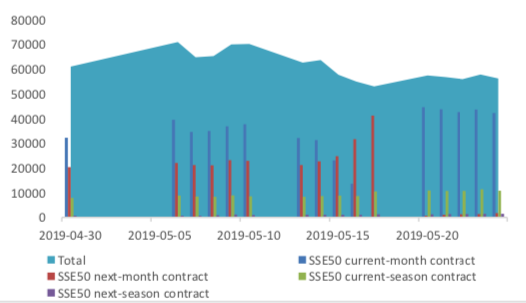
are 126252 (-6.24%, the previous 5-trading day period),49516 (-9.37%),92362 (-11.84%) lots, respectively. On the last trading day, the total open interests for them are 116772 (1.87%),56265 (6.12%),115550 (3.72%) lots respectively.
Graph 11: CSI300 Index futures’ trading volume
Graph 12: CSI300 Index futures’ open interests

Graph 13:SSE50 Index futures’ trading volume
Graph 14: SSE50 Index futures’ open interests
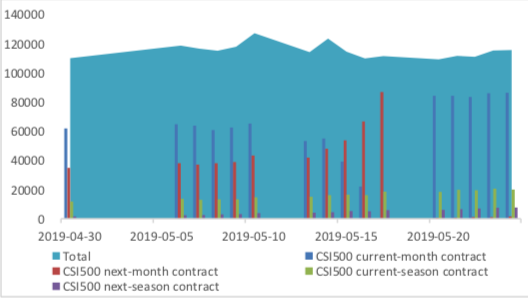
Graph 15: CSI500 Index futures’ trading volume
Graph 16: CSI500 Index futures’ open interests
(2) Roll Level Bid-Ask Distribution
There are 5 trading days during last week, so the distribution is worked out with 36005 data points for each contract pair.
Graph 17: CSI300 Current/Next Month Contract Roll Spread Distribution (2s frequency)

Graph 18: SSE50 Current/Next Month Contract Roll Spread Distribution (2s frequency)
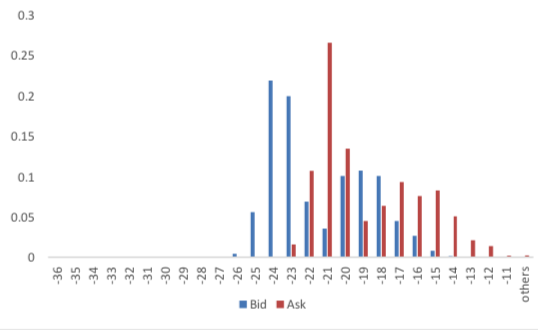
Graph 19: CSI500 Current/Next Month Contract Roll Spread Distribution (2s frequency)

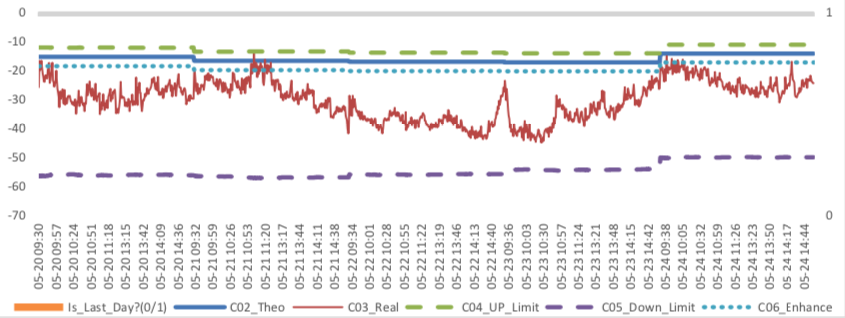
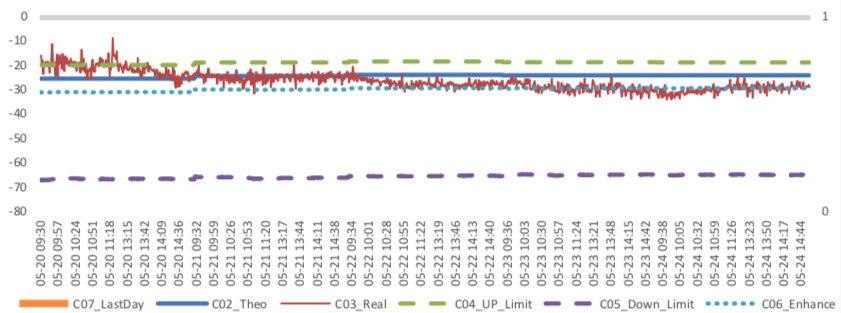
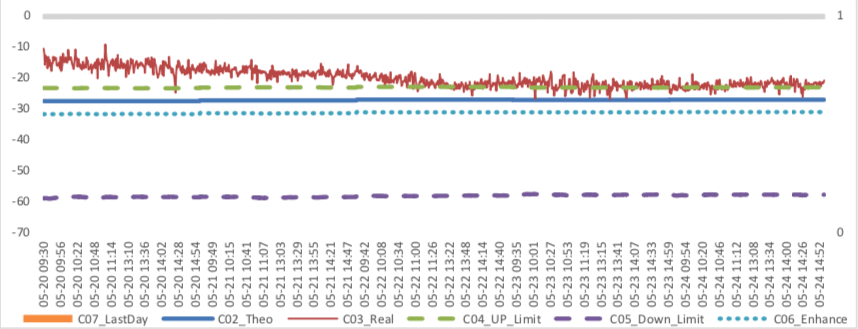
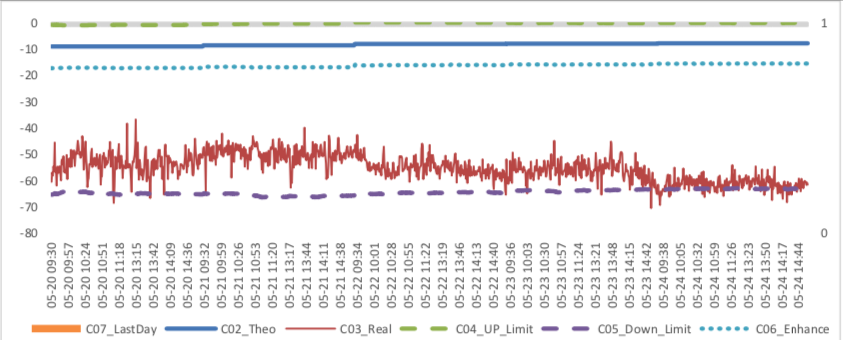
Assumption: risk-free rate: 3%; security borrowing cost: 8%; trading expense for spot: 0.025%; trading expense for futures: 0.005%; margin rates for futures contracts: 0.11 for CSI300 and SSE50, 0.13 for CSI500; margin rate for security borrowing: 0.3 (or 130% maintain rate).
When real price spread is out of theoretical range (calculated by our assumption), there exists absolute future-spot arbitrage opportunity.
Graph 20: Future (Current Month)-Spot Arbitrage Opportunity for CSI300 contract (in the view of price difference)
Graph 21: Future (Current Month)-Spot Arbitrage Opportunity for SSE50 contract (in the view of price difference)

Graph 22: Future (Current Month)-Spot Arbitrage Opportunity for CSI500 contract (in the view of price difference)
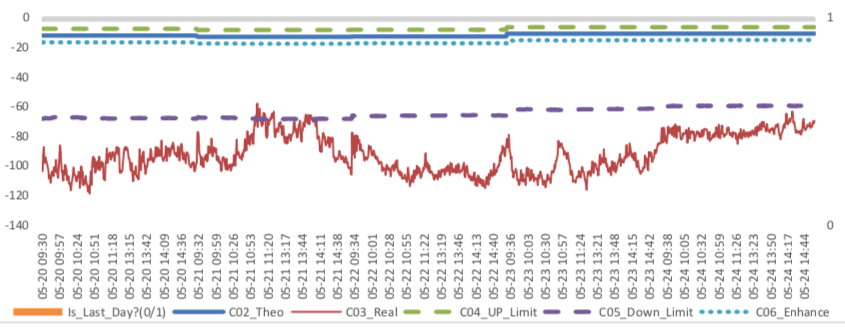
Graph 23: Future (Next Month-Current Month) Arbitrage Opportunity for CSI300 contract (in the view of price difference)
Graph 24: Future (Next Month-Current Month) Arbitrage Opportunity for SSE50 contract (in the view of price difference)
Graph 25: Future (Next Month-Current Month) Arbitrage Opportunity for CSI500 contract (in the view of price
difference)
3. Financial Markets
(1) Interest Rates
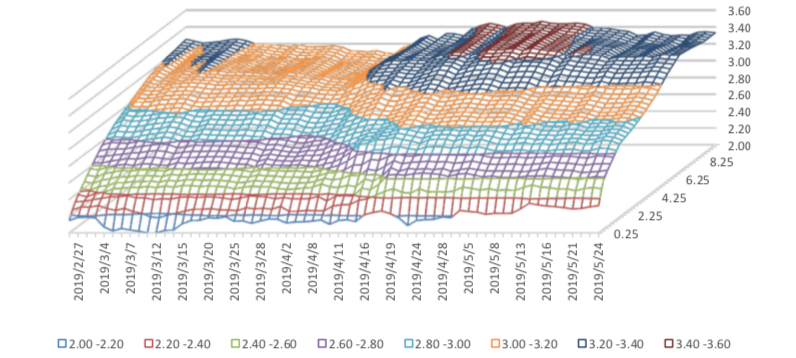
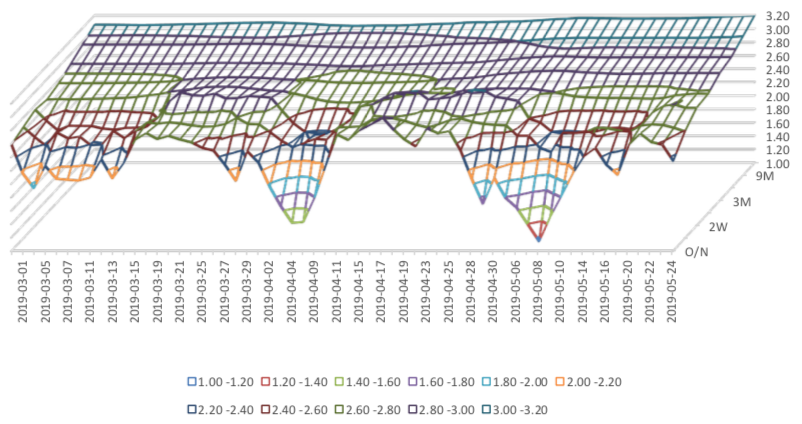
The term structure of treasury bonds’ yields is currently upward sloping in concave shape.
Specifically, last week, short-term yields short term yield of Treasury bond experienced some fluctuation and 3M yield now at 2.2%-2.4% level. Furthermore, as for long-term yield, there is a small fluctuation. 10Y yield is about 3.2%-3.4%.
Graph 26: Term Structure Evolvement of Treasury Bonds Yields During Recent 3 Months (%)
As for Shibor rates, short-term rates experienced significant fluctuation. Specifically, O/N rate experienced obvious fluctuation to 2.0%-2.2% level.
Graph 27: Term Structure Evolvement of Shibor Rates During Recent 3 Months (%)
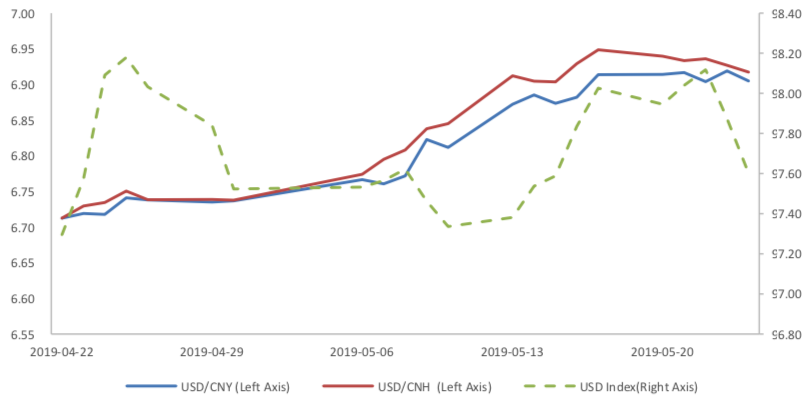
(2) ExchangeRates
During last week, CNY/USD changed -0.13% to 6.9050 and offshore rate, CNH/USD, changed -0.45% to 6.9175 and USD index changed -0.43%.
Graph 28: USD/CNY, USD/CNH and USD Index
Macroeconomic Topic:
Data released by the National Bureau of Statistics show that in April, the added value of industries above scale increased by 5.4% in terms of monthly year-on-year ratio, with the pre-value of 8.5%; in January-April, the national fixed assets investment increased by 6.1% in nominal terms, with pre-value of 6.3%; and in April, the total retail sales of consumer goods increased by 7.2% in terms of monthly year-on- year ratio, with pre-value of 8.7%.
April Economic Data
(1) Fixed Assets Investment
From January to April, the cumulative growth rate of fixed assets investment was 6.1% year-on-year, continuing the slow recovery trend. From the structural point of view, the growth rate of real estate investment has slightly increased, manufacturing investment has slightly declined, and infrastructure investment kept unchanged.
Graph A: Investment Completion of Fixed Assets (100m RMB)
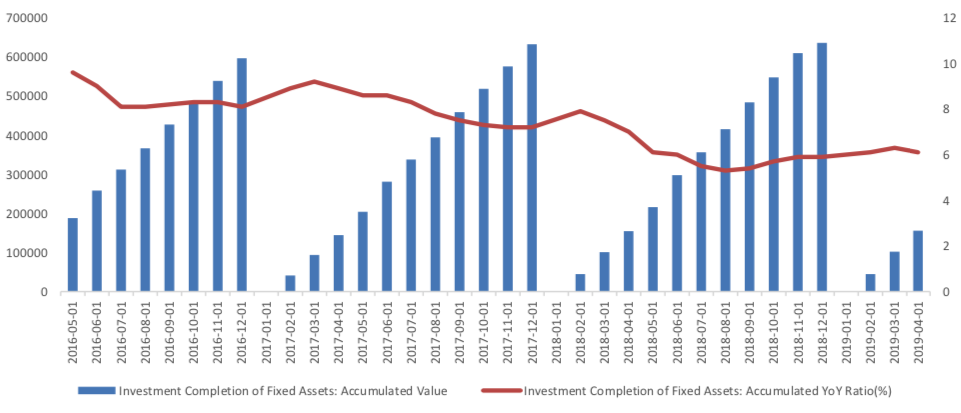
Real estate investment grew even faster. Infrastructure construction kept unchanged. Manufacturing investment has fallen obviously.
Graph B: Investment Completion of Real Estate Development, Manufacturing Industry, Infrastructure Construction
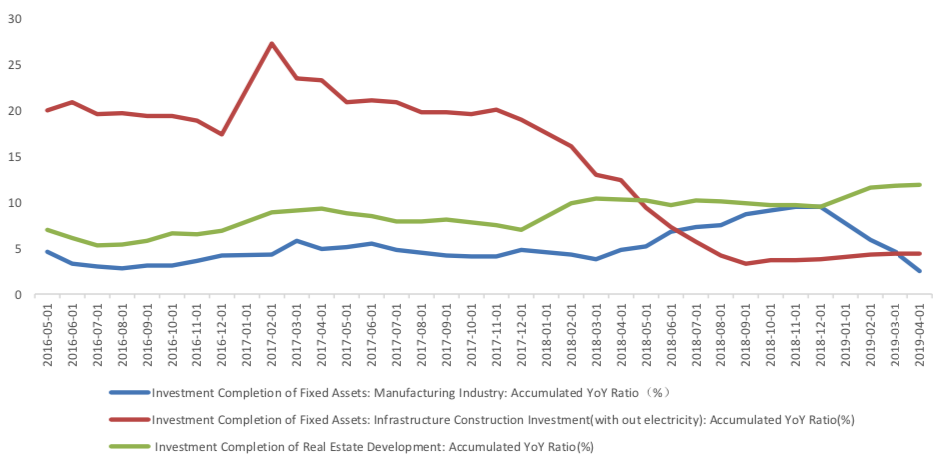
From January to April, investment in infrastructure (excluding electricity) increased by 4.4% year-on- year, which was the same as the cumulative growth rate in January-March.
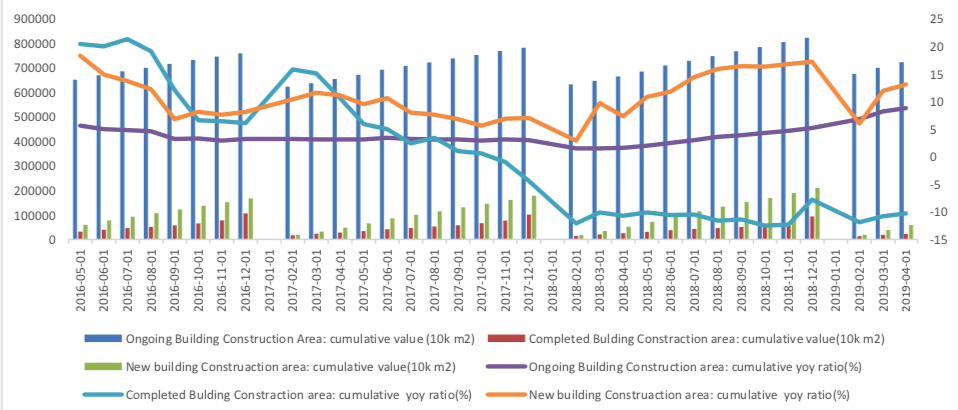
From January to April, real estate investment increased by 11.9% year-on-year, 0.1 percentage points faster than the previous value, continuing the high growth. In April, the growth rate of housing construction area was further accelerated. From January to April, the cumulative growth rate was 8.8% year-on-year, which was higher than the previous value of 8.2%. It played an obvious role in promoting real estate development investment in the same period.
Graph C: Build Construction Data
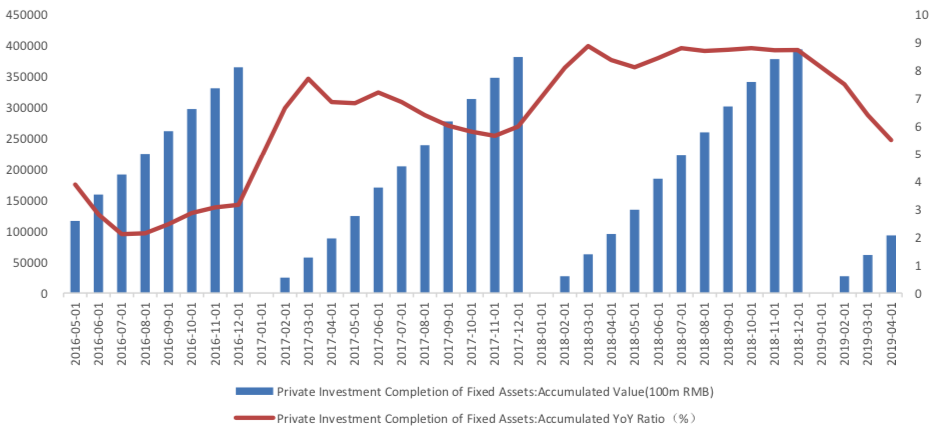
Private investment completion of fixed assets still declined. From January to April, the cumulative growth rate of private fixed assets investment was 5.5% year-on-year, which was 0.9 percentage points lower than the previous period.
Graph D: Private Investment Completion of Fixed Assets
In the future, the investment in fixed assets will be affected by the implementation of counter-cyclical policies and the resilience of real estate investment, and the growth rate of investment may rebound slightly.
(2) Industrial Value Added
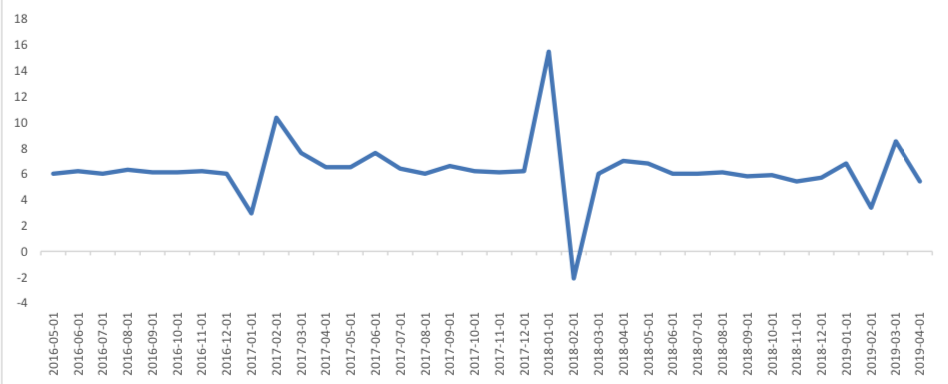
In April, the value added of industries above the designated size increased by 5.4% year on year, and the growth rate fell by 3.1 percentage points compared with the previous month, which was consistent with the decline of PMI.
Graph E: Industrial added value above designated size: Monthly YoY Ratio (%)
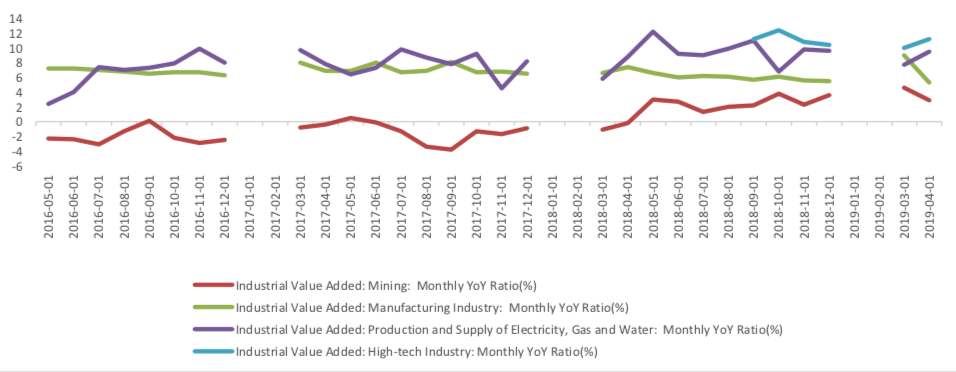
In terms of the 4 categories, the value added of mining industry in April increased by 2.9% year on year, and the growth rate dropped by 1.7 percentage points compared with the previous month; the manufacturing industry increased by 5.3% and fell by 3.7 percentage points, which had a great drag on the growth rate of industrial production in that month; the production and supply of electricity, heat, gas and water increased by 9.5% and accelerated by 1.8 percentage points compared with the previous month. The value added of high-tech industry in April increased by 11.2% year on year, the growth rate increased by 1.2 percentage points compared with the previous month.
Graph F: Industrial added value above designated size: by industry categories
(3) Consumption
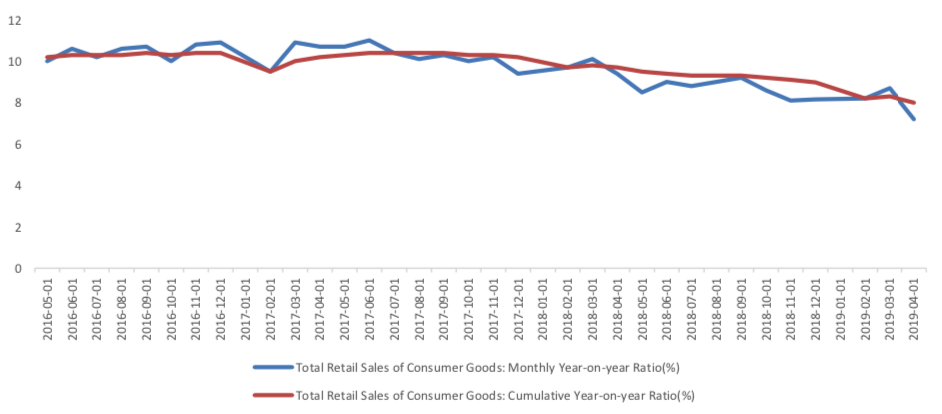
In April, the nominal growth rate of total retail sales of social consumer goods fell to 7.2% from 8.7% last month, while the cumulative growth rate in January-April slowed by 0.3 percentage points to 8.0% compared with the previous value. The main reason for the significant slowdown of the growth rate of was that the May Day holiday moved behind, which led to the consumption demand changed. According to the statistics bureau's calculation, if the number of holidays in April was reduced by two days compared with the same period last month, the growth rate of in April could reach 8.7%.
Graph G:Total Retail Sales of Consumer Goods
Currently no Comments.
Hot Topics
The 13rd China International Future Forum
The Shanghai Derivatives Energy Forum has received extensive attention from relevant industries both within and outside the borders.
Financial institutions deep explore commodity market opportunities, commodity index financial products show full-scale trend
R-Code for analysis: getKDJ
R-Code@June 06, 2016
New indicator to analyze the arbitrage opportunities between sse50 and csi500
Market review: January 11, 2017
The Great China Bubble: Anniversary Lessons and Outlook
Quant Investment in China A-share market
The hedge strategy between SSE50 and A50--Jan 13,2017
The arbitraging strategy between CSI300 and SSE50
Market review: June 17, 2016
Sleepless in London--Enda Homan(Allied Irish Banks Plc)
MSCI Rebuffs Chinese Equities for Third Time in Blow to Xi
Soros, Druckenmiller among hedgies profiting in market plunge