FangQuant › Financial Futures
Market Summary:
Last week, there was generally increase over the market. SSE Composite Index (000001.SH) changed 1.60 % to 2898.70. Specifically, small cap shares perform slightly better than large cap shares and we can observe that CSI500 did better than SSE50 (1.45% vs 1.00%). The trading activity slightly increased as the average daily turnover dropped to 457.83 billion RMB, a rise of 1.42%.
Fund flow via stock connect programs continued to show outflow over the week in sum though a significant inflow on Tuesday by foreign passive funds due to A-shares’ increased weight in MSCI. The cumulative outflows over last week was -0.93 billion RMB. That is, the active managed foreign funds still have pessimistic views.
During the weekend, the government starts a new measure called ‘unreliable entity list’ to mainly act against interruption and blockade in international economic and trade activities via non-commercial reasons. Also, White Paper - China's Position on Sino-US Economic and Trade Consultations, is published on Sunday and shows China’s position that it will never compromise on principles. We think these issues indicate that the trade confliction will not end up easily unless US side give up unrealistic terms on the potential agrrement.
Furthermore, we observed plenty of arbitrage opportunities last week with indices futures. CSI500 current month futures still kept significant discount relative spot and lead to a lot of arbitrage chances. SSE50 and CSI500 next-month/current month price differences were close at limit lines(up and down respectively) and could have some arbitrage opportunities some times.
News:
(1)CFFEX: The revised Regulations on Risk Management of China Financial Futures Exchange and the Regulations on Abnormal Trading Management of China Financial Futures Exchange have been promulgated and put into effect since June 3. The main contents of this revision include: firstly, to increase the trading quota system in the Measures for Risk Management, to further enrich and improve the risk management measures and to prevent market risks; secondly, to upgrade the system level of abnormal transaction management, to upgrade the monitoring guidelines to the Measures for Abnormal Transaction Management, to optimize the types of abnormal transactions, and to clarify the rules for the amalgamation of abnormal transactions in the real-controlled relational account group and strengthen member management responsibility.
Since June 3, the two-way cross-variety positions of CSI300, SSE50 and CSI500 stock index futures will be held in accordance with the transaction margin of the larger one side. The market situation after the implementation of the system will be closely monitored to ensure the smooth and orderly operation of the stock index futures market, while continuing to improve the market mechanism, taking into account risk management and quality and efficiency.
(2)CCTV News: Trump has terminated GSP treatment for developing countries in India, effective on June 5.
(3)Ministry of Commerce: The establishment of the "unreliable entity list" system in China mainly hopes to play three roles. One is to safeguard China's national security; the other is to prevent Chinese entities from encountering such major risks as supply interruption and blockade in international economic and trade activities; and the third is to safeguard the security and stability of the global industrial chain.
When deciding whether to include an entity in the list of unreliable entities, the Chinese government will take into account four factors: whether the entity has acts of blockade, interruption or other discriminatory measures against Chinese entities; whether the entity acts against market rules and contractual spirit for non- commercial purposes; and whether the entity acts against Chinese enterprises or related industries cause substantial damage; fourth, whether the entity's behavior poses a threat or potential threat to national security.
Abuse of market dominance will be punished by the Anti-Monopoly Law. The first batch of lists has been published recently.
The list of unreliable entities is mainly aimed at some enterprises that violate market principles and contract spirit, cut off or blockade Chinese enterprises for non-commercial purposes, which will damage the legitimate rights of Chinese enterprises, and may also endanger China's national security and social public interests. For such entities, it is included in the list of unreliable entities, also in order to protect the stability between enterprises. A definite, fair and sustainable trade order. Therefore, there is no need to over-interpret this point.
(4)Xinhua News Agency: White Paper on China's Position on Sino-US Economic and Trade Consultations: The Chinese Government has always believed that increasing tariffs under the threat of trade wars is not conducive to solving economic and trade problems; China and the United States should uphold the spirit of mutual respect, equality and mutual benefit, solve problems through consultation in good faith, narrow differences, expand common interests and jointly safeguard global economic stability.
China will never compromise on principles; China's position and attitude are consistent and clear; China hopes to solve problems through dialogue rather than tariff measures; China will treat them rationally for the benefit of the Chinese people, the American people and the people of the world, but China will not be afraid of any pressure and will be ready to meet any challenges. Talk, open the door; fight, accompany to the end.
1. StockMarket
(1) Indices Performance
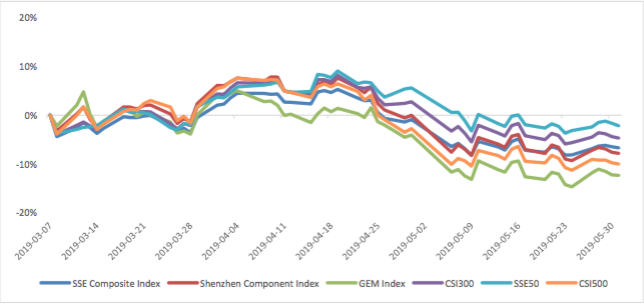
During last week, SSE Composite Index (000001.SH) changed 1.60 % to 2898.70, SHENZHEN COMPONENT INDEX (399001.SZ) changed 1.66 % to 8922.69, ChiNext PRICE INDEX (399006.SZ) changed 2.76 % to 1483.66, CSI 300 INDEX (000300.SH) changed 1.00 % to 3629.79, CSI SmallCap 500 index (000905.SH) changed 1.45 % to 4912.00, SSE 50 Index (000016.SH) changed 1.00 % to 2728.95.
Graph 1: Indices Performance over past 3 months
The average daily turnover of the whole market during past 5 trading days is 457.83 billion CNY, it increased 1.42% compared with the previous 5-trading day period.
Graph 2: Market turnover

In the view of sectors, during last week (from 2019-05-27 to 2019-05-31), 23 of 24 Wind Level- 2 sector(s) increased while 1 sector(s) dropped. Specifically, Semiconductors & Semiconductor Equipment (4.52%), Food, Beverage & Tobacco(4.50%) and Insurance (3.45%) did the best performance while Banks(-0.31%), Food & Staples Retailing (0.04%) and Consumer Durables & Apparel(0.35%) did the worst performance.
Graph 3: Sectors performance under Wind Level-2 classification (%)

(3) Indices Valuation (TTM)
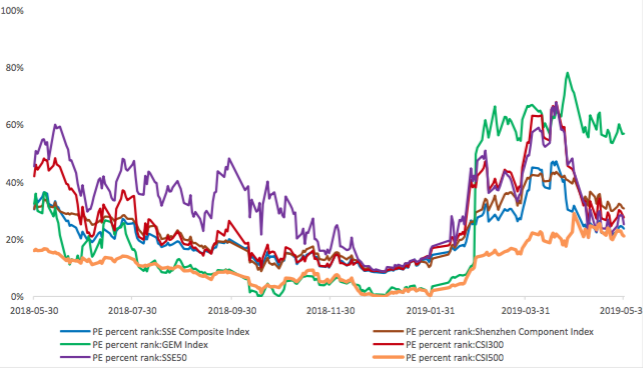
The current PE for SSE Composite Index, Shenzhen Component Index, GEM Index, CSI300, SSE50, CSI500 are 12.9298, 23.4160, 53.2192, 11.7525, 9.4145, 26.3743respectively; and these indices are at 23.70%, 30.70%, 56.80%, 27.60%, 25.20%, 21.10% percent rank level of their historic data, respectively
Graph 4: PE of 6 indices

Graph 5: PE percent rank of 6 indices (calculated by data of past 1200 trading days, only 1Y data is presented on the graph)
The current PB for SSE Composite Index, Shenzhen Component Index, GEM Index, CSI300, SSE50, CSI500 are 1.5185,2.6827,4.7397,1.5190,1.2443, 2.0682respectively, and these indices are at 32.10%, 30.10%, 38.60%, 52.20%, 55.70%, 15.30% percent rank level of their historic data, respectively.
Graph 6: PB of 6 indices

Graph 7: PB percent rank of 6 indices (calculated by data of past 1200 trading days, only 1Y data is presented on the graph)

(4) Foreign Fund Flow
Last week, there were 5 trading days for northward channel open for stock connect programs. During last week the total foreign fund flow via Stock Connect is -0.93 billion RMB, and the cumulative inflows was 695.50 billion RMB. Specifically, the fund flow via Shanghai-Hong Kong Stock Connect is 0.34 billion RMB and the fund flow via Shenzhen-Hong Kong Stock Connect is -1.26 billion RMB.
Graph 8: Fund flow via both Shanghai and Shenzhen-Hong Kong Stock Connect in past 1M (100 million CNY)

Graph 9: Fund flow via Shenzhen-Hong Kong Stock Connect in past 1M (100 million CNY)

Graph 10: Fund flow via both Shanghai-Hong Kong Stock Connect in past 1M (100 million CNY)

2. Index Futures
(1) Trading Volume and Open Interests
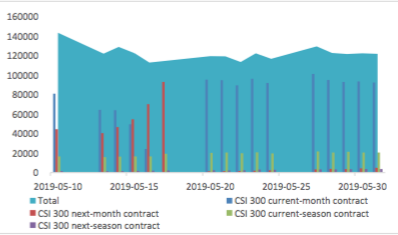
During past 5 trading days the average trading volume for CSI300(IF), SSE50(IH), CSI500(IC) contracts
are 129272 (2.39%, the previous 5-trading day period),50276 (1.53%),91610 (-0.81%) lots, respectively. On the last trading day, the total open interests for them are 121827 (4.33%),55943 (-0.57%),117594 (1.77%) lots respectively.
Graph 11: CSI300 Index futures’ trading volume

Graph 12: CSI300 Index futures’ open interests
Graph 13:SSE50 Index futures’ trading volume

Graph 14: SSE50 Index futures’ open interests

Graph 15: CSI500 Index futures’ trading volume

Graph 16: CSI500 Index futures’ open interests

(2) Roll Level Bid-Ask Distribution
There are 5 trading days during last week, so the distribution is worked out with 36005 data points for each contract pair.
Graph 17: CSI300 Current/Next Month Contract Roll Spread Distribution (2s frequency)

Graph 18: SSE50 Current/Next Month Contract Roll Spread Distribution (2s frequency)

Graph 19: CSI500 Current/Next Month Contract Roll Spread Distribution (2s frequency)

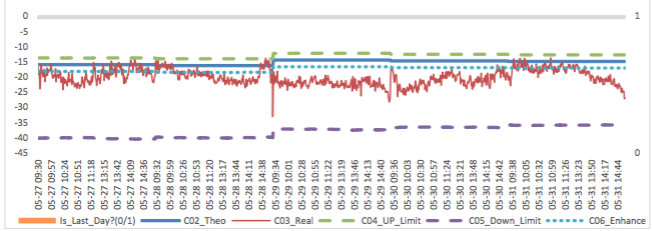
Assumption: risk-free rate: 3%; security borrowing cost: 8%; trading expense for spot: 0.025%; trading expense for futures: 0.005%; margin rates for futures contracts: 0.11 for CSI300 and SSE50, 0.13 for CSI500; margin rate for security borrowing: 0.3 (or 130% maintain rate).
When real price spread is out of theoretical range (calculated by our assumption), there exists absolute future-spot arbitrage opportunity.
Graph 20: Future (Current Month)-Spot Arbitrage Opportunity for CSI300 contract (in the view of price difference)

Graph 21: Future (Current Month)-Spot Arbitrage Opportunity for SSE50 contract (in the view of price difference)
Graph 22: Future (Current Month)-Spot Arbitrage Opportunity for CSI500 contract (in the view of price difference)
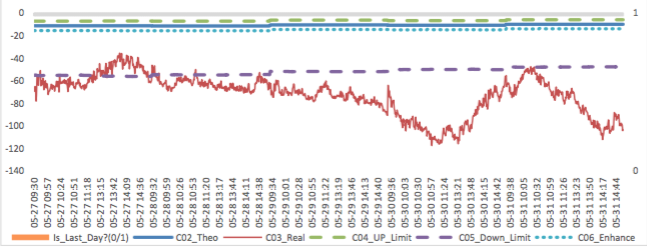
Graph 23: Future (Next Month-Current Month) Arbitrage Opportunity for CSI300 contract (in the view of price difference)

Graph 24: Future (Next Month-Current Month) Arbitrage Opportunity for SSE50 contract (in the view of price difference)

Graph 25: Future (Next Month-Current Month) Arbitrage Opportunity for CSI500 contract (in the view of price
difference)

3. Financial Markets
(1) Interest Rates
The term structure of treasury bonds’ yields is currently upward sloping in concave shape.
Specifically, last week, short-term yields short term yield of Treasury bond experienced some increase and 3M yield now at 2.4%-2.6% level. Furthermore, as for long-term yield, there is a small fluctuation. 10Y yield is about 3.2%-3.4%.
Graph 22: Term Structure Evolvement of Treasury Bonds Yields During Recent 3 Months (%)

As for Shibor rates, short-term rates experienced significant fluctuation. Specifically, O/N rate experienced obvious fluctuation to 2.0%-2.2% level.
Graph 23: Term Structure Evolvement of Shibor Rates During Recent 3 Months (%)

(2) ExchangeRates
During last week, CNY/USD changed -0.04% to 6.9020 and offshore rate, CNH/USD, changed 0.28% to 6.9369 and USD index changed 0.18%.
Graph 24: USD/CNY, USD/CNH and USD Index

Macroeconomic Topic
On 2019/05/31, the May PMI data was released. The data showed a continuous drop in the PMI in May after a pullback in April. The manufacturing PMI was 49.4 percent, with pre-value of 50.1 percent. The non- manufacturing PMI was at 54.3 percent, with pre-value of 54.3 percent, while the composite PMI was at 53.3 percent, with pre-value of 53.4 percent.
May PMI Data
Graph A: PMI Data

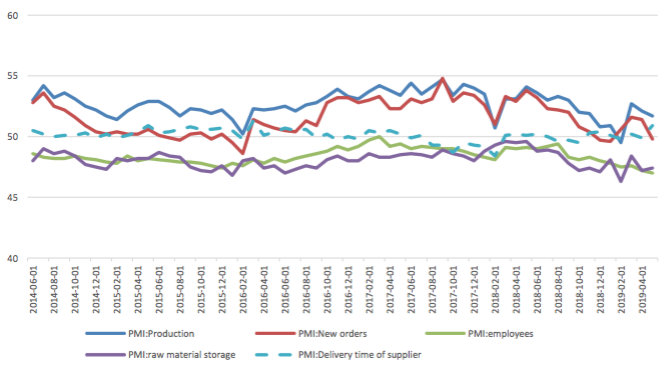
(1) About 5 Sub-indexes for manufacturing PMI calculation
From the point of view of 5 sub-indexes: (1) the decline of PMI: New orders is the main reason for the decline of manufacturing PMI. It was reported at 49.8%, dropped to contraction zone, with preceding value of 51.4% and it drags PMI for 0.48 percentage points. (2) The decline of PMI: Delivery time of supplier is another important reason for the decline of manufacturing PMI. It was reported at 50.9%, moved in contraction zone, with preceding value of 49.9% and it drags PMI for 0.15 percentage points. (3) The decline of PMI: Production is another important reason for the decline of manufacturing PMI. It was reported at 51.7%, still in expansion zone, with preceding value of 52.7% and it drags PMI for 0.1 percentage points. (4) The decline of PMI: Employees, is a relatively minor reason for the decline of manufacturing PMI. It was reported at 47%, still in contraction zone, with preceding value of 47.2% and it dragged PMI for 0.04 percentage points. It hit a new low since February 2009. (5) The improvement of PMI: Raw material storage, gave a small positive force for manufacturing PMI. It was reported at 47.4%, still in contraction zone, with preceding value of 47.2% and it boosted PMI for 0.02 percentage points.
Graph B: PMI 5 sub-indexes
Graph C: PMI Change Contribution by 5 Sub-indexes

(2) About 8 Sub-indexes not for manufacturing PMI calculation
3 of 8 sub-indexes are above 50, in expansion zone and the remaining indexes are in contraction zone. Several points need to mention: PMI of manufactured goods inventory rose from 46.5% to 48.1%, a new high this year, close to the level at the end of last year, while the difference between new orders PMI and manufactured goods inventory PMI dropped sharply to 1.7% from 4.9% of the previous value. It shows that the downstream demand is insufficient, and enterprises passively add inventory. The downstream demand decline may have affected the upstream investment. Data show that the PMI of raw material inventory has risen from 47.2% to 47.4%, the PMI of purchasing volume has dropped from 51.1% to 50.5%, and the purchase price of raw materials has dropped from 53.1% to 51.8%.
Graph D: PMI for 8 Sub-indexes not for manufacturing PMI calculation

(3) PMI by enterprises size
From the perspective of PMI of large and medium-sized enterprises, large enterprises have a decline but still in the expansion area, while small and medium-sized enterprises are still in the contraction area. The PMI of small enterprises dropped the most, from 49.8% to 47.8%.

(4) Summary
In May, the decline of PMI in China was largely affected by the decline of the world economy and the deterioration of the international trade environment. From the perspective of the major economies, the PMI in the European Union showed a full pullback, in which the PMI index in the EU was weaker than that in China. The PMI data in May show that the downward pressure of the economy is further increased by the external environment, and the counter-cyclical adjustment is expected to be further strengthened.
Currently no Comments.
Hot Topics
The 13rd China International Future Forum
The Shanghai Derivatives Energy Forum has received extensive attention from relevant industries both within and outside the borders.
Financial institutions deep explore commodity market opportunities, commodity index financial products show full-scale trend
R-Code for analysis: getKDJ
R-Code@June 06, 2016
New indicator to analyze the arbitrage opportunities between sse50 and csi500
Market review: January 11, 2017
The Great China Bubble: Anniversary Lessons and Outlook
Quant Investment in China A-share market
The hedge strategy between SSE50 and A50--Jan 13,2017
The arbitraging strategy between CSI300 and SSE50
Market review: June 17, 2016
Sleepless in London--Enda Homan(Allied Irish Banks Plc)
MSCI Rebuffs Chinese Equities for Third Time in Blow to Xi
Soros, Druckenmiller among hedgies profiting in market plunge