FangQuant › Financial Futures
Market Summary:
Last week, there was generally increase over the market. SSE Composite Index (000001.SH) changed 1.92 % to 2881.97. Specifically, large cap shares perform slightly better than small cap shares and we can observe that SSE50 did better than CSI500 (2.91% vs 2.5%). The trading activity boosted as the average daily turnover rose to 468.85 billion RMB, an increase of 9.88%.
Last week, funds via stock connect kept show inflow. The overall inflow during last week was 15.66 billion. This indicates that the current market may price in the impact of the trade confliction and foreign funds turned the pessimistic view back.
Some May economy data was released and most of them showed small fluctuation. The overall situation is stable. Specifically, for price data, due to significant rise in food price, CPI rose 2.7%, which leads some inflation pressure. However, food price was caused by decreased supply in pork and fruit, which should not be long-term pressure. There is no long term inflation pressure and still room for the central bank to use policy tools. Monetary policy instruments, including interest rates and deposit reserves, will continue to be used for counter-cyclical adjustment.
Furthermore, we observed plenty of arbitrage opportunities last week with indices futures. CSI500 current month futures still kept significant discount relative spot and lead to a lot of arbitrage chances. SSE50 and CSI300 current month futures some time show high premium relative spot and lead to some arbitrage chances. CSI500 next-month/current month price differences were below down limit line and could have plenty of arbitrage opportunities.
News:
(1) China Fund Daily: The average stock position of private equity funds dropped to 62.57% in May, 10.65 percentage points lower than that of the previous month, which is also the two consecutive months of reduction of private equity positions. At the same time, the performance of private equity products has also been reversed, with the average return contracting to about 15% in the year. However, private equity is not pessimistic about the market. It believes that the current A-share market is more resilient and can tap deterministic opportunities on the basis of controlling positions.
(2) Wind: Shenzhen Stock Exchange said that according to the results of the annual report audit in 2018, the quality of information disclosure of listed companies has generally improved compared with previous years, such as business discussion and analysis, industry information, social responsibility information and other readability and usefulness have been further enhanced. Shenzhen Stock Exchange has focused on six major issues in the review of its annual report in 2018: first, the authenticity of listed companies' performance; second, illegal and irregular acts such as capital occupation and irregular guarantees; third, corporate governance; fourth, merger and acquisition integration and performance commitments; fifth, information disclosure; and sixth, the quality of practice of intermediaries.
(3) First Finance and Economics: The unveiling ceremony of Shanghai-London Stock Connect will be held around 8:00 London time on Monday, that is, around 15:00 Beijing time on the same day, and the listing ceremony of Huatai Securities will be held on the London Stock Exchange.
(4) Statistical Bureau: In May, driven by many factors, such as May Day holiday increase, holiday movement and the rebound of the growth rate of some key commodities, the total retail sales of social consumer goods both increased in nominal and real terms, compared with the previous month, and the consumer goods market generally showed a steady upward trend.
(5)Wind:The Shanghai Local Financial Regulatory Bureau announced that the first group of loss-of- association P2P online lending institutions totaled 99. The announcement aims to further promote the risk management of Shanghai's P2P online loans and resolve the stock risk in accordance with the relevant requirements of the state on the special regulation of Internet financial risks and the risk of P2P online loans.
(6) Wind: At the Eleventh Lujiazui Forum, senior officials of the Banking Insurance Regulatory Commission and the Securities Regulatory Commission pointed out the risks in the current real estate market and real estate finance. Many real estate industry insiders believe that the speech released the signal that real estate regulation is still not relaxing and financing may be tightened. Industry insiders analysis, triggered by strict supervision warning industry phenomenon, is likely to come from the recent changes in the land market, as well as the credit and financing support behind.
1. StockMarket
(1) Indices Performance
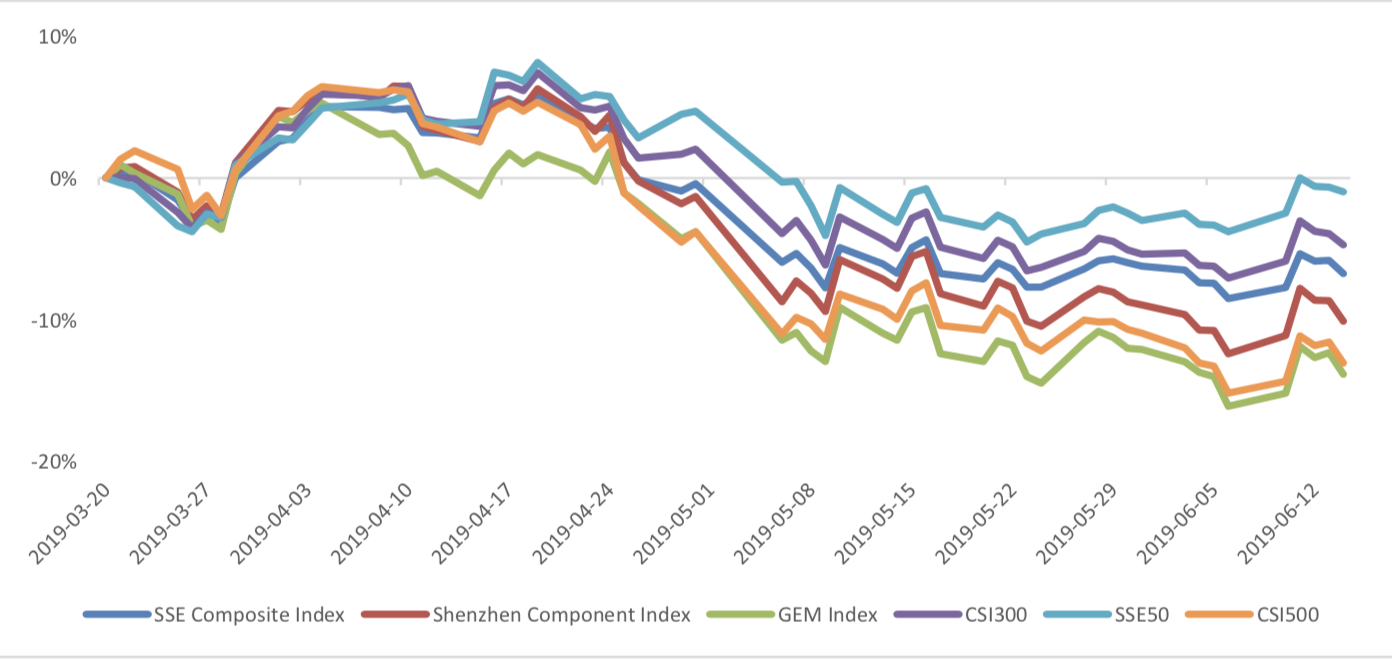
During last week, SSE Composite Index (000001.SH) changed 1.92 % to 2881.97, SHENZHEN COMPONENT INDEX (399001.SZ) changed 2.62 % to 8810.13, ChiNext PRICE INDEX (399006.SZ) changed 2.68 % to 1453.96, CSI 300 INDEX (000300.SH) changed 2.53 % to 3654.88, CSI SmallCap 500 index (000905.SH) changed 2.50 % to 4795.53, SSE 50 Index (000016.SH) changed 2.91 % to 2785.61.
Graph 1: Indices Performance over past 3 months
The average daily turnover of the whole market during past 5 trading days is 468.85 billion CNY, it increased 9.88% compared with the previous 5-trading day period.
Graph 2: Market turnover

(2) Sectors Performance
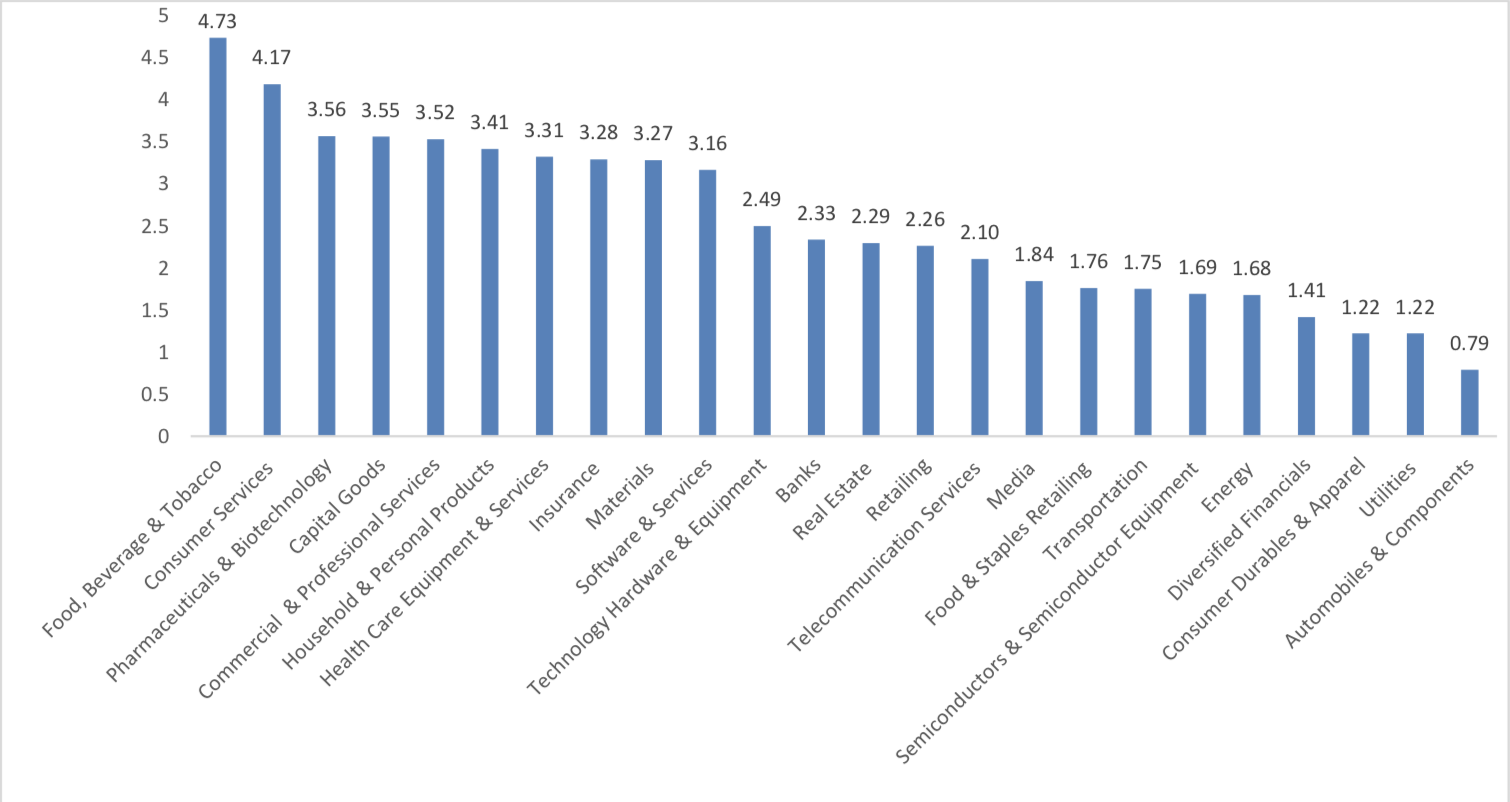
In the view of sectors, during last week (from 2019-06-07 to 2019-06-14), 24 of 24 Wind Level- 2 sector(s) increased while 0 sector(s) dropped. Specifically, Food, Beverage & Tobacco(4.73%), Consumer Services (4.17%) and Pharmaceuticals & Biotechnology(3.56%) did the best performance while Automobiles & Components(0.79%), Utilities (1.22%) and Consumer Durables & Apparel(1.22%) did the worst performance.
Graph 3: Sectors performance under Wind Level-2 classification (%)
(3) Indices Valuation (TTM)
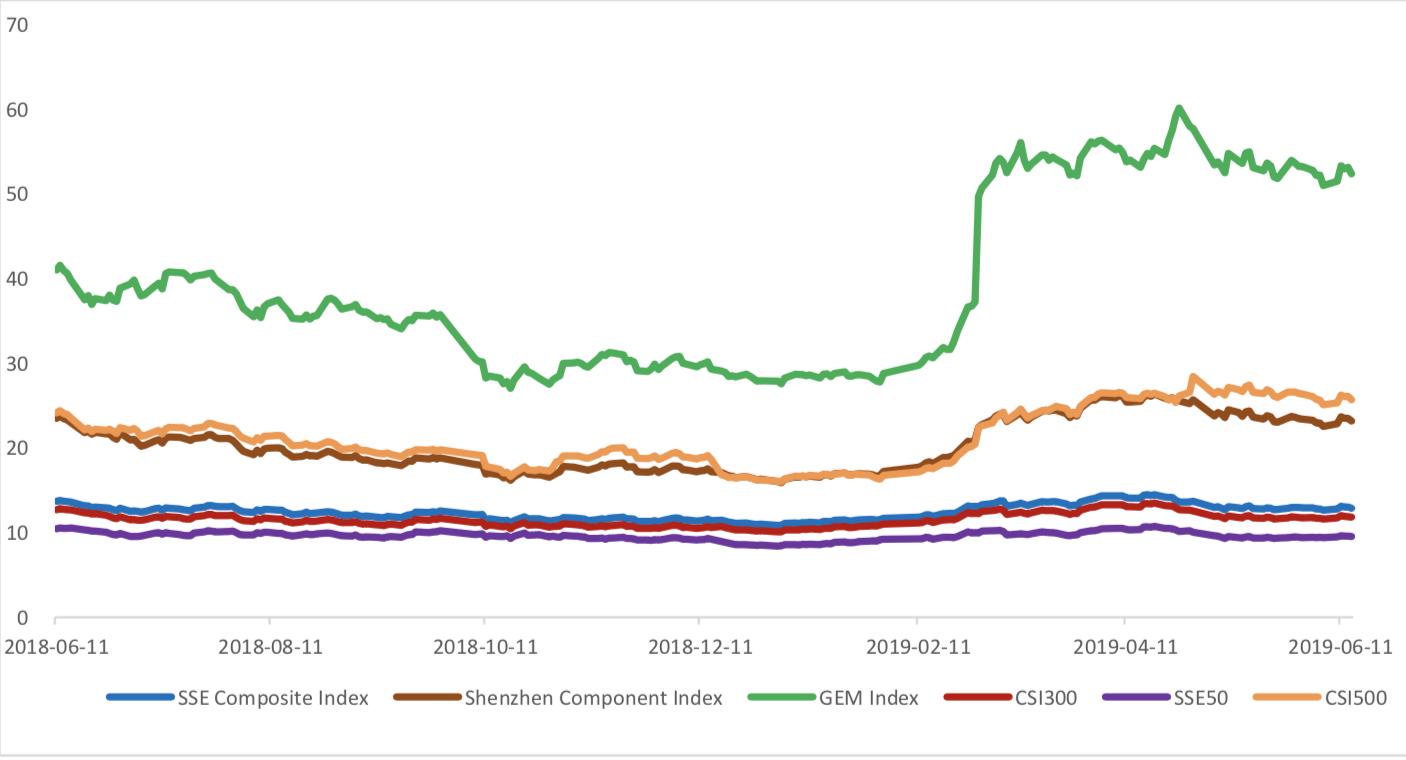
The current PE for SSE Composite Index, Shenzhen Component Index, GEM Index, CSI300, SSE50, CSI500 are 12.8969, 23.1485, 52.3556, 11.8111, 9.5417, 25.6853respectively; and these indices are at 22.90%, 29.60%, 55.40%, 29.00%, 29.70%, 18.50% percent rank level of their historic data, respectively
Graph 4: PE of 6 indices
Graph 5: PE percent rank of 6 indices (calculated by data of past 1200 trading days, only 1Y data is presented on the graph)

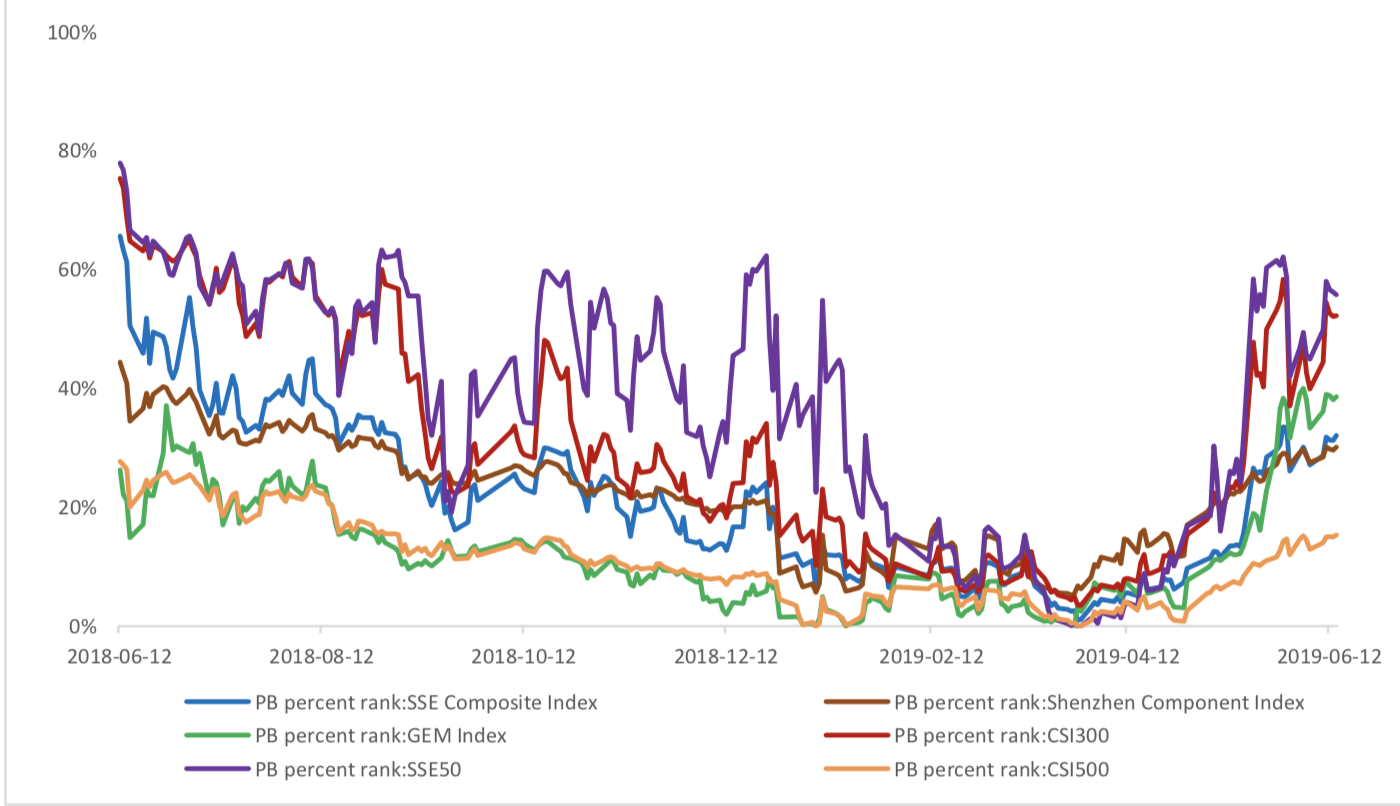
The current PB for SSE Composite Index, Shenzhen Component Index, GEM Index, CSI300, SSE50, CSI500 are 1.5185,2.6827,4.7397,1.5190,1.2443, 2.0682respectively, and these indices are at 32.10%, 30.10%, 38.60%, 52.20%, 55.70%, 15.30% percent rank level of their historic data, respectively.
Graph 6: PB of 6 indices

Graph 7: PB percent rank of 6 indices (calculated by data of past 1200 trading days, only 1Y data is presented on the graph)
(4) Foreign Fund Flow
Last week, there were 5 trading days for northward channel open for stock connect programs. During last week the total foreign fund flow via Stock Connect is 15.66 billion RMB, and the cumulative inflows was 720.77 billion RMB. Specifically, the fund flow via Shanghai-Hong Kong Stock Connect is 11.40 billion RMB and the fund flow via Shenzhen-Hong Kong Stock Connect is 4.27 billion RMB.
Graph 8: Fund flow via both Shanghai and Shenzhen-Hong Kong Stock Connect in past 1M (100 million CNY)

Graph 9: Fund flow via Shenzhen-Hong Kong Stock Connect in past 1M (100 million CNY)

Graph 10: Fund flow via both Shanghai-Hong Kong Stock Connect in past 1M (100 million CNY)

2. Index Futures
(1) Trading Volume and Open Interests
During past 5 trading days the average trading volume for CSI300(IF), SSE50(IH), CSI500(IC) contracts
are 117607 (-3.68%, the previous 5-trading day period),43951 (-3.89%),101326 (9.67%) lots, respectively. On the last trading day, the total open interests for them are 118734 (-2.94%),55260 (-6.15%),127617 (- 0.08%) lots respectively.
Graph 11: CSI300 Index futures’ trading volume

Graph 12: CSI300 Index futures’ open interests

Graph 13:SSE50 Index futures’ trading volume
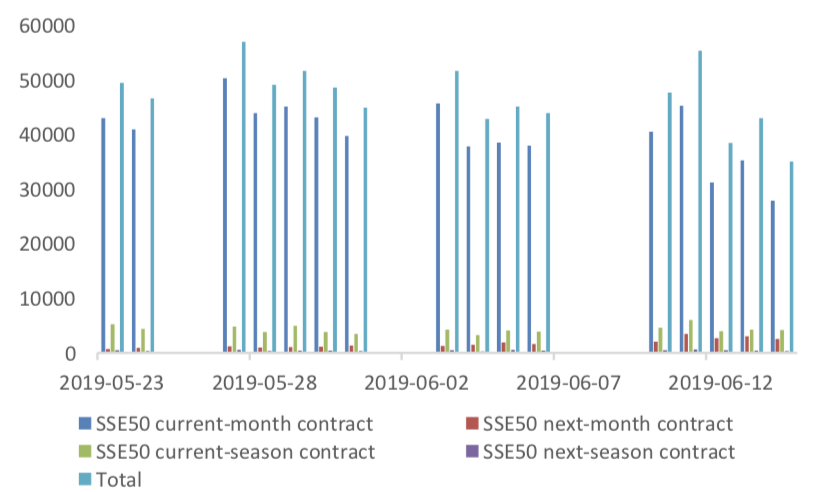
Graph 14: SSE50 Index futures’ open interests

Graph 15: CSI500 Index futures’ trading volume

Graph 16: CSI500 Index futures’ open interests

(2) Roll Level Bid-Ask Distribution
There are 5 trading days during last week, so the distribution is worked out with 36005 data points for each contract pair.
Graph 17: CSI300 Current/Next Month Contract Roll Spread Distribution (2s frequency)
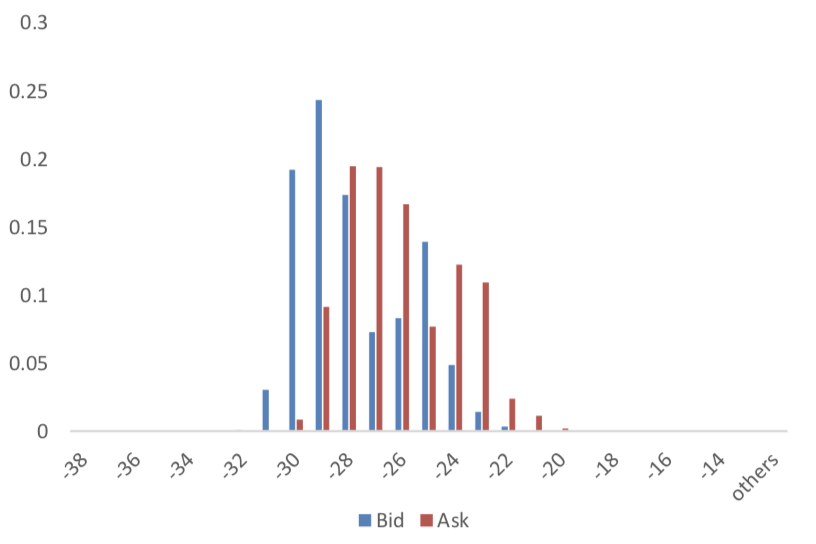
Graph 18: SSE50 Current/Next Month Contract Roll Spread Distribution (2s frequency)

Graph 19: CSI500 Current/Next Month Contract Roll Spread Distribution (2s frequency)

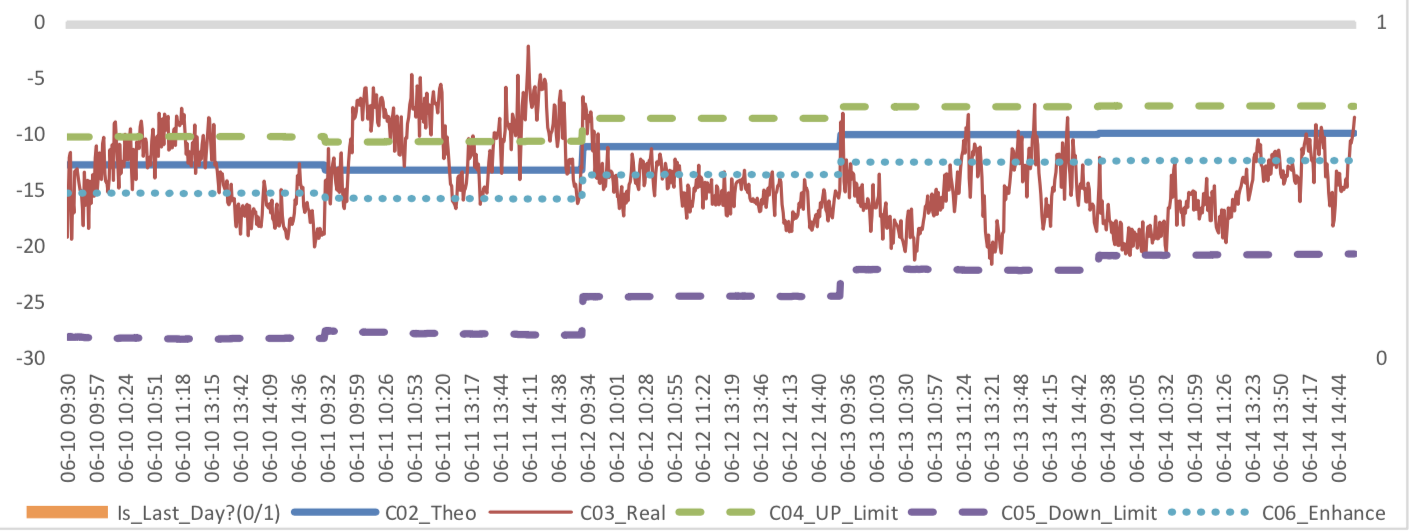
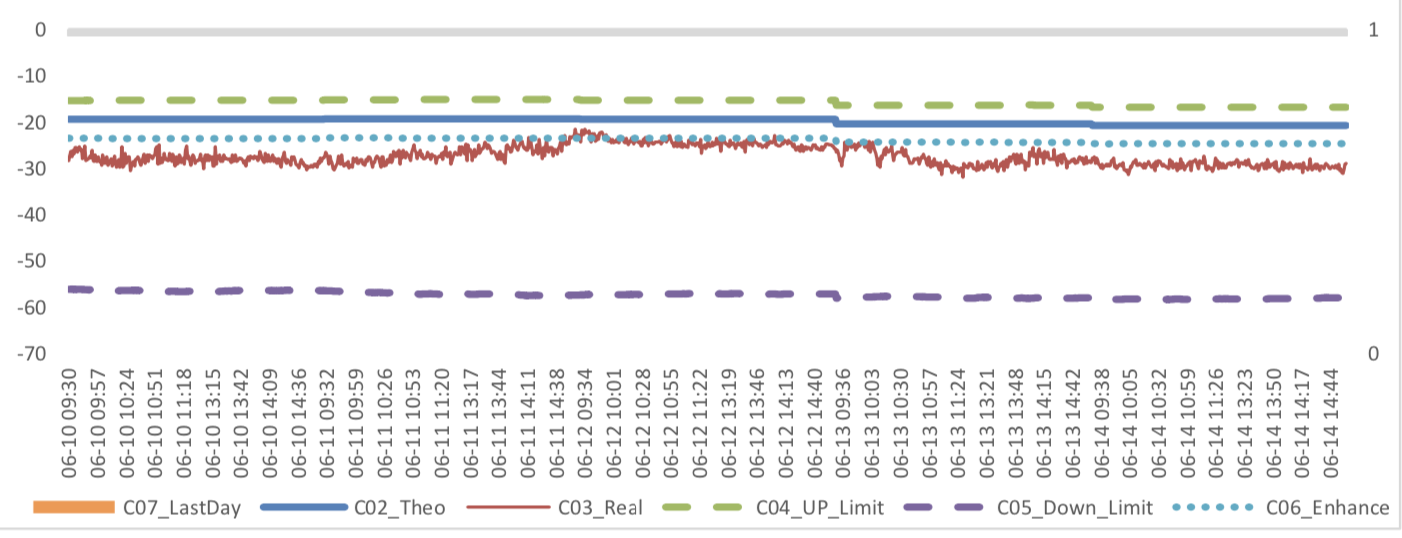
Assumption: risk-free rate: 3%; security borrowing cost: 8%; trading expense for spot: 0.025%; trading expense for futures: 0.005%; margin rates for futures contracts: 0.11 for CSI300 and SSE50, 0.13 for CSI500; margin rate for security borrowing: 0.3 (or 130% maintain rate).
When real price spread is out of theoretical range (calculated by our assumption), there exists absolute future-spot arbitrage opportunity.
Graph 20: Future (Current Month)-Spot Arbitrage Opportunity for CSI300 contract (in the view of price difference)
Graph 21: Future (Current Month)-Spot Arbitrage Opportunity for SSE50 contract (in the view of price difference)

Graph 22: Future (Current Month)-Spot Arbitrage Opportunity for CSI500 contract (in the view of price difference)

Graph 23: Future (Next Month-Current Month) Arbitrage Opportunity for CSI300 contract (in the view of price difference)
Graph 24: Future (Next Month-Current Month) Arbitrage Opportunity for SSE50 contract (in the view of price difference)

Graph 25: Future (Next Month-Current Month) Arbitrage Opportunity for CSI500 contract (in the view of price
difference)

3. Financial Markets
(1) Interest Rates
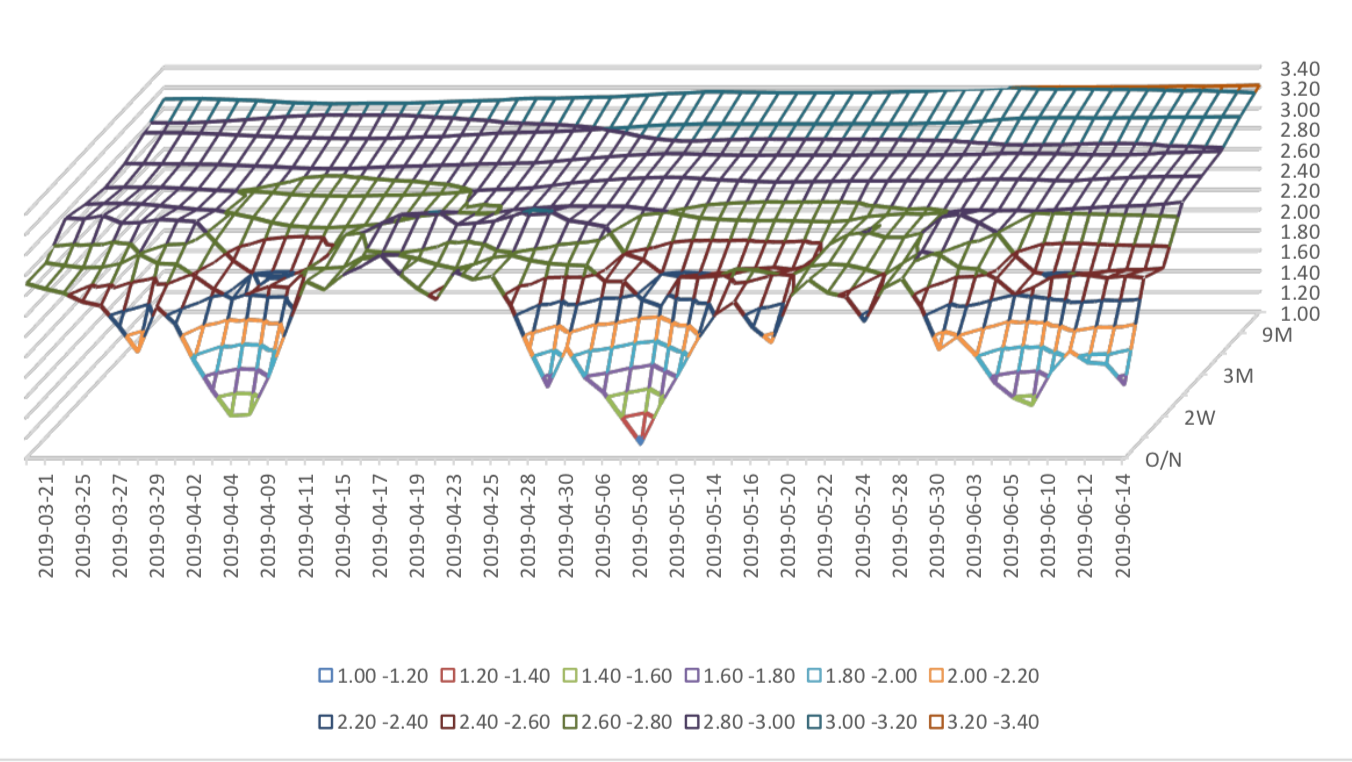
The term structure of treasury bonds’ yields is currently upward sloping in concave shape.
Specifically, last week, short-term yields short term yield of Treasury bond experienced some fluctuation and 3M yield now at 2.2%-2.4% level. Furthermore, as for long-term yield, there is a small fluctuation. 10Y yield is about 3.2%-3.4%.
Graph 26: Term Structure Evolvement of Treasury Bonds Yields During Recent 3 Months (%)

As for Shibor rates, short-term rates experienced significant fluctuation. Specifically, O/N rate experienced obvious fluctuation to 1.6%-1.8% level.
Graph 27: Term Structure Evolvement of Shibor Rates During Recent 3 Months (%)
(2) ExchangeRates
During last week, CNY/USD changed 0.11% to 6.9236 and offshore rate, CNH/USD, changed 0.03% to 6.9300 and USD index changed 0.55%.
Graph 28: USD/CNY, USD/CNH and USD Index

Macroeconomic Topic 1:
The central bank released financial and monetary data this week and most of which below market expectations. In May, social financing increased by 1.4 trillion yuan, 40.83 billion yuan more than in April, and 448.20 billion yuan more than in the same period last year. After the sharp contraction of social finance data in April, influenced by last year's low base, the social finance data in May is relatively stable, but there are some significant changes and trends in the structure.
May Finance Data
(1) Social Financing DataGraph A: Total Social Financing Data(100m RMB)

In on-balance-sheet financing, new RMB loans increased by 1185 billion yuan, 316.7 billion yuan more than in April, and 50 billion yuan more than in the same period last year. This month, new RMB loans accounted for 85% of the new social financing scale.
Graph B: On-balance-sheet Financing Data(100m RMB)

From the perspective of new off-balance sheet financing, in May, it shrank in all respects, but decreased from the same period last year. New off-balance-sheet financing in May was -145.3 billion yuan, new trust loans turned negative again after a net increase of 2 consecutive months. Although new entrusted loans continued to shrink, but the shrinkage rate narrowed. However, new non-discounted bank acceptance notes fell sharply, to 77 billion yuan, with a pre-value of -35.7 billion yuan.
Graph C: Off-balance-sheet Financing Data(100m RMB)

In terms of the direct financing, affected by the downturn of the market and the risk of bond payment, the ring ratio of bond financing shrank to 47.6 billion yuan, while stock financing showed a stable performance, reaching 25.9 billion yuan, with a previous value of 26.2 billion yuan.
Graph D: Direct Financing Data(100m RMB)

(2) Monetary Data
In May, M2 grew at the same rate as last month, at 8.5%, but M1 rebounded at 3.4% , with pre-valuve 2.9%. The M1-M2 shrank from - 5.6% to - 5.1%.
Graph E: M1 and M2 data

The negative factors of M2 are as follows: the deposits of new non-financial institutions increased less by 173.5 billion yuan and the fiscal deposits increased more by 98.7 billion yuan.
The positive factors of M2 are as follows: the deposits of non-financial enterprises increased by 104.2 billion yuan, the deposits of residents increased by 25.1 billion yuan.
(3) Summary
The may finance data was stable. With the global trend of cutting interest rate and the need for more counter-cycle measures to handle the downward economic pressure, there is still room for monetary polices.
CPI rebounded year-on-year and reached a new high since February 2018. However, core CPI continued to fall to 1.6%. Driven by food prices, Food CPI rose 7.7% year-on-year, a 12-year high, while non-food CPI rose only 1.6%, down from 1.7% in April. The biggest increases were in fresh fruits, eggs, pork and vegetables.
Graph B: year-on-year CPI: by Food, Non-Food, Core, Services, Consumer Goods (%)

Macroeconomic Topic 2:
The Bureau of Statistics released May price data, which showed that CPI was 2.7% year-on-year with pre-value of 2.5%. However, the core CPI continued to fall, 1.6% year-on-year with pre-value of 1.7% year- on-year. The CPI ring ratio was 0% with pre-value of 0.1%, and the PPI was 0.6% year-on-year with pre- value of 0.9% year-on-year. PPI ring ratio was 0.2% with pre-value of 0.3%.
May Price Data
(3) CPI Data
Graph A: CPI Data
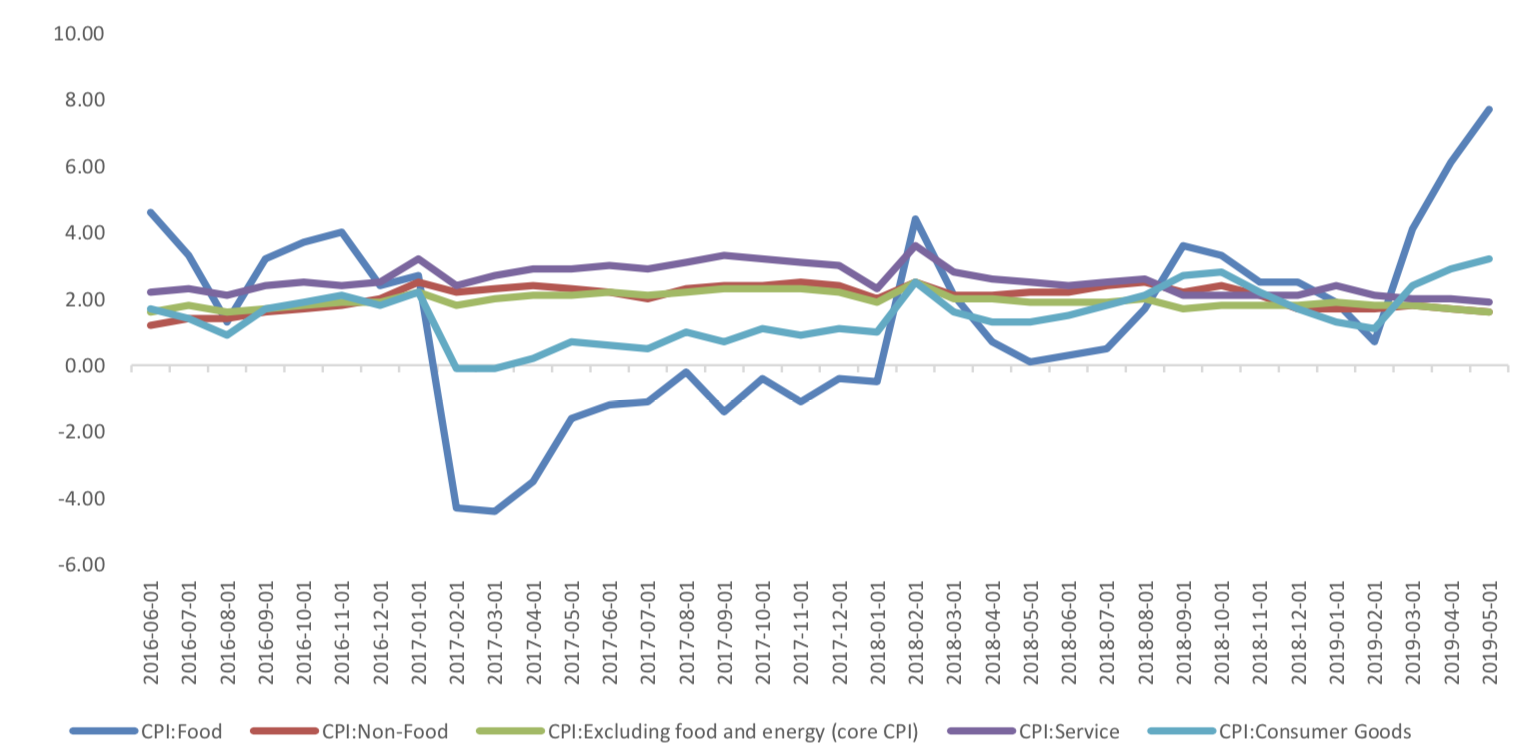
CPI rebounded year-on-year and reached a new high since February 2018. However, core CPI continued to fall to 1.6%. Driven by food prices, Food CPI rose 7.7% year-on-year, a 12-year high, while non-food CPI rose only 1.6%, down from 1.7% in April. The biggest increases were in fresh fruits, eggs, pork and vegetables.
Graph B: year-on-year CPI: by Food, Non-Food, Core, Services, Consumer Goods (%)

In other consumer goods, the CPI of transportation fuel, which is closely related to oil prices, fell to - 1.4% from 0.2% last month, while the CPI of transportation and communication decreased from -0.5 to - 0.9%, mainly because of the obvious decline of CPI of communication tools and services in the trend of reducing fees.
In terms of services, the service CPI dropped from 2% to 1.9%. Among them, the CPI of health care dropped slightly from 2.6% to 2.5%, but that of education, culture and entertainment rose from 2.5% to 2.6%. The decline of health care CPI was mainly affected by the high base last year.
Graph C: year-on-year CPI: by Food Alcohol and Tobacco, Clothing, Residence, Household Goods & Services, Transportation & Communications, Education, Culture & Entertainment, Healthcare (%)

(4) PPI Data
PPI rose 0.6% year-on-year in May, with pre-value of 0.9%. Graph D: PPI Data (%)
PPI of means of production increased by 0.9% year-on-year, unchanged from last month. The main reason is the negative growth of raw material PPI, but the mining industry PPI still increased by 6.1%, higher than the previous value of 5.6%. PPI of means of production declined from 0.9% to 0.6% year on year. From the ring ratio data, driven by the double decline of means of livelihood and means of production, there has been a decline.
Graph E: PPI Data, by means of production and means of livelihoods

(3) Summary
This time CPI is mainly drive by food price which is mainly by decrease production of fruit and illness of pig. These should not be everlasting issues. That is, inflation pressure should be only temporally and price should be still controllable.
In recent statements by central bank officials, monetary policy instruments, including interest rates and deposit reserves, will continue to be used for counter-cyclical adjustment. Under the background of controllable total price level, there is room for the central bank to use policy tools.
Currently no Comments.
Hot Topics
The 13rd China International Future Forum
The Shanghai Derivatives Energy Forum has received extensive attention from relevant industries both within and outside the borders.
Financial institutions deep explore commodity market opportunities, commodity index financial products show full-scale trend
R-Code for analysis: getKDJ
R-Code@June 06, 2016
New indicator to analyze the arbitrage opportunities between sse50 and csi500
Market review: January 11, 2017
The Great China Bubble: Anniversary Lessons and Outlook
Quant Investment in China A-share market
The hedge strategy between SSE50 and A50--Jan 13,2017
The arbitraging strategy between CSI300 and SSE50
Market review: June 17, 2016
Sleepless in London--Enda Homan(Allied Irish Banks Plc)
MSCI Rebuffs Chinese Equities for Third Time in Blow to Xi
Soros, Druckenmiller among hedgies profiting in market plunge