FangQuant › Financial Futures
Market Summary:
Last week, there was generally decrease over the market. SSE Composite Index (000001.SH) changed -0.77 % to 2978.88. Specifically, large cap shares perform slightly better than small cap shares and we can observe that SSE50 did better than CSI500 (-0.28% vs -1.41%). The trading activity decreased as the average daily turnover dropped to 458.27 billion RMB, a decrease of 3.57%.
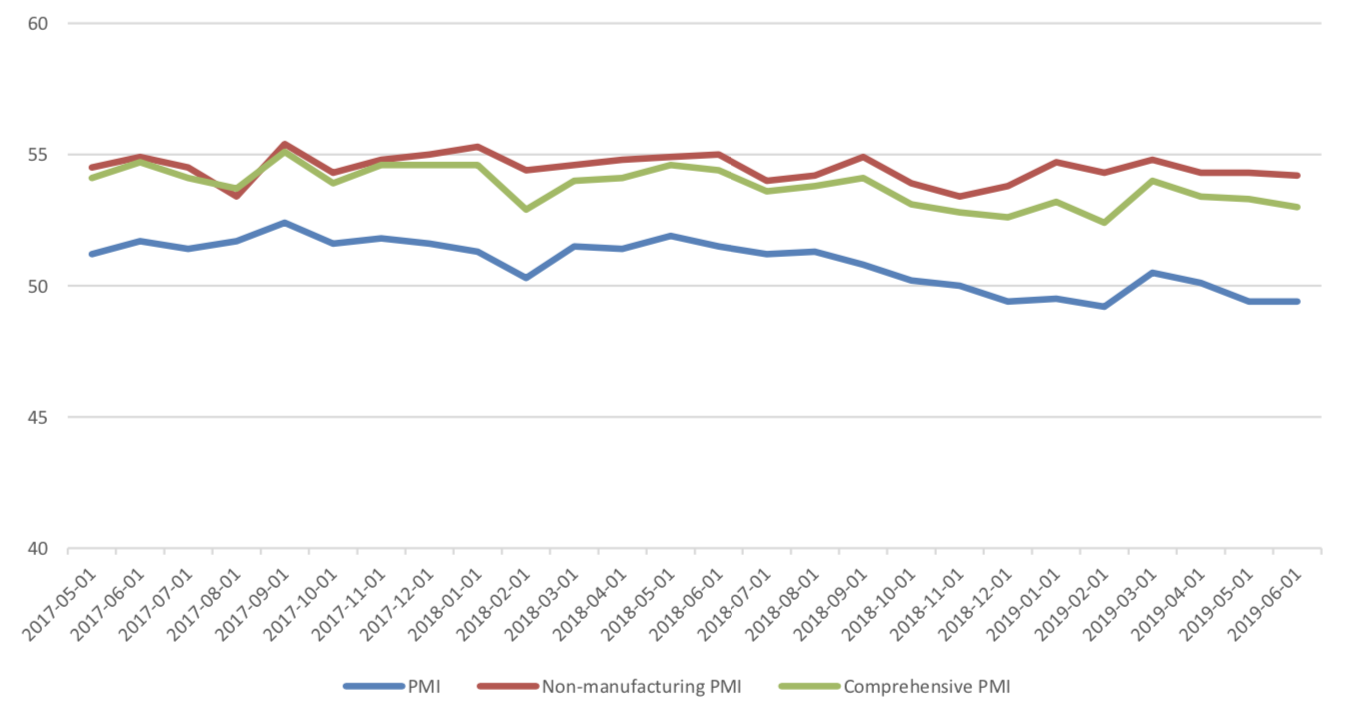
In June, the PMI of China's manufacturing sector was 49.4, which was the same as last month, while that of non-manufacturing sector was 54.2, with a pre-value of 54.3. The prosperity level of manufacturing industry was similar to that of last month. The output index of comprehensive PMI dropped 0.3 percentage points compared with last month, indicating that the production and operation activities of enterprises in China maintained expansion, but the pace slowed down.
The heads of state of China and the United States agreed to resume economic and trade negotiations between the two countries, and the United States indicated that it would no longer impose new tariffs on Chinese exports. At least, there is some alleviation for the confliction, which should boost the confidence of the prospect. However, noted that the ongoing tariff is not removed, it is not the final peace, negotiation is still needed. Thus, uncertainty still exists.
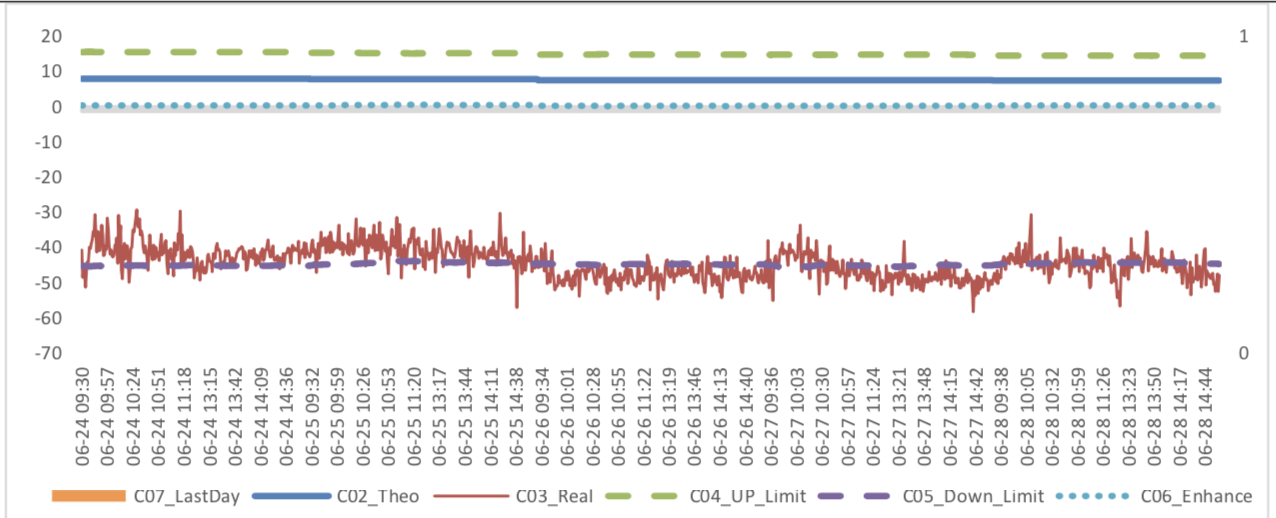
Furthermore, we observed plenty of arbitrage opportunities last week with indices futures. CSI500 current month futures showed significant discount relative spot and lead to a lot of arbitrage chances. SSE50 and CSI300 current month futures some time show high premium relative spot and lead to some arbitrage chances. CSI500 next-month/current month price differences were below down limit line and could have plenty of arbitrage opportunities.
News:
(1) China Securities Network: In the first half of the year, the performance of public funds was impressive, and the average return of all kinds of funds was red. Among them, the average return of stock funds is 24.21%, and that of mixed funds is 16.32%.
(2) Wind: The 14th Summit of the leaders of the Group of Twenty (G20) closed in Osaka, Japan, on June 29, according to an international commentary released by Xinhua News Agency. At the historic juncture of international turmoil, China holds high the banner of multilateralism, advocates the spirit of partnership and cooperation, practices the concept of mutual benefit and win-win situation, interprets the idea of common development, makes important contributions to the success of the Summit, and adds stable expectations to the world economy.
(3) The National Network Security Industry Development Plan was officially promulgated, and the Ministry of Industry and Information Technology and the Beijing Municipal People's Government decided to build the National Network Security Industry Park. According to the plan, by 2020, relying on industrial parks to drive the scale of Beijing's network security industry to over 100 billion yuan, boosting GDP growth to over 330 billion yuan, creating no less than three backbone enterprises with annual income of more than 10 billion yuan.
(4) The NDRC: Catalogue of Industries Encouraging Foreign Investment (2019 Edition), Special Administrative Measures for Foreign Investment Access in Free Trade Pilot Zones (2019 Edition), Special Administrative Measures for Foreign Investment Access (2019 Edition), and Special Administrative Measures for Foreign Investment Access (2019 Edition) have been approved by the CPC Central Committee and the State Council, and are now promulgated and implemented since July 30, 2019. From July 30, restrictions on foreign investment entering shipping agents, urban gas, cinemas, performance brokers, value- added telecommunications, oil and gas exploration and development will be further relaxed or eliminated.
(5) Wind: Chinese President Xi Jinping met with US President Trump in Osaka on the 29th. The two heads of state exchanged in-depth views on fundamental issues concerning the development of Sino-US relations, current economic and trade frictions between China and the United States, and international and regional issues of common concern. They agreed to steer the development of Sino-US relations at the next stage and to promote Sino-US relations based on coordination, cooperation and stability.
The heads of state of China and the United States agreed to resume economic and trade negotiations between the two countries, and the United States indicated that it would no longer impose new tariffs on Chinese exports.
(6) In June, the PMI of China's manufacturing sector was 49.4, which was the same as last month, while that of non-manufacturing sector was 54.2, with a pre-value of 54.3. Statistics Bureau interprets PMI: In June, the PMI of manufacturing industry was 49.4%. The prosperity level of manufacturing industry was similar to that of last month. The output index of comprehensive PMI was 53.0%. It dropped 0.3 percentage points compared with last month, indicating that the production and operation activities of enterprises in China maintained expansion, but the pace slowed down.
1. StockMarket
(1) Indices Performance
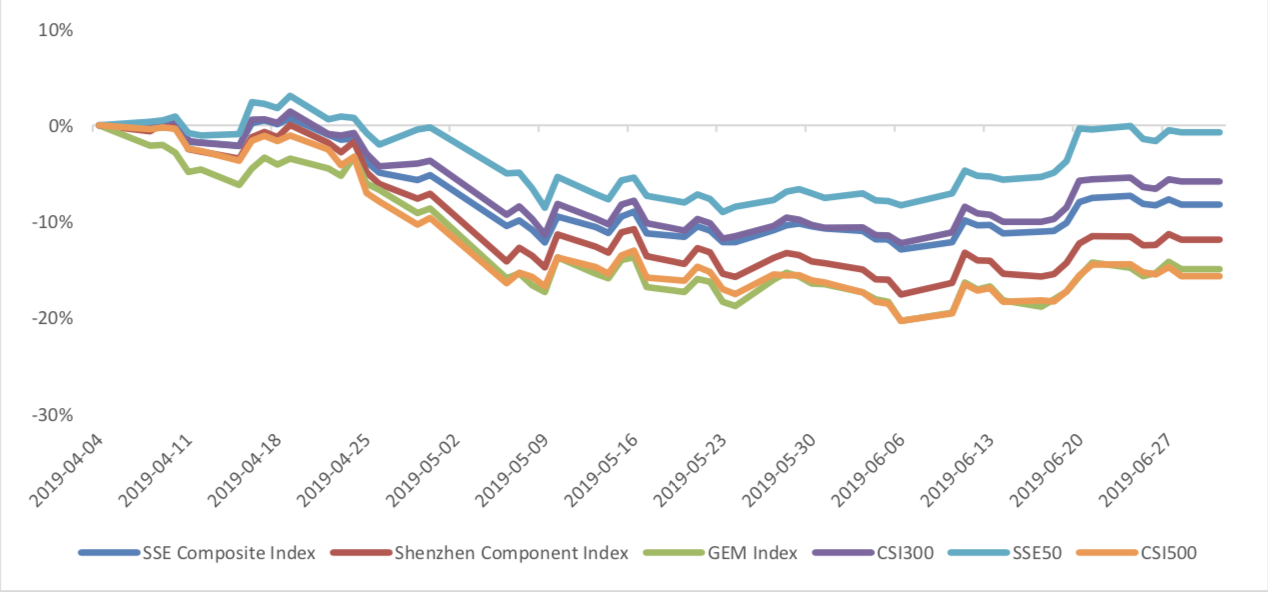
During last week, SSE Composite Index (000001.SH) changed -0.77 % to 2978.88, SHENZHEN COMPONENT INDEX (399001.SZ) changed -0.39 % to 9178.31, ChiNext PRICE INDEX (399006.SZ) changed -0.81 % to 1511.51, CSI 300 INDEX (000300.SH) changed -0.22 % to 3825.59, CSI SmallCap 500 index (000905.SH) changed -1.41 % to 4950.48, SSE 50 Index (000016.SH) changed -0.28 % to 2930.60.
Graph 1: Indices Performance over past 3 months
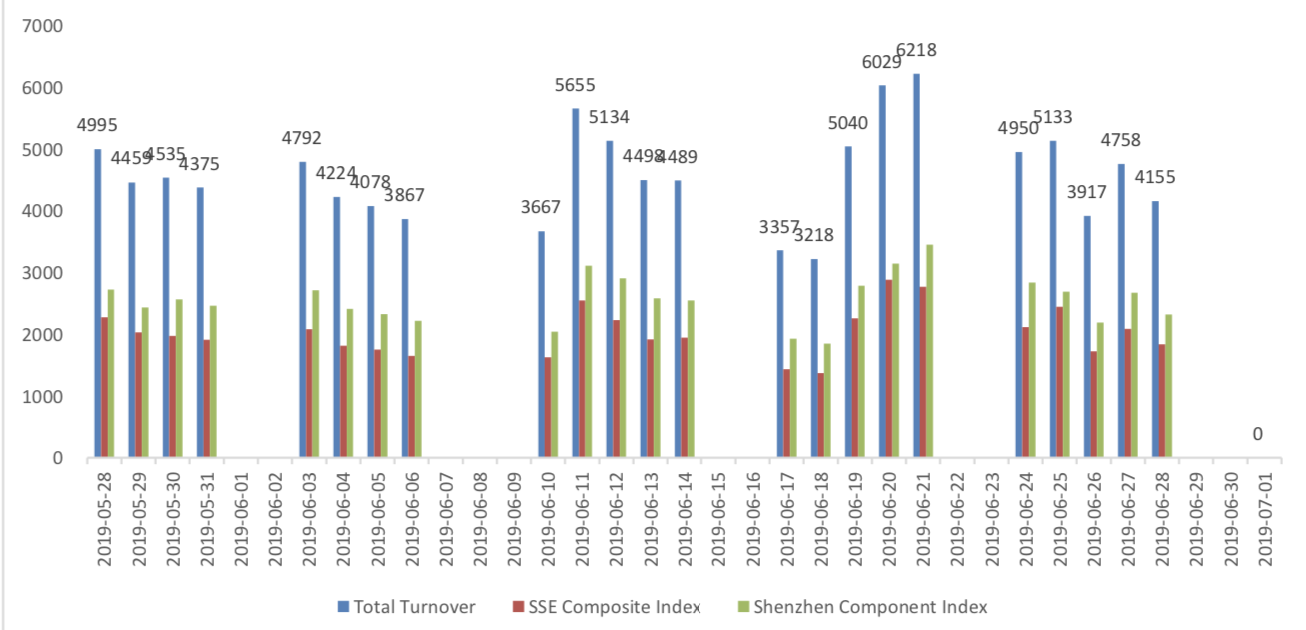
The average daily turnover of the whole market during past 5 trading days is 449.07 billion CNY, it decreased 11.79% compared with the previous 5-trading day period.
Graph 2: Market turnover
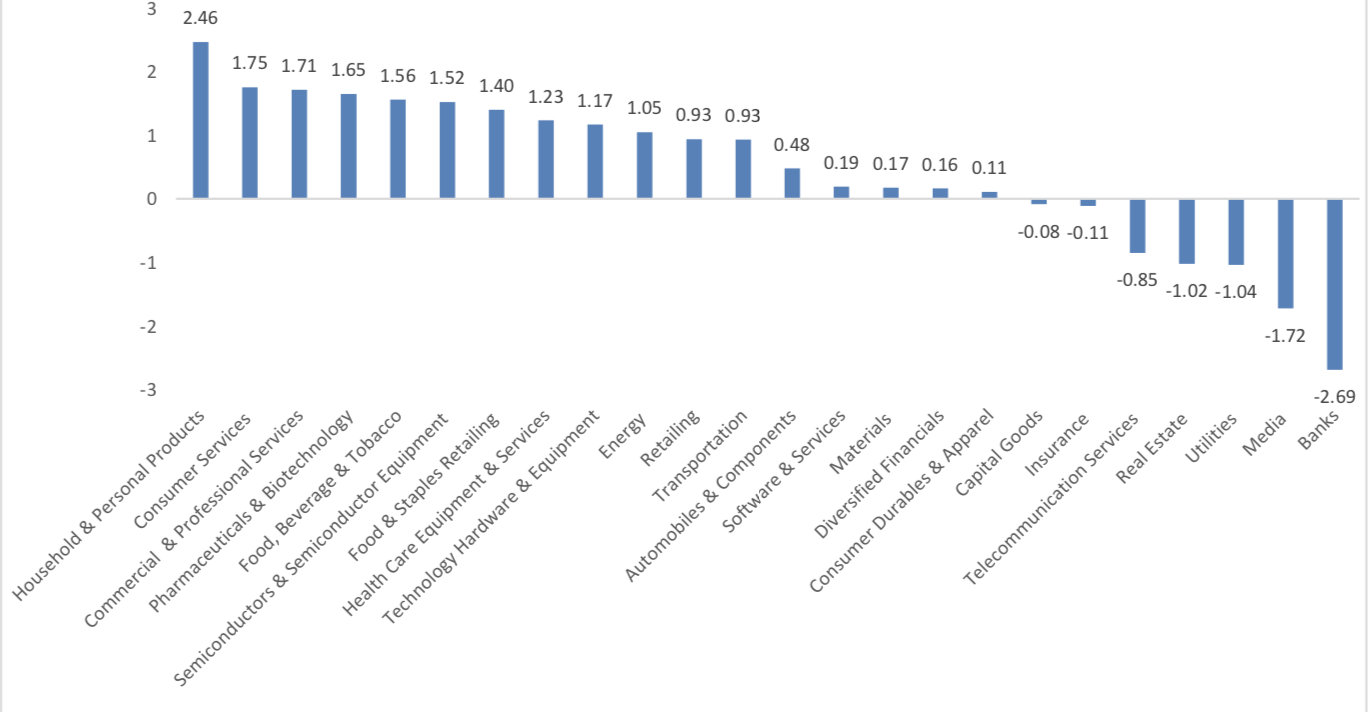
In the view of sectors, during last week (from 2019-06-21 to 2019-06-28), 17 of 24 Wind Level- 2 sector(s) increased while 7 sector(s) dropped. Specifically, Household & Personal Products(2.46%), Consumer Services (1.75%) and Commercial & Professional Services(1.71%) did the best performance while Banks(-2.69%), Media (-1.72%) and Utilities (-1.04%) did the worst performance.
Graph 3: Sectors performance under Wind Level-2 classification (%)
(3) Indices Valuation (TTM)
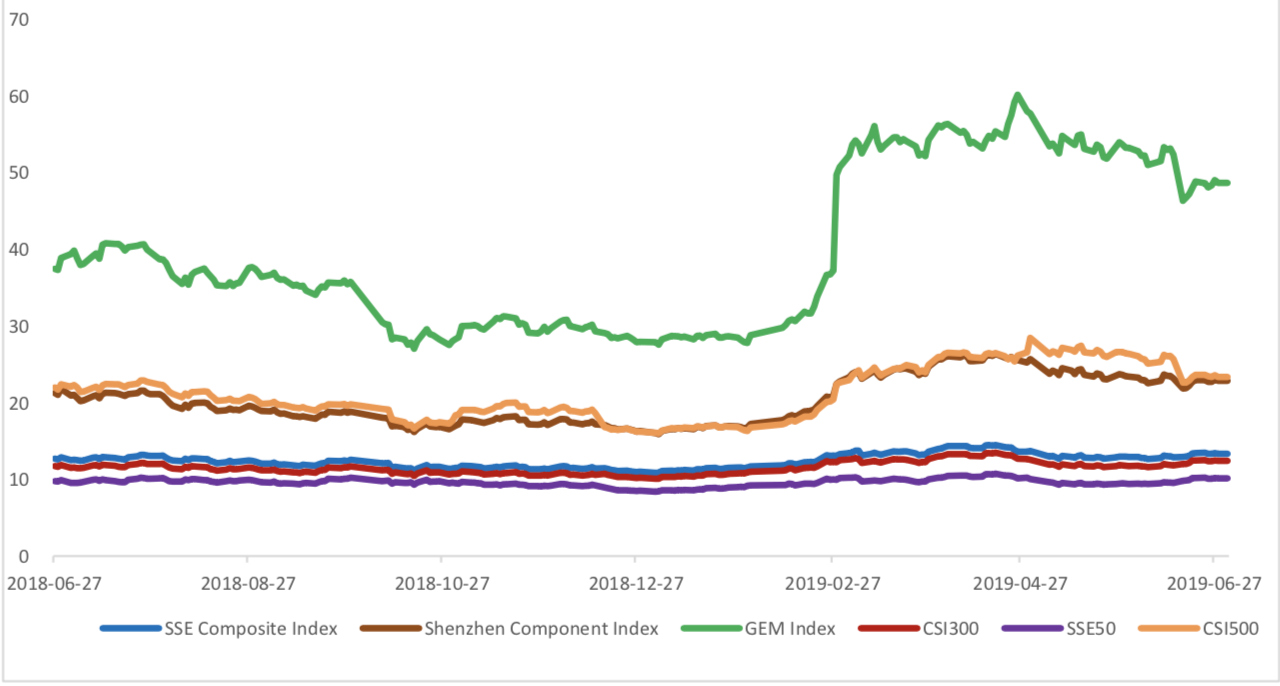
The current PE for SSE Composite Index, Shenzhen Component Index, GEM Index, CSI300, SSE50, CSI500 are 13.3491, 22.8690, 48.6646, 12.4403, 10.1261, 23.3349respectively; and these indices are at 27.60%, 28.70%, 48.40%, 40.70%, 45.30%, 14.70% percent rank level of their historic data, respectively
Graph 4: PE of 6 indices
Graph 5: PE percent rank of 6 indices (calculated by data of past 1200 trading days, only 1Y data is presented on the graph)

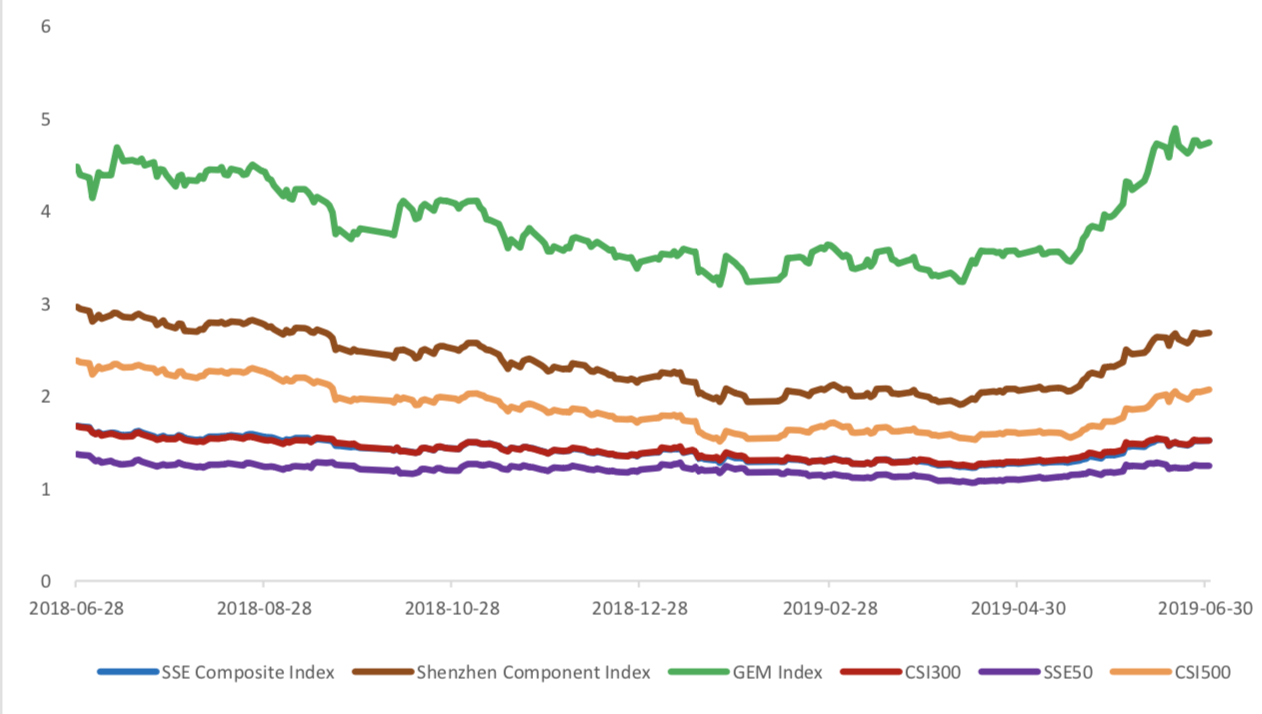
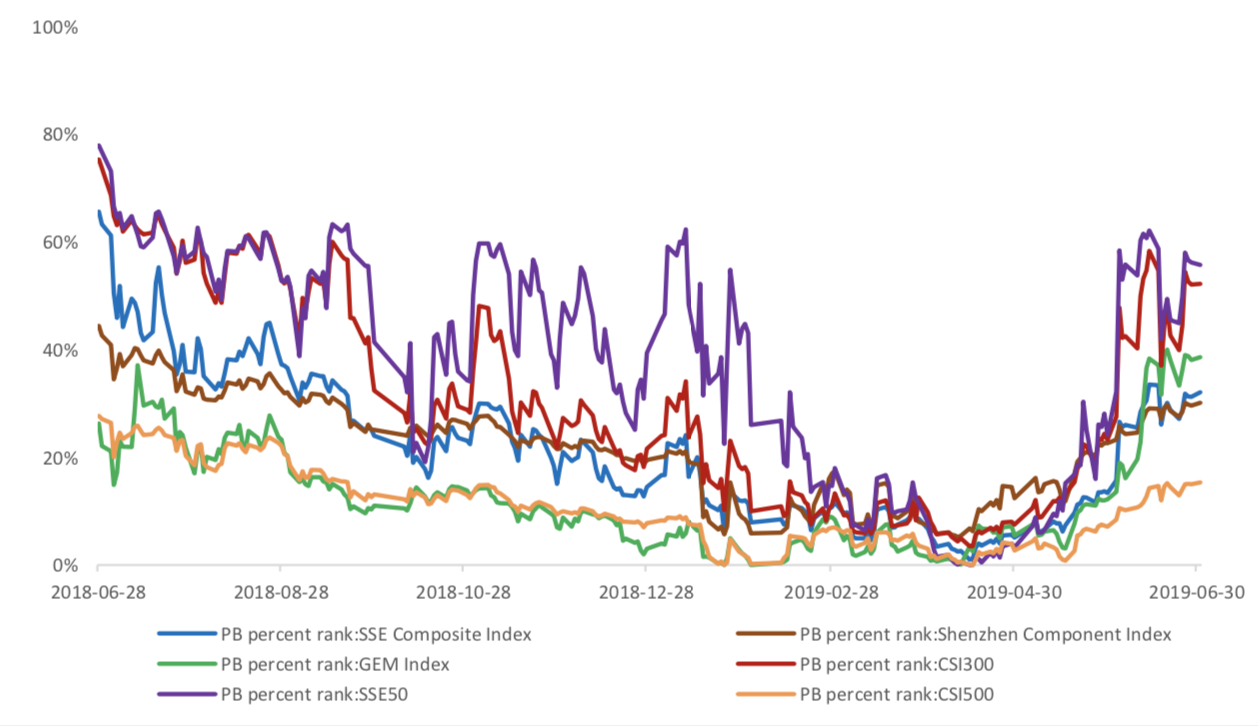
The current PB for SSE Composite Index, Shenzhen Component Index, GEM Index, CSI300, SSE50, CSI500 are 1.5185,2.6827,4.7397,1.5190,1.2443, 2.0682respectively, and these indices are at 32.10%, 30.10%, 38.60%, 52.20%, 55.70%, 15.30% percent rank level of their historic data, respectively.
Graph 6: PB of 6 indices
Graph 7: PB percent rank of 6 indices (calculated by data of past 1200 trading days, only 1Y data is presented on the graph)
(4) Foreign Fund Flow
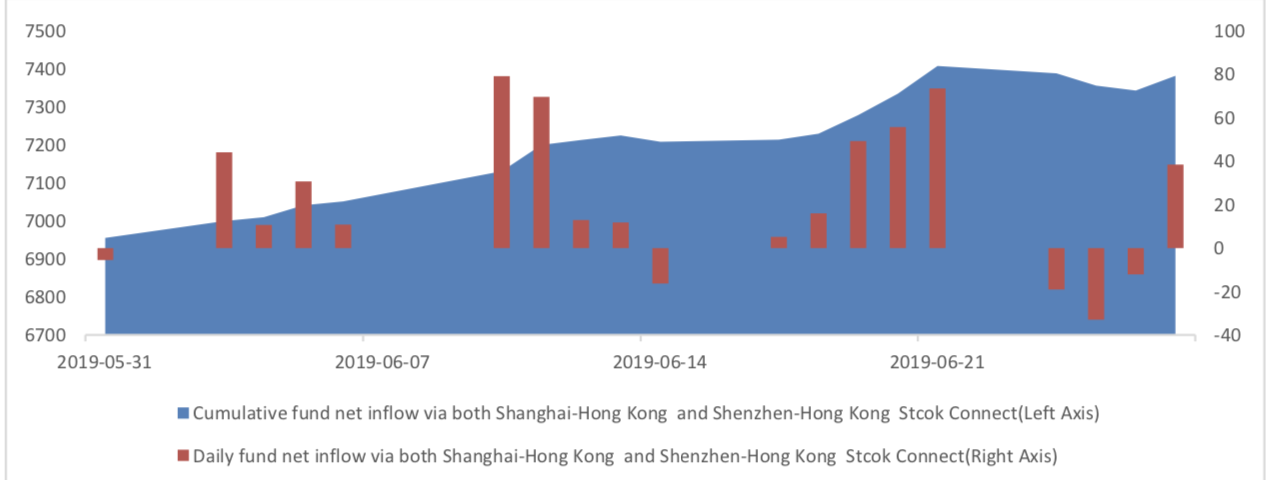
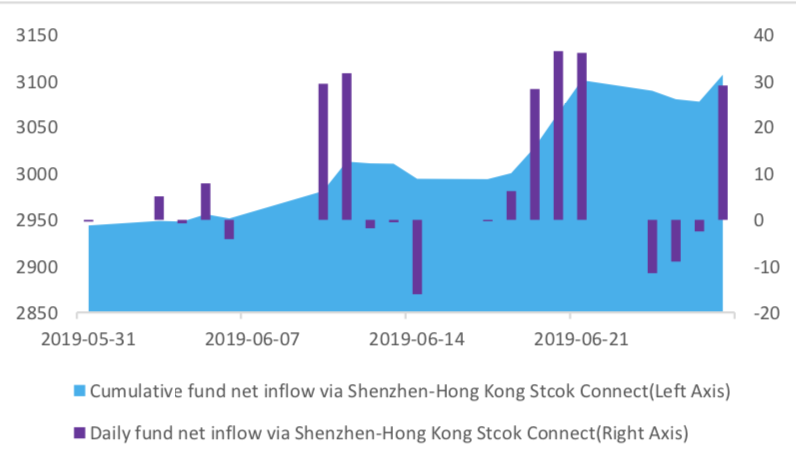
Last week, there were trading days for northward channel open for stock connect programs. During last week the total foreign fund flow via Stock Connect is -2.59 billion RMB, and the cumulative inflows was 738.10 billion RMB. Specifically, the fund flow via Shanghai-Hong Kong Stock Connect is -3.18 billion RMB and the fund flow via Shenzhen-Hong Kong Stock Connect is 0.59 billion RMB.
Graph 8: Fund flow via both Shanghai and Shenzhen-Hong Kong Stock Connect in past 1M (100 million CNY)
Graph 9: Fund flow via Shenzhen-Hong Kong Stock Connect in past 1M (100 million CNY)
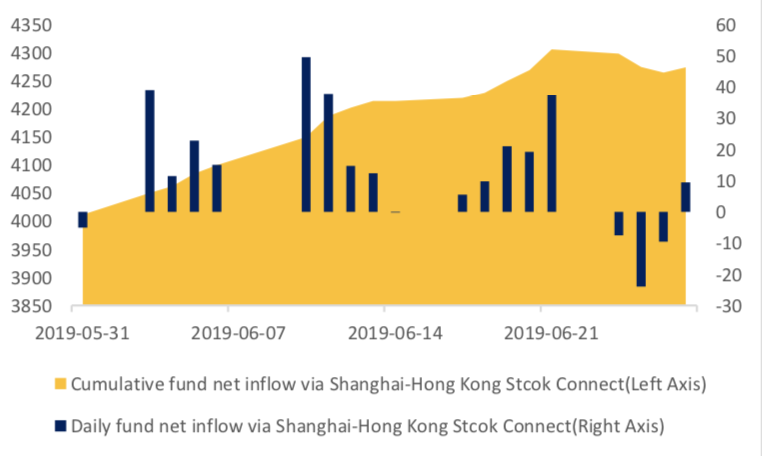
Graph 10: Fund flow via both Shanghai-Hong Kong Stock Connect in past 1M (100 million CNY)
2. Index Futures
(1) Trading Volume and Open Interests
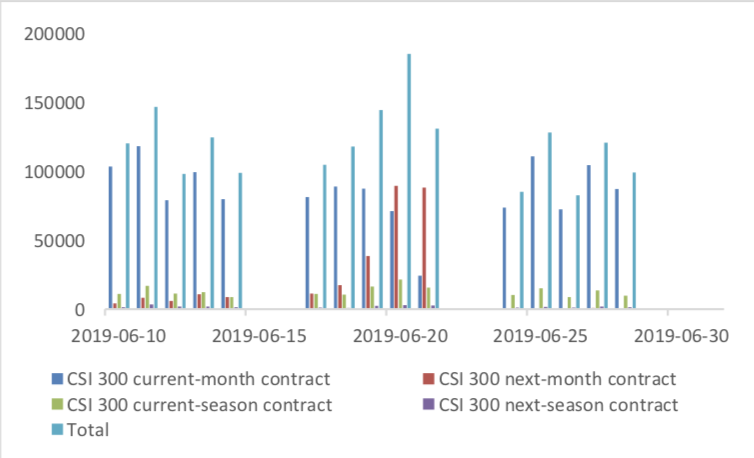
During past 5 trading days the average trading volume for CSI300(IF), SSE50(IH), CSI500(IC) contracts
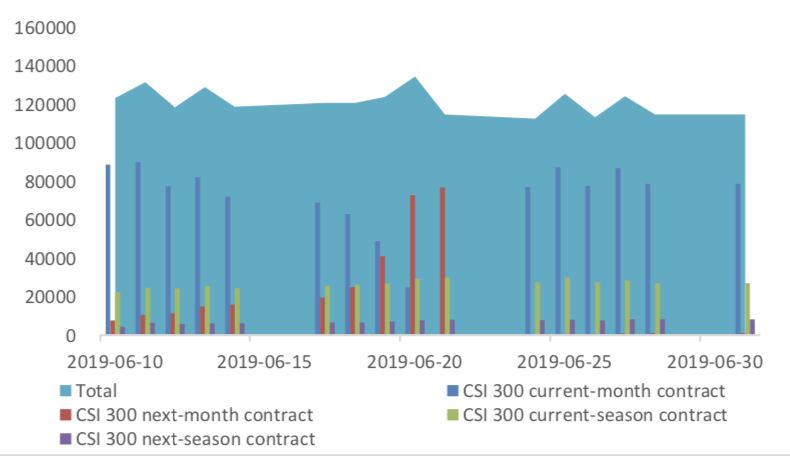
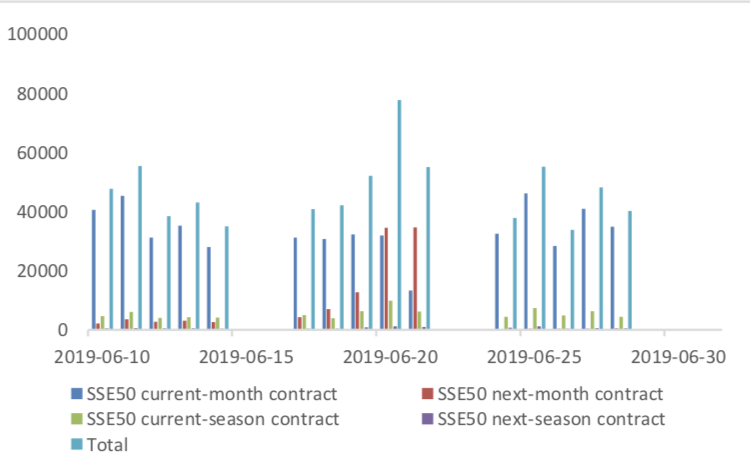
are 86085 (-35.12%, the previous 5-trading day period),35484 (-32.96%),68035 (-38.88%) lots, respectively. On the last trading day, the total open interests for them are 114836 (1.95%),58090 (3.52%),124760 (1.68%) lots respectively.
Graph 11: CSI300 Index futures’ trading volume
Graph 12: CSI300 Index futures’ open interests
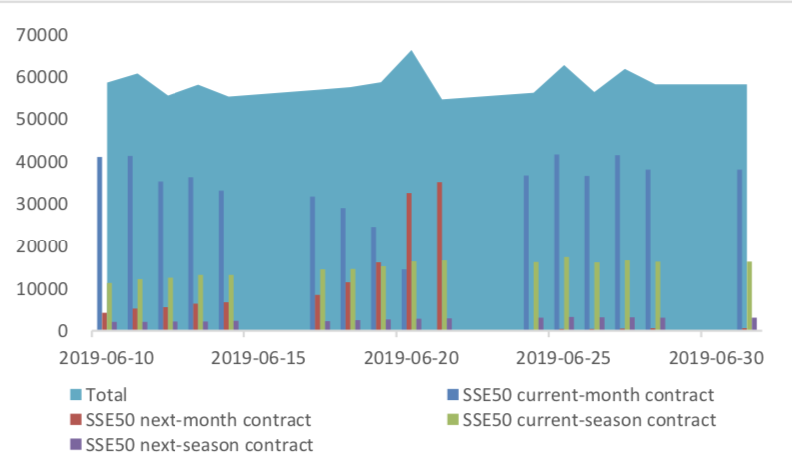
Graph 13:SSE50 Index futures’ trading volume
Graph 14: SSE50 Index futures’ open interests
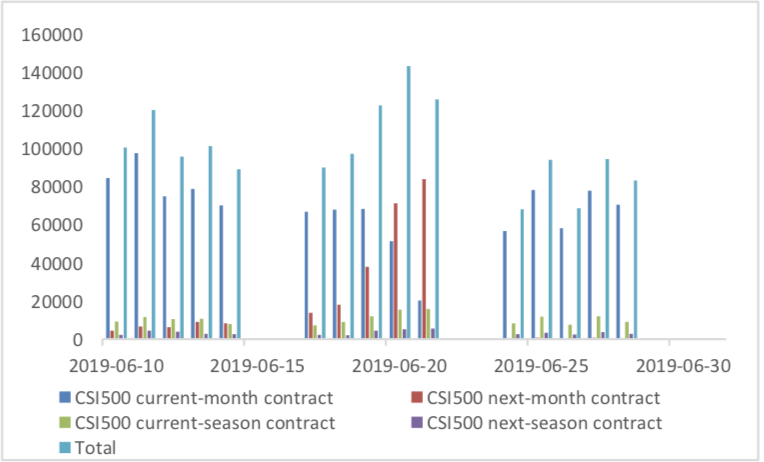
Graph 15: CSI500 Index futures’ trading volume
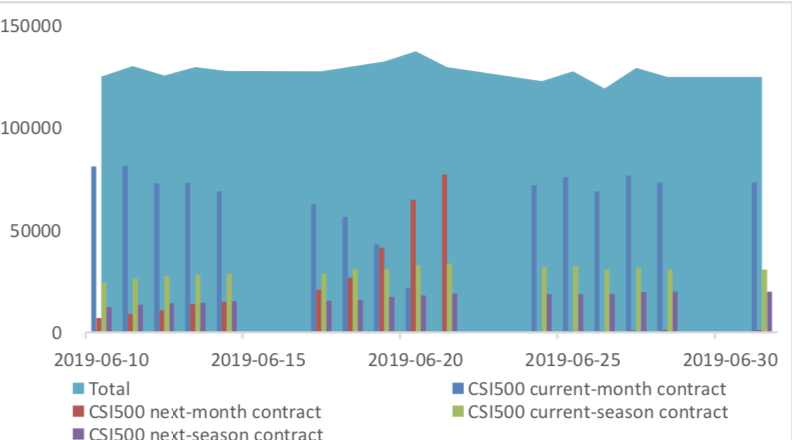
Graph 16: CSI500 Index futures’ open interests
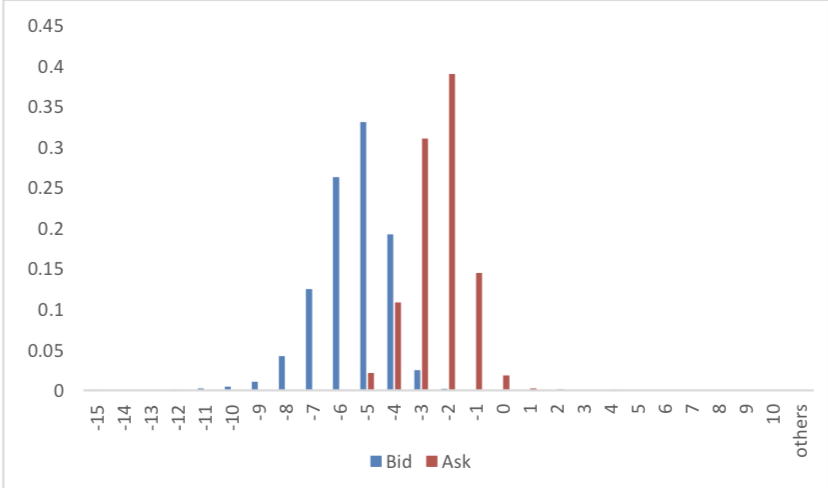
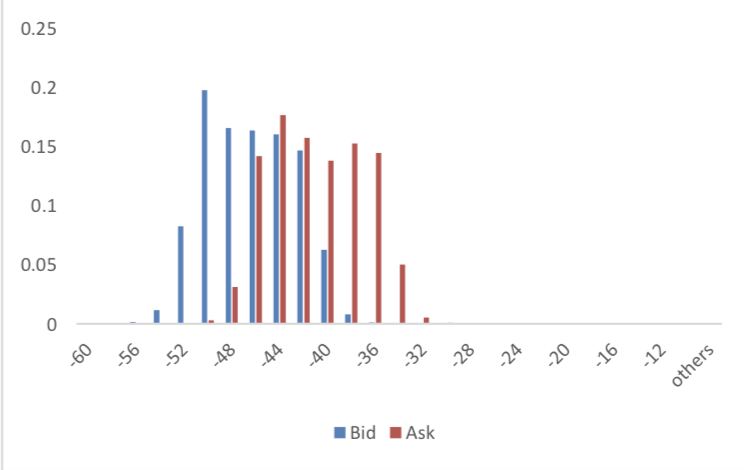
(2) Roll Level Bid-Ask Distribution
There are 5 trading days during last week, so the distribution is worked out with 36005 data points for each contract pair.
Graph 17: CSI300 Current/Next Month Contract Roll Spread Distribution (2s frequency)
Graph 18: SSE50 Current/Next Month Contract Roll Spread Distribution (2s frequency)
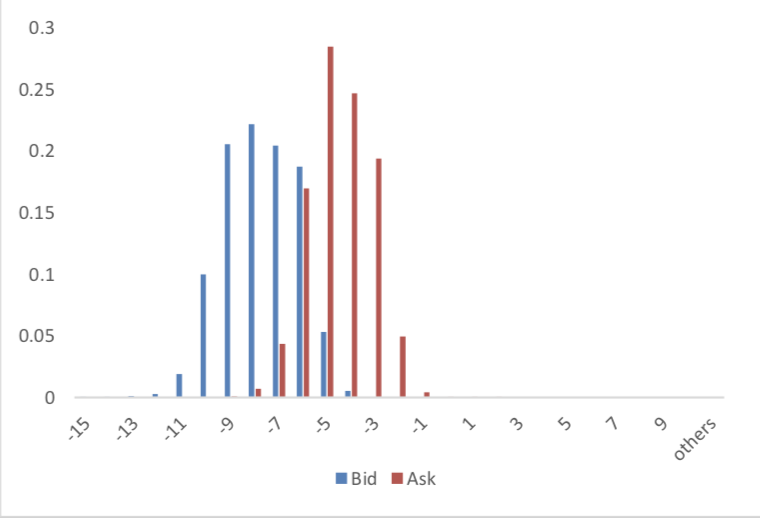
Graph 19: CSI500 Current/Next Month Contract Roll Spread Distribution (2s frequency)
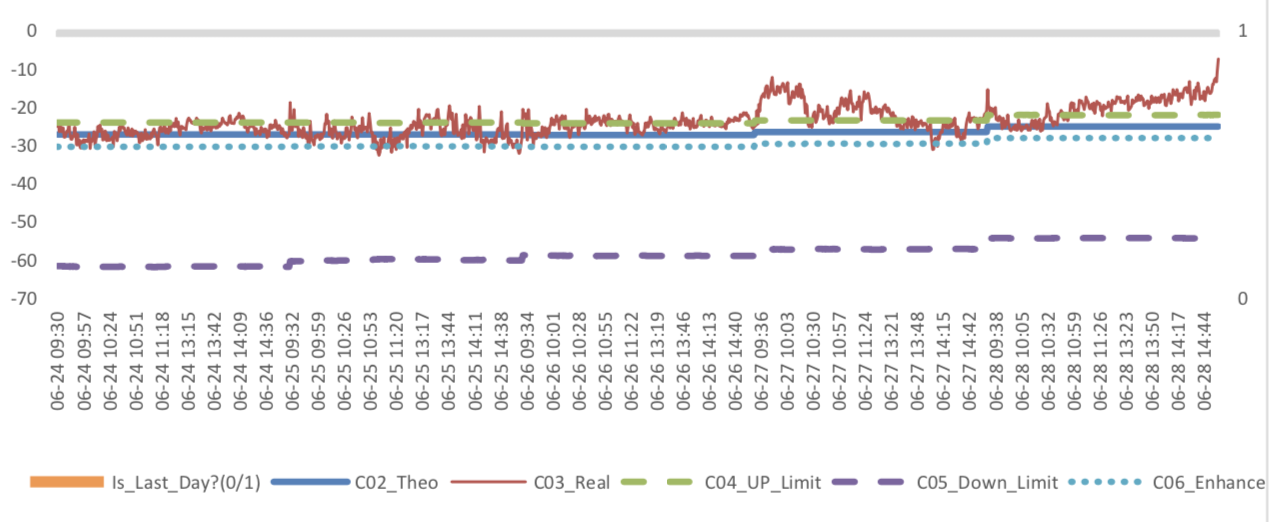
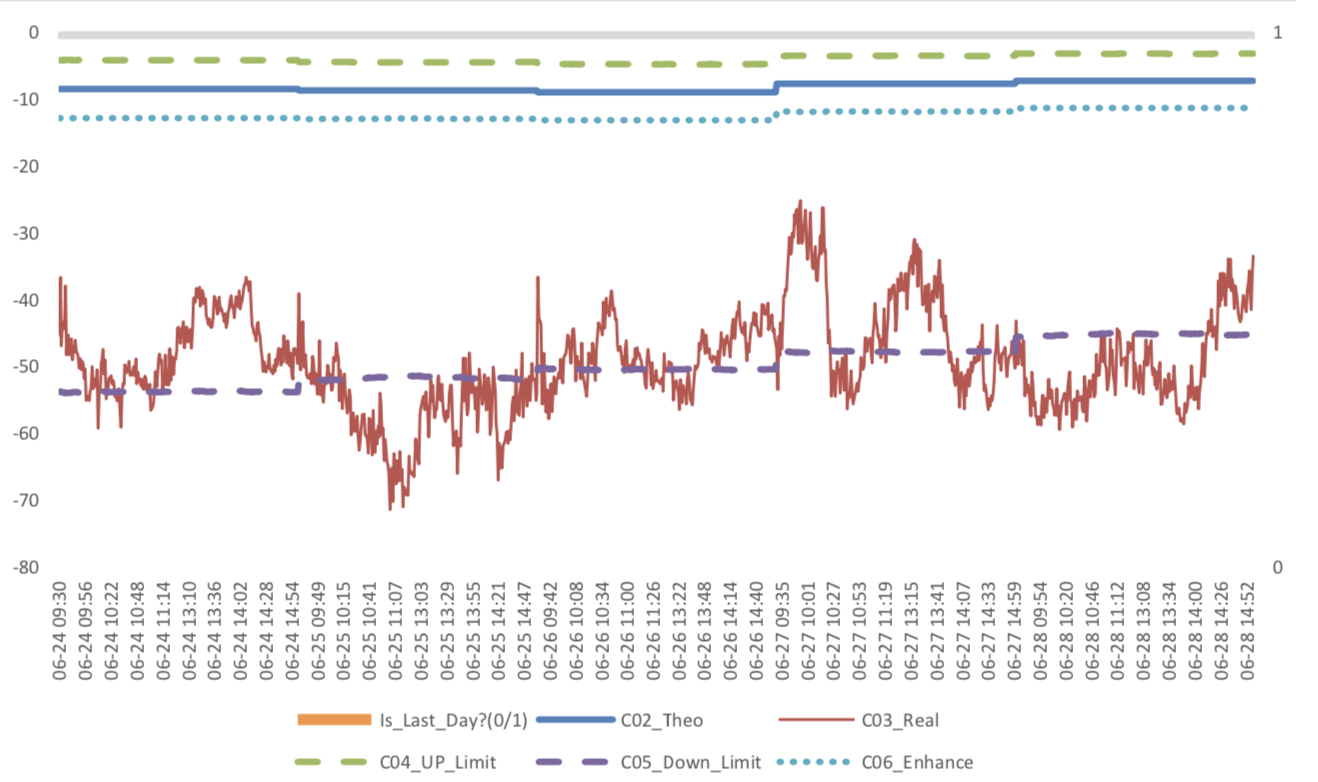
Assumption: risk-free rate: 3%; security borrowing cost: 8%; trading expense for spot: 0.025%; trading expense for futures: 0.005%; margin rates for futures contracts: 0.11 for CSI300 and SSE50, 0.13 for CSI500; margin rate for security borrowing: 0.3 (or 130% maintain rate).
When real price spread is out of theoretical range (calculated by our assumption), there exists absolute future-spot arbitrage opportunity.
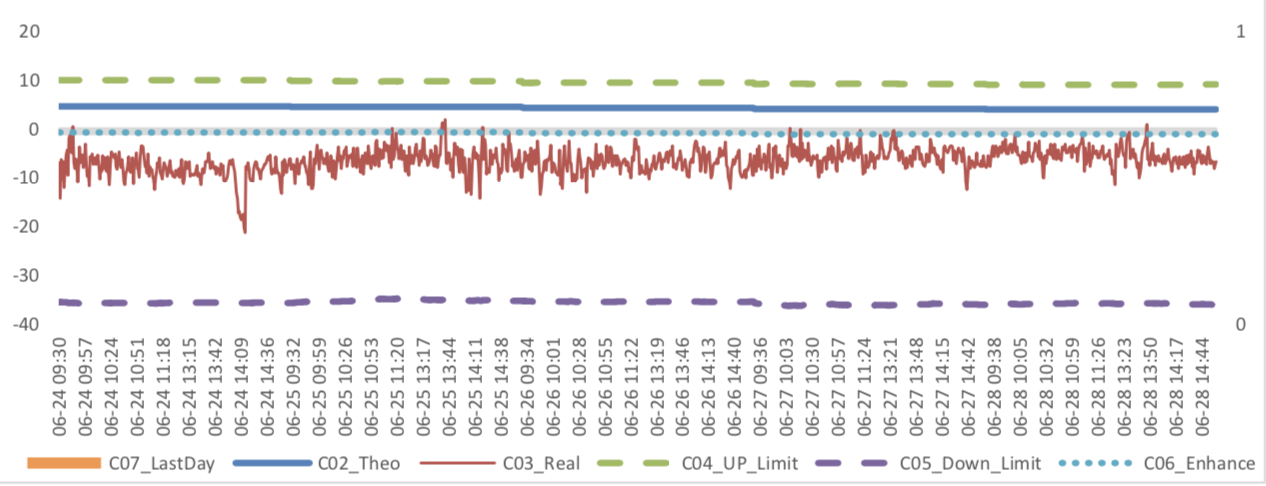
Graph 20: Future (Current Month)-Spot Arbitrage Opportunity for CSI300 contract (in the view of price difference)
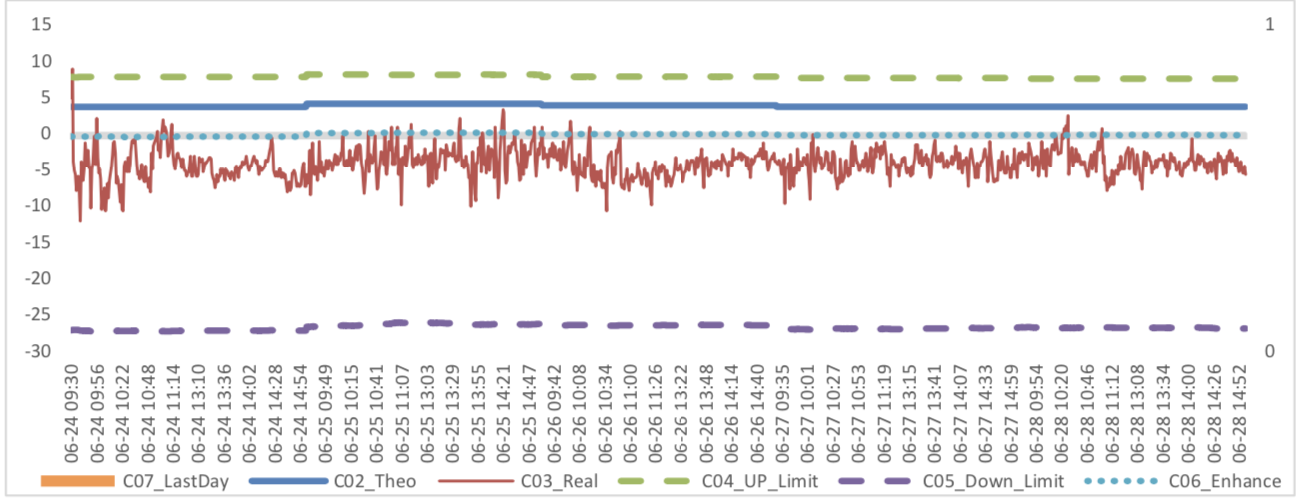
Graph 21: Future (Current Month)-Spot Arbitrage Opportunity for SSE50 contract (in the view of price difference)

Graph 22: Future (Current Month)-Spot Arbitrage Opportunity for CSI500 contract (in the view of price difference)
Graph 23: Future (Next Month-Current Month) Arbitrage Opportunity for CSI300 contract (in the view of price difference)
Graph 24: Future (Next Month-Current Month) Arbitrage Opportunity for SSE50 contract (in the view of price difference)
Graph 25: Future (Next Month-Current Month) Arbitrage Opportunity for CSI500 contract (in the view of price difference)
3. Financial Markets
(1) InterestRates
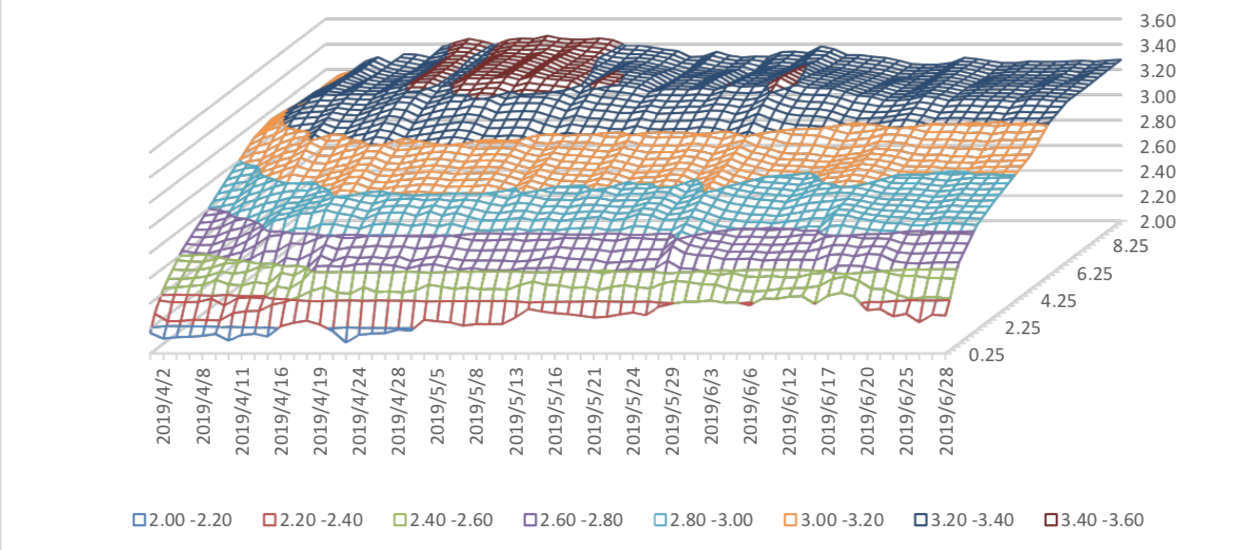
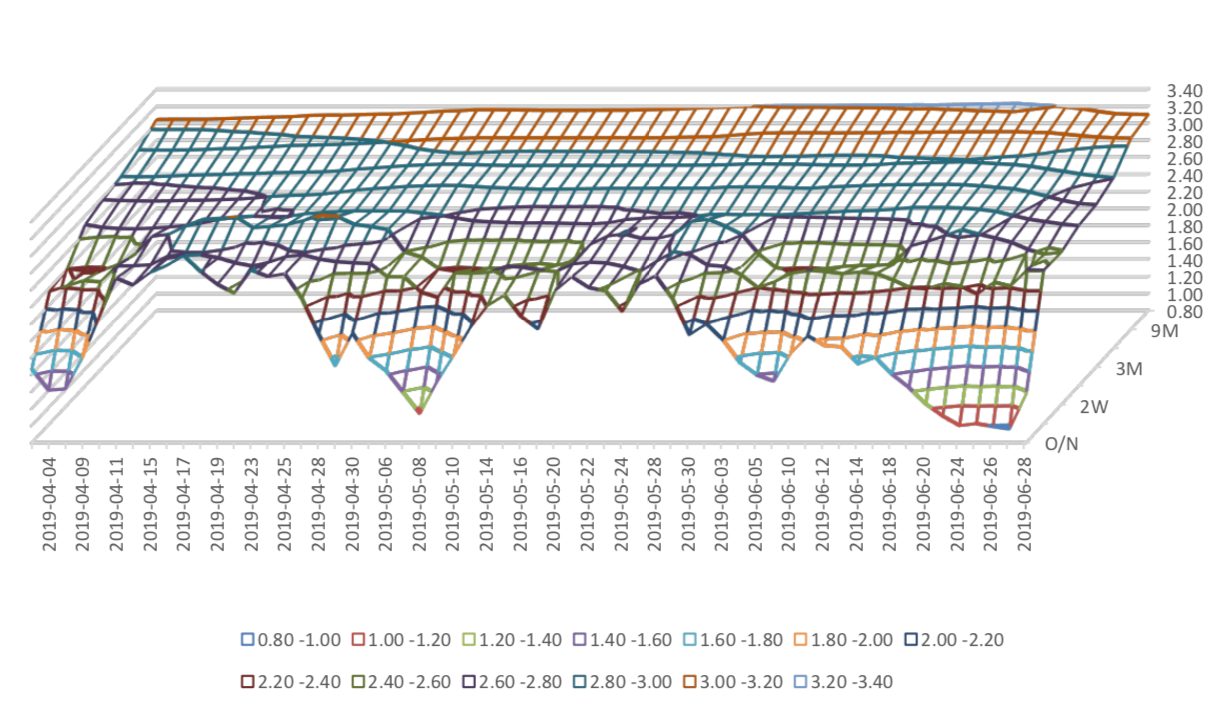
The term structure of treasury bonds’ yields is currently upward sloping in concave shape.
Specifically, last week, short-term yields short term yield of Treasury bond experienced some fluctuation and 3M yield now at 2.2%-2.4% level. Furthermore, as for long-term yield, there is a small fluctuation. 10Y yield is about 3.2%-3.4%.
Graph 26: Term Structure Evolvement of Treasury Bonds Yields During Recent 3 Months (%)
As for Shibor rates, short-term rates experienced significant fluctuation. Specifically, O/N rate experienced obvious decrease to 1% level.
Graph 27: Term Structure Evolvement of Shibor Rates During Recent 3 Months (%)
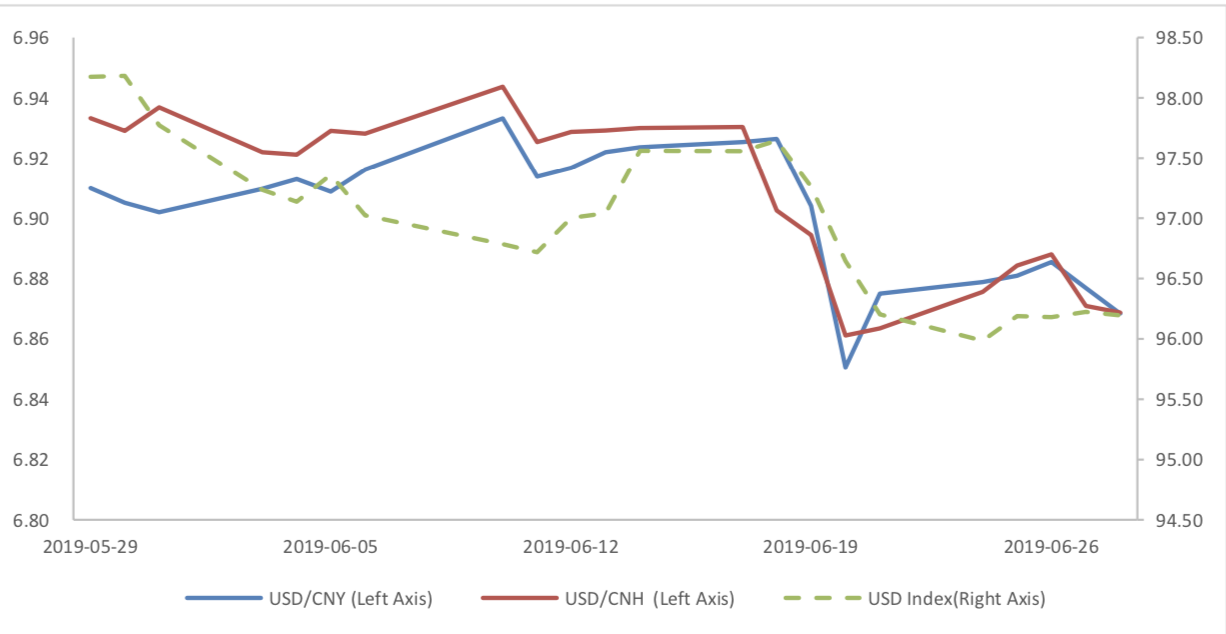
(2) ExchangeRates
During last week, CNY/USD changed -0.15% to 6.8683 and offshore rate, CNH/USD, changed -0.10% to 6.8687 and USD index changed 0.22%.
Graph 28: USD/CNY, USD/CNH and USD Index
Macroeconomic Topic:
On 2019/06/30, the June PMI data was released. The data showed unchanged PMI in June after a drop in May. The manufacturing PMI was 49.4 percent, with pre-value of 49.4 percent. The non-manufacturing PMI was at 54.2 percent, with pre-value of 54.3 percent, while the composite PMI was at 53 percent, with pre-value of 53.3 percent.
Graph A: PMI Data
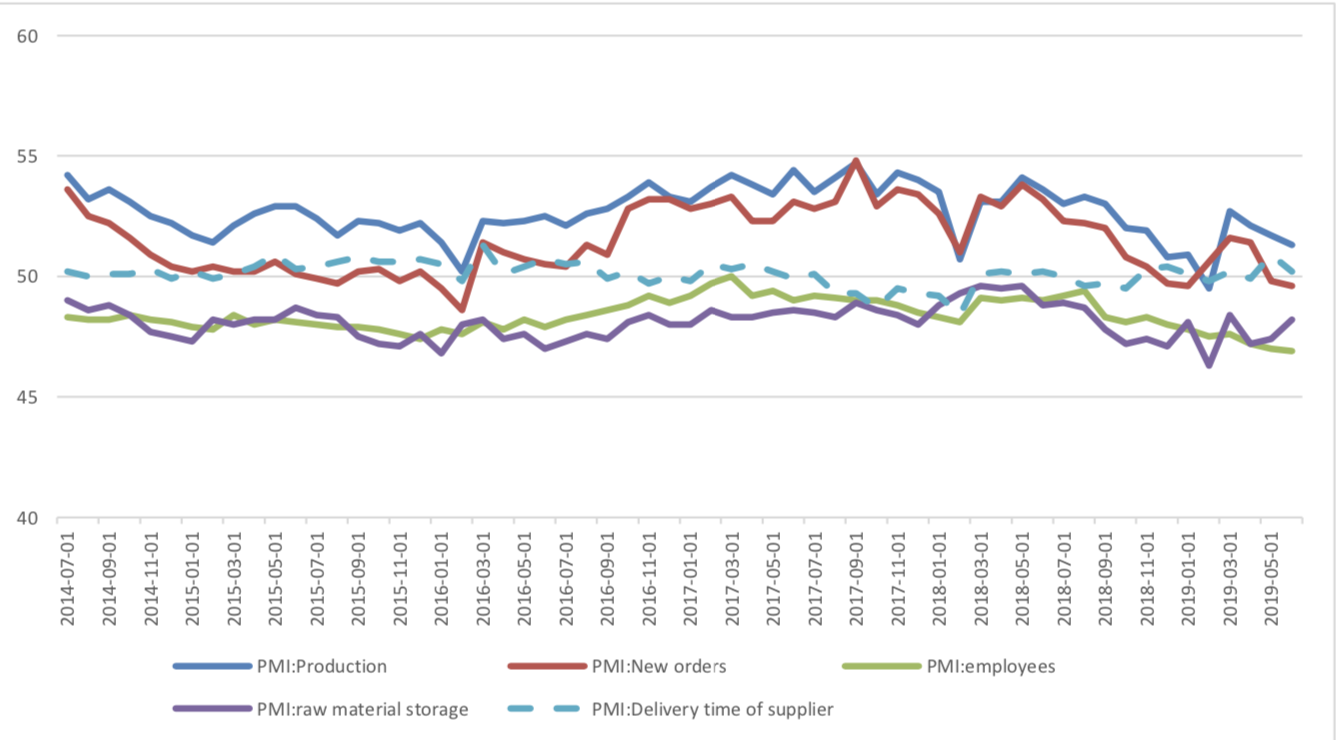
(1) About 5 Sub-indexes for manufacturing PMI calculation
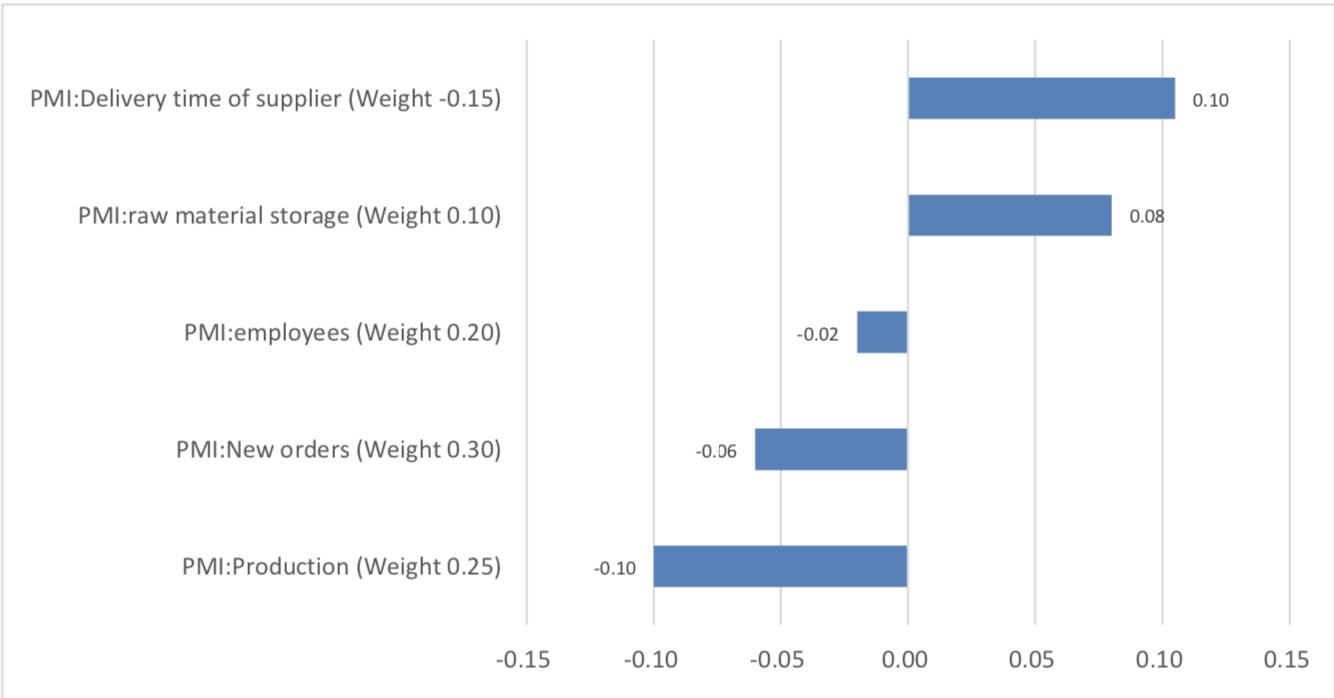
From the point of view of 5 sub-indexes: (1) the decline of PMI: production is the major force to drag manufacturing PMI. It was reported at 51.3%, still in expansion zone, with preceding value of 51.7% and it drags PMI for 0.1 percentage points. (2)The decline of PMI: new orders is another important force to drag manufacturing PMI. It was reported at 49.6%, still in contraction zone, with preceding value of 49.8% and it drags PMI for 0.06 percentage points. (3)The decline of PMI: employees is one relatively minor force to drag manufacturing PMI. It was reported at 46.9%, still in contraction zone, with preceding value of 47% and it drags PMI for 0.02 percentage points. It was the lowest since December 2015. (4)The improvement of PMI: delivery time of supplier, is the major force to boost manufacturing PMI. It was reported at 50.2%, still in contraction zone, with preceding value of 50.9% and it boosted PMI for 0.1 percentage points. (5)The improvement of PMI: raw material storage, gave a positive force for manufacturing PMI. It was reported at 48.2%, still in contraction zone, with preceding value of 47.4% and it boosted PMI for 0.08 percentage points.
Graph B: PMI 5 sub-indexes
Graph C: PMI Change Contribution by 5 Sub-indexes
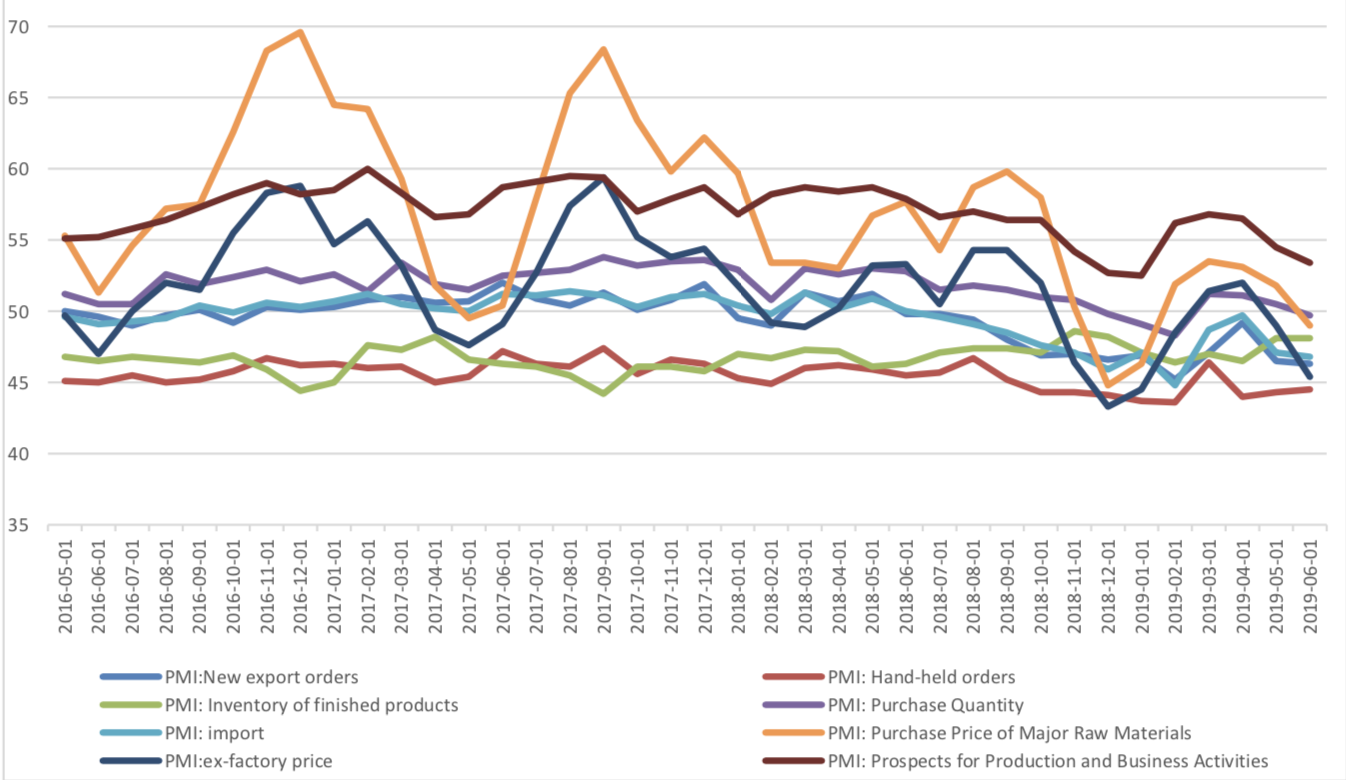
(2) About 8 Sub-indexes not for manufacturing PMI calculation
1 of 8 sub-indexes are above 50, in expansion zone and the remaining indexes are in contraction zone. Several points need to mention: ex-factory price dropped significantly to 45.4% with the pre-valve of 49%. Purchase price of major raw material also dropped significantly from 51.8% to 49%. This indicates the decrease of the June PPI data and weaker demand. Furthermore, the prospect for production and business activities also show an obvious drop. The data shows a totally decrease and pessimistic view.
Graph D: PMI for 8 Sub-indexes not for manufacturing PMI calculation
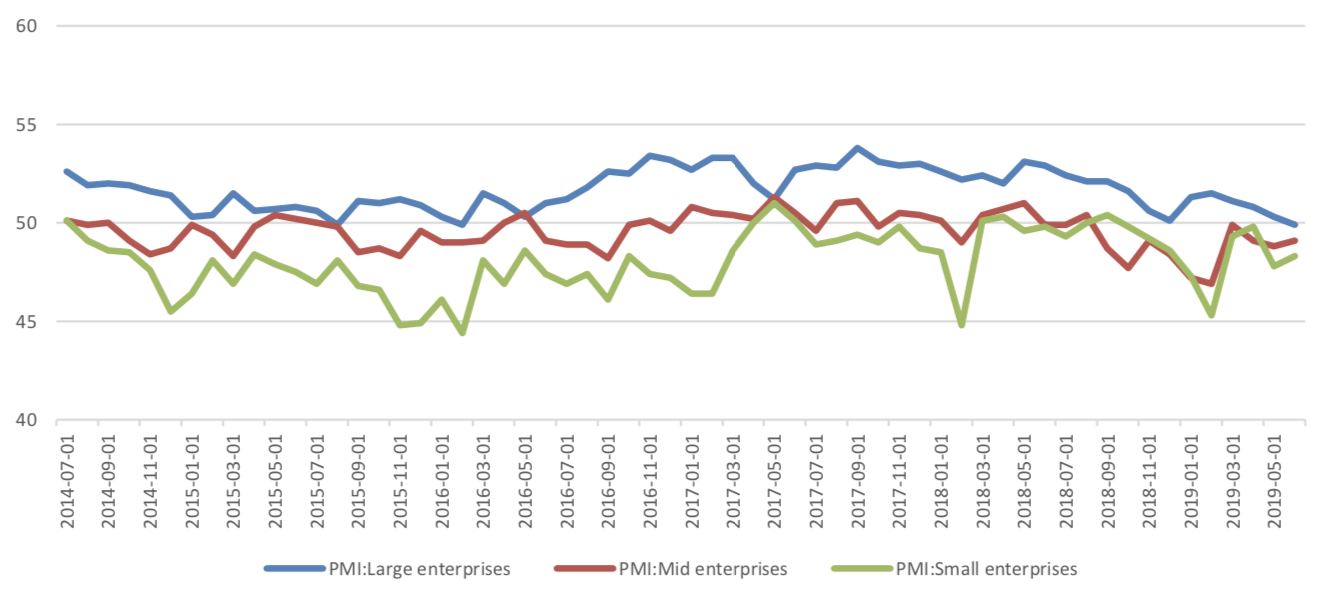
(3) PMI by enterprises size
From the perspective of PMI of large and medium-sized enterprises, large enterprises have a slight decline but move to contraction area, while small and medium-sized enterprises are still in the contraction area, but have some increase.
Graph E: PMI by enterprises size
(4) Summary
The PMI data still shows a significant downward pressure in economy. However, with the temporary alleviation of China-US trade conflict as Xi and Trump meet G20 in Osaka, the prospect should be improved.
Currently no Comments.
Hot Topics
The 13rd China International Future Forum
The Shanghai Derivatives Energy Forum has received extensive attention from relevant industries both within and outside the borders.
Financial institutions deep explore commodity market opportunities, commodity index financial products show full-scale trend
R-Code for analysis: getKDJ
R-Code@June 06, 2016
New indicator to analyze the arbitrage opportunities between sse50 and csi500
Market review: January 11, 2017
The Great China Bubble: Anniversary Lessons and Outlook
Quant Investment in China A-share market
The hedge strategy between SSE50 and A50--Jan 13,2017
The arbitraging strategy between CSI300 and SSE50
Market review: June 17, 2016
Sleepless in London--Enda Homan(Allied Irish Banks Plc)
MSCI Rebuffs Chinese Equities for Third Time in Blow to Xi
Soros, Druckenmiller among hedgies profiting in market plunge