FangQuant › Financial Futures
Market Summary:
Last week, there was generally increase over the market. SSE Composite Index (000001.SH) changed 1.05 % to 3031.24. Specifically, small cap shares perform slightly better than large cap shares and we can observe that CSI500 did better than SSE50 (1.71% vs 0.62%).
During the week, SAFE decided to cancel QFII/RQFII quota. The abolition of QFII/RQFII investment quota restriction marked an important progress in China's capital account liberalization and further enhanced the degree of China's financial market liberalization. In the future, with such financial market liberalization, A-share should attract more international fund and be further incorporated into international major indices like MSCI.
Over the weekend, Two oil facilities in Saudi Arabia have been temporarily shut down due to drone attacks, resulting in a reduction of about half of the company's total production, accounting for about 5% of the world's daily oil production. Oil price obviously gets significant impact, major oil contracts (Brent, WTI) rose above 10% over this morning (9/16). We should also the see the impact on other markets.
As for arbitrage opportunity, all futures current-month contracts show some room for arbitrage opportunities. No spread for next-month/current month contracts was low and show some room for arbitrage.
News:
(1) Sina: According to informed officials, central bankers of France, the Netherlands, Germany and other core countries in the euro zone oppose the decision of ECB President Draghi to restart QE. According to officials familiar with the matter, A key factor in other policymakers' opposition to Draghi's resumption of QE is their belief that QE is more appropriate as an emergency measure, such as Britain's exit from Europe without a transitional agreement.
(2) Sina: Former Federal Reserve Chairman Yellen said that the U.S. economy is healthy, but she reiterated last month's warning that the possibility of a U.S. recession has increased, but that the recession will not come. Yellen said the Fed was expected to push inflation to its 2% target but was cautious about continued weak price pressures. The idea that the Fed should reduce interest rates to zero or negative to finance Treasury bonds is a "long-term negative" concept.
(3) Xinhua News Agency: Chairman of the US-China National Committee on Trade: Trade frictions continue to cause losses to all parts of the United States and enterprises, especially sales losses caused by tariff policies; the US-China economy is highly interdependent, and falling exports to China will reduce the number of high-paying jobs in the United States. The US-China National Committee on Trade continues to call for a negotiation and abolish the tariff measures.
(4) Economic Daily: Experts believe that China's private economy has made remarkable achievements and has strong internal driving force for development. It plays a "role and role" in economic and social development. Local governments have "knowledge and measures" in supporting and guiding the development of private enterprises. Private economy has new technologies, new industries, new formats and new models. In the process of the "Four New" development, there are "bright spots and contributions". The development of private economy presents the characteristics of "new ecology, new pattern, new stage and new momentum". The industrial pattern, scale pattern and technological structure are obviously optimized.
(5) People's Daily: Recently, the General Office of the State Council issued "Opinions on stabilizing pig production and promoting transformation and upgrading". Analysts believe that the publication of "Opinions" provides a strong guarantee for stable production and supply of live pigs, points out the direction for accelerating the transformation and upgrading of modern pig industry, and is of great significance for promoting the high-quality development of the pig industry and comprehensively improving the guarantee ability of pork supply.
(6) Xinhua News Agency: The World Investment Report 2019 issued by UNCTAD shows that in 2018, global outward FDI dropped 13% from the previous year to $1.3 trillion, and the growth of international investment was weak. However, China's attraction of foreign investment has maintained steady growth. In 2018, China attracted 139 billion US dollars in foreign capital, accounting for more than 10% of the total amount of foreign capital absorbed worldwide, and continued to become the second largest foreign capital inflow country in the world.
(7) People's Daily: Benign interaction is more beneficial. Looking at the recent series of benign interactions between China and the United States, we can see that both sides are willing to do something positive to break the "deadlock". China-US economic and trade frictions have lasted for more than a year, and no one can overwhelm anyone, but they have brought about a situation in which the interests of both sides have been squeezed. It is not a wise and rational choice to let opposition, confrontation and even confrontation develop.
(8) Wind: Two oil facilities in Saudi Arabia and Amy, the world's largest oil company, have been temporarily shut down due to drone attacks, resulting in a reduction of about half of the company's total production, accounting for about 5% of the world's daily oil production. This not only highlights the vulnerability of facilities supplying 10% of the world's crude oil, but also plunges all parties into more games.
1. StockMarket
(1) Indices Performance
During last week, SSE Composite Index (000001.SH) changed 1.05 % to 3031.24, SHENZHEN COMPONENT INDEX (399001.SZ) changed 0.98 % to 9919.80, ChiNext PRICE INDEX (399006.SZ) changed 1.08 % to 1710.57, CSI 300 INDEX (000300.SH) changed 0.60 % to 3972.38, CSI SmallCap 500 index (000905.SH) changed 1.71 % to 5242.61, SSE 50 Index (000016.SH) changed 0.62 % to 2999.56.
Graph 1: Indices Performance over past 3 months

The average daily turnover of the whole market during past 5 trading days is 648.11 billion CNY, it increased 2.71% compared with the previous 5-trading day period.
Graph 2: Market turnover

In the view of sectors, during last week (from 2019-09-06 to 2019-09-13), 22 of 24 Wind Level- 2 sector(s) increased while 2 sector(s) dropped. Specifically, Telecommunication Services (6.53%), Diversified Financials(4.71%) and Software & Services(3.67%) did the best performance while Food, Beverage & Tobacco(-3.02%), Food & Staples Retailing (-0.50%) and Consumer Services (0.53%) did the worst performance.
Graph 3: Sectors performance under Wind Level-2 classification (%)

(3) Indices Valuation (TTM)
The current PE for SSE Composite Index, Shenzhen Component Index, GEM Index, CSI300, SSE50, CSI500 are 13.3505, 24.6579, 55.1866, 12.3523, 9.8384, 25.7447respectively; and these indices are at 27.10%, 36.90%, 67.80%, 38.20%, 35.10%, 24.10% percent rank level of their historic data, respectively
Graph 4: PE of 6 indices

Graph 5: PE percent rank of 6 indices (calculated by data of past 1200 trading days, only 1Y data is presented on the graph)

The current PB for SSE Composite Index, Shenzhen Component Index, GEM Index, CSI300, SSE50, CSI500 are 1.5185,2.6827,4.7397,1.5190,1.2443, 2.0682respectively, and these indices are at 32.10%, 30.10%, 38.60%, 52.20%, 55.70%, 15.30% percent rank level of their historic data, respectively.
Graph 6: PB of 6 indices

Graph 7: PB percent rank of 6 indices (calculated by data of past 1200 trading days, only 1Y data is presented on the graph)

(4) Foreign Fund Flow
Last week, there were 4 trading days for northward channel open for stock connect programs. During last week the total foreign fund flow via Stock Connect is 10.89 billion RMB, and the cumulative inflows was 802.23 billion RMB. Specifically, the fund flow via Shanghai-Hong Kong Stock Connect is7.57 billion RMB and the fund flow via Shenzhen-Hong Kong Stock Connect is 3.32 billion RMB.
Graph 8: Fund flow via both Shanghai and Shenzhen-Hong Kong Stock Connect in past 1M (100 million CNY)

Graph 9: Fund flow via Shenzhen-Hong Kong Stock Connect in past 1M (100 million CNY)

Graph 10: Fund flow via both Shanghai-Hong Kong Stock Connect in past 1M (100 million CNY)

2. Index Futures
(1) Trading Volume and Open Interests
During past 5 trading days the average trading volume for CSI300(IF), SSE50(IH), CSI500(IC) contracts
are 73516 (-26.86%, the previous 5-trading day period),28190 (-25.34%),76636 (-21.51%) lots, respectively. On the last trading day, the total open interests for them are 123287 (-1.23%),60202 (1.58%),154481 (- 2.43%) lots respectively.
Graph 11: CSI300 Index futures’ trading volume

Graph 12: CSI300 Index futures’ open interests

Graph 13:SSE50 Index futures’ trading volume

Graph 14: SSE50 Index futures’ open interests

Graph 15: CSI500 Index futures’ trading volume
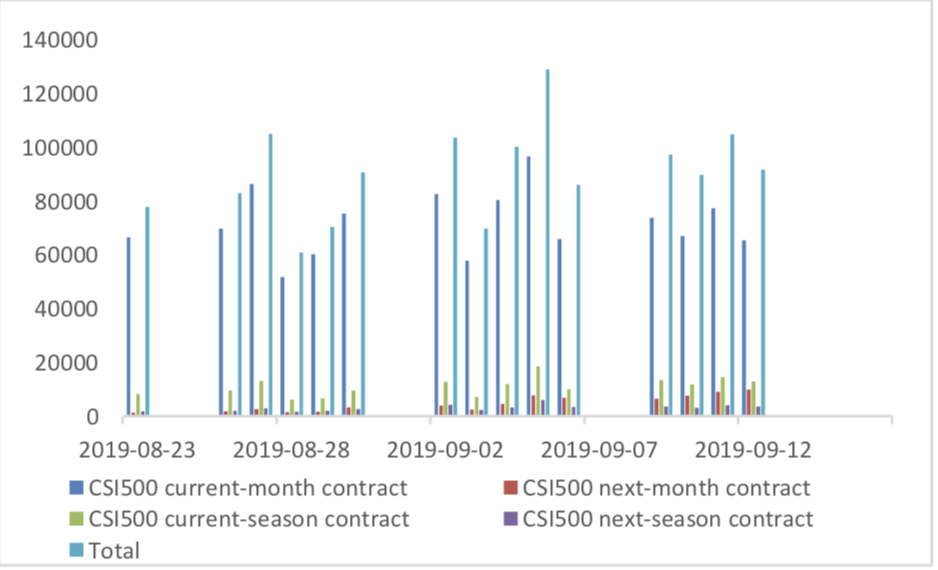
Graph 16: CSI500 Index futures’ open interests

(2) Roll Level Bid-Ask Distribution
There are 4 trading days during last week, so the distribution is worked out with 28804 data points for each contract pair.
Graph 17: CSI300 Current/Next Month Contract Roll Spread Distribution (2s frequency)

Graph 18: SSE50 Current/Next Month Contract Roll Spread Distribution (2s frequency)

Graph 19: CSI500 Current/Next Month Contract Roll Spread Distribution (2s frequency)

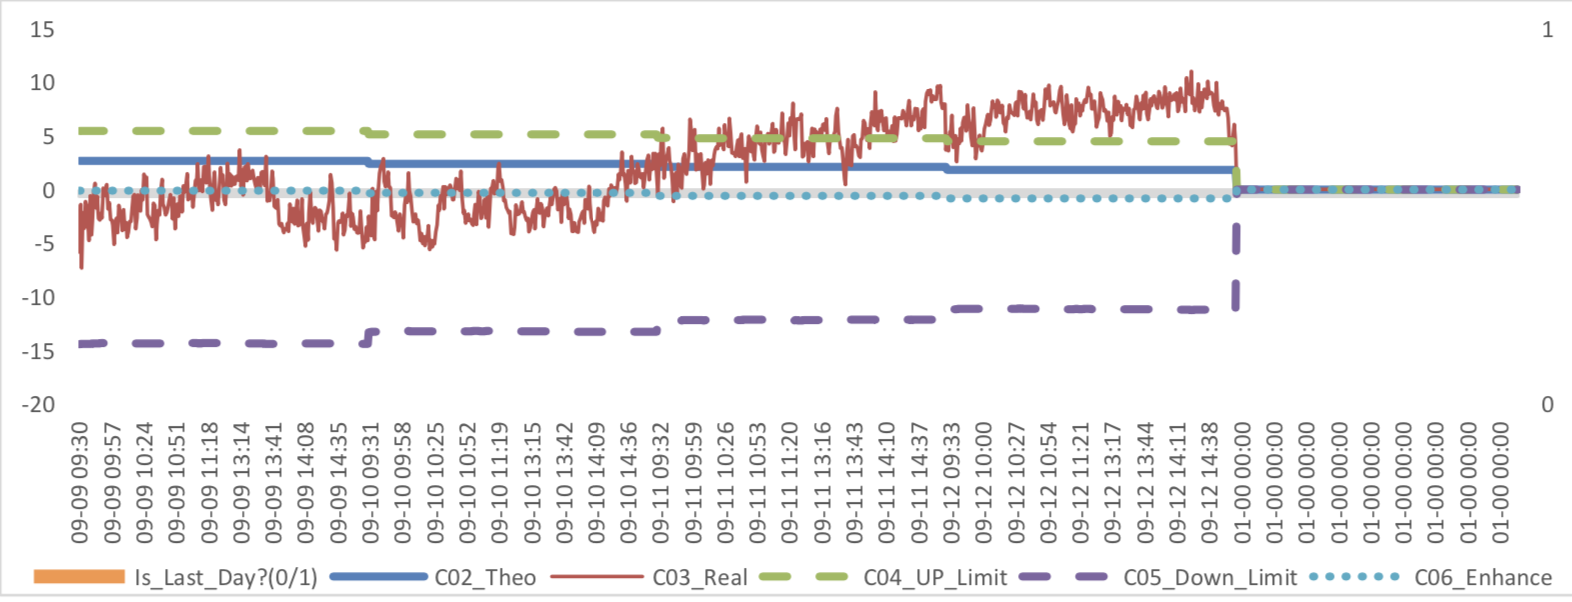
Assumption: risk-free rate: 3%; security borrowing cost: 8%; trading expense for spot: 0.025%; trading expense for futures: 0.005%; margin rates for futures contracts: 0.11 for CSI300 and SSE50, 0.13 for CSI500; margin rate for security borrowing: 0.3 (or 130% maintain rate).
When real price spread is out of theoretical range (calculated by our assumption), there exists absolute future-spot arbitrage opportunity.
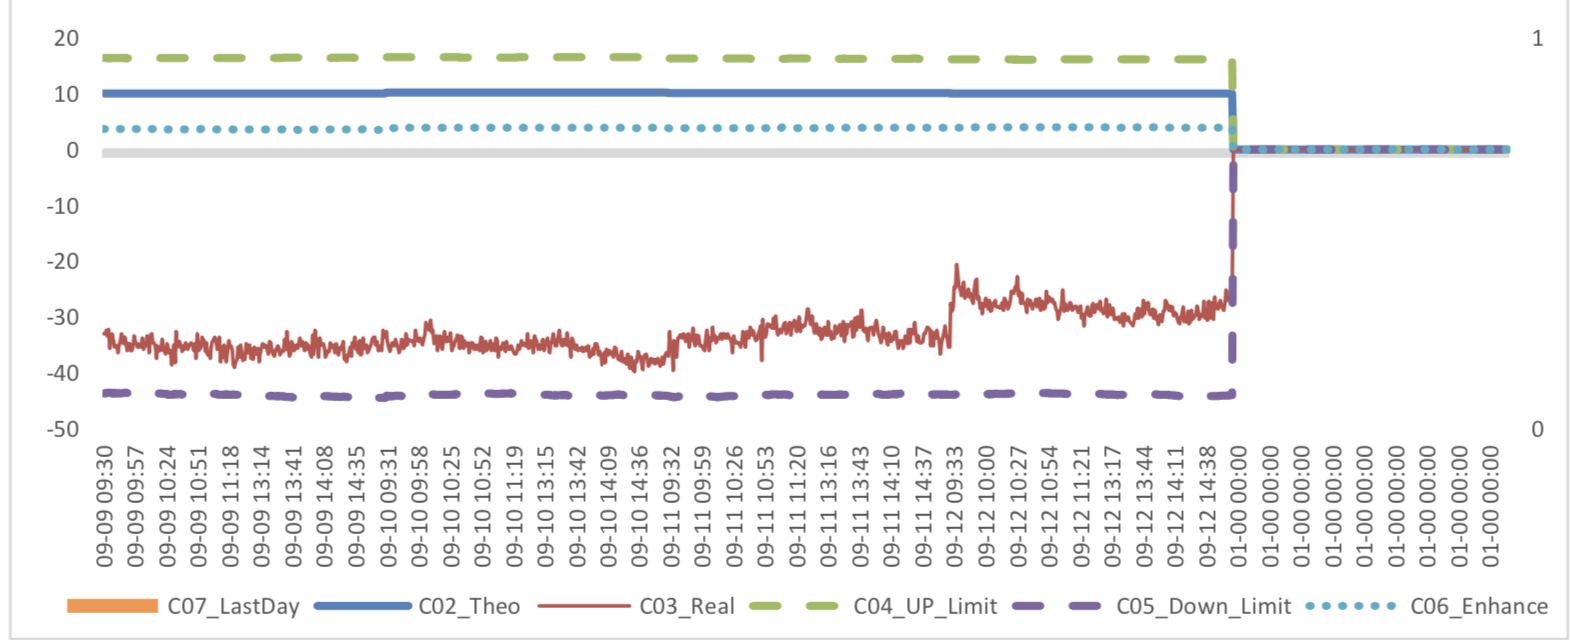
Graph 20: Future (Current Month)-Spot Arbitrage Opportunity for CSI300 contract (in the view of price difference)
Graph 21: Future (Current Month)-Spot Arbitrage Opportunity for SSE50 contract (in the view of price difference)

Graph 22: Future (Current Month)-Spot Arbitrage Opportunity for CSI500 contract (in the view of price difference)
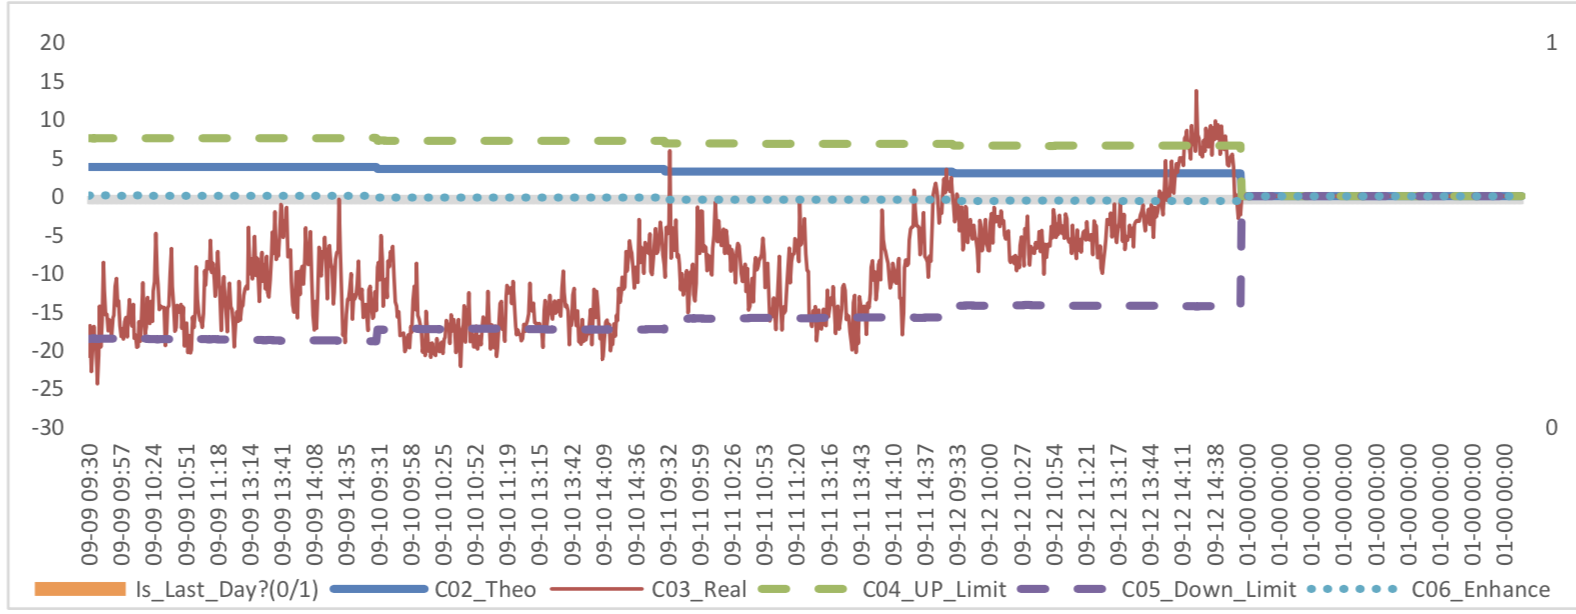
Graph 23: Future (Next Month-Current Month) Arbitrage Opportunity for CSI300 contract (in the view of price difference)

Graph 24: Future (Next Month-Current Month) Arbitrage Opportunity for SSE50 contract (in the view of price difference)
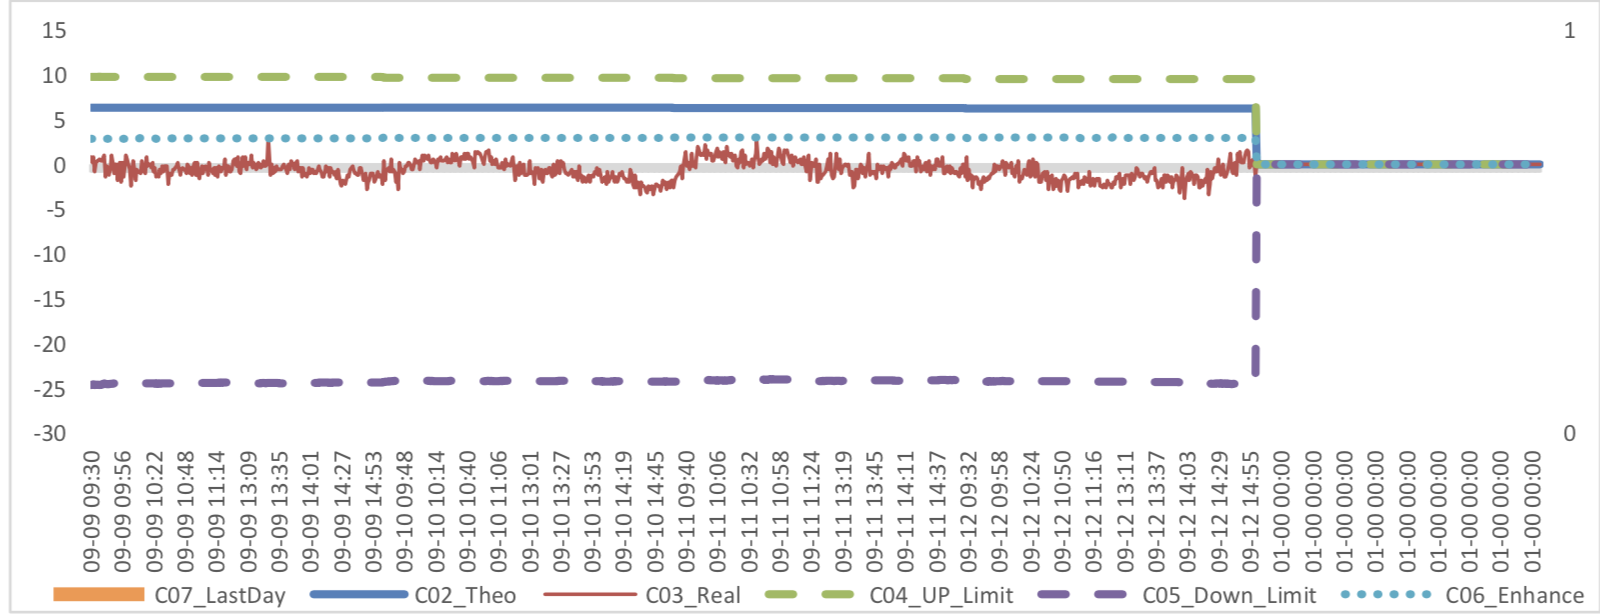
Graph 25: Future (Next Month-Current Month) Arbitrage Opportunity for CSI500 contract (in the view of price
difference)
(1) Interest Rates
The term structure of treasury bonds’ yields is currently upward sloping in concave shape.
Specifically, last week, short-term yields short term yield of Treasury bond experienced some fluctuation and 3M yield now at 2.4%-2.6% level. Furthermore, as for long-term yield, there is a small drop. 10Y yield is about 3.0%-3.2%.
Graph 26: Term Structure Evolvement of Treasury Bonds Yields During Recent 3 Months (%)

As for Shibor rates, short-term rates experienced significant fluctuation. Specifically, O/N rate experienced obvious fluctuation to 2.2%-2.4% level.
Graph 27: Term Structure Evolvement of Shibor Rates During Recent 3 Months (%)

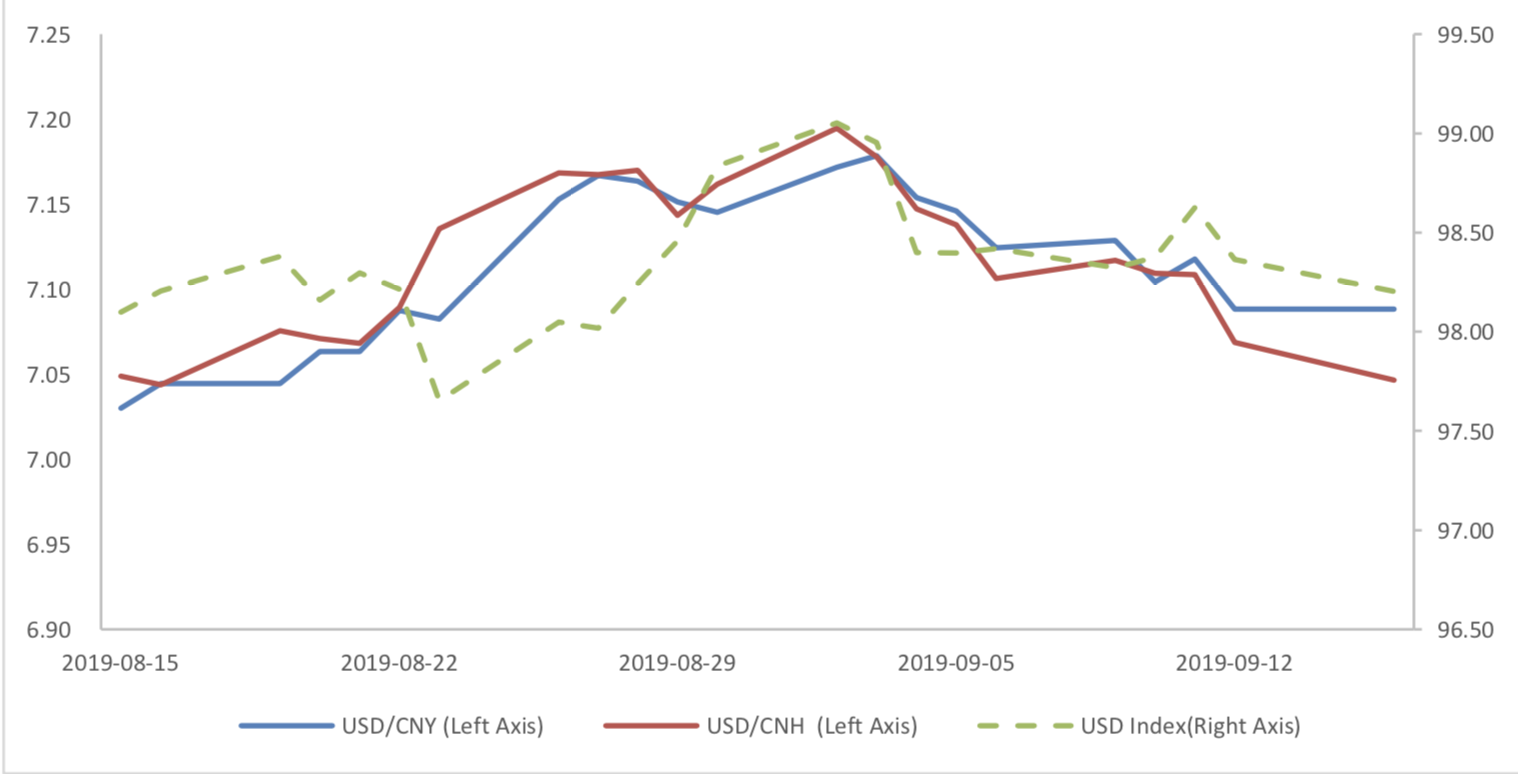
(2) ExchangeRates
During last week, CNY/USD changed -0.507% to 7.0882 and offshore rate, CNH/USD, changed - 0.84% to 7.0464 and USD index changed -0.22%.
Graph 28: USD/CNY, USD/CNH and USD Index
Macroeconomic Topic:
According to the released price data by the national bureau of statistics. The data showed that year-on- year CPI kept in high position. PPI is still in deflation region. The data showed that the year-on-year and ring ratio CPI were 2.8 percent and 0.7 percent, respectively, compared with pre value of 2.8 percent and 0.4 percent, respectively. Year-on-year and ring ratio PPI were -0.8 percent and-0.1 percent, respectively, compared with the previous figures of 0 percent and -0.3 percent, respectively.
August Price Data
(1) CPI Data
Graph A: CPI Data

CPI is mainly affected by the price of pork, and the core CPI is still stable, and there has been a certain decline for core CPI. The parties concerned and determined to control pig prices in a comprehensive way..
Graph B: year-on-year CPI: by Food, Non-Food, Core, Services, Consumer Goods (%)

Residence, education, culture and entertainment, healthcare, household goods and service prices rose slightly, with growth rates of 1%, 2.1%, 2.3% and 0.7% respectively. Transportation and communication dropped 2.3%
Graph C: year-on-year CPI: by Food Alcohol and Tobacco, Clothing, Residence, Household Goods & Services, Transportation & Communications, Education, Culture & Entertainment, Healthcare (%)

(2) PPI Data
Graph D: PPI Data (%)

The means of production PPI was -1.3 percent year-on-year, decreased 0.6 percentage point from the previous month. The means of livelihoods PPI, was 0.7 percent, compared with the previous value of 0.8 percent. The mining industry, raw material industry and processing industry increased by 4.2%, - 0.6% and 0.4% respectively. From the perspective of the three major industries of production data, the declining trend of raw material industry and processing industry in the middle and lower reaches is relatively obvious, while the mining industry, despite the decline in oil prices, has a strong price of iron ore and other industries, and the declining trend is relatively moderate.
Graph E: PPI Data, by means of production and means of livelihoods

(3) Summary
CPI and PPI have some differentiation. CPI is mainly affected by the price of pork. Without the price of pork, CPI could also show trend of deflation. To deal with the pork price, the government will take measures to support the production chain. Without considering pork, the economy obviously show downward pressure, more counter-cycle measure is necessary.
Copyright by fangquant.com
Currently no Comments.
Hot Topics
The 13rd China International Future Forum
The Shanghai Derivatives Energy Forum has received extensive attention from relevant industries both within and outside the borders.
Financial institutions deep explore commodity market opportunities, commodity index financial products show full-scale trend
R-Code for analysis: getKDJ
R-Code@June 06, 2016
New indicator to analyze the arbitrage opportunities between sse50 and csi500
Market review: January 11, 2017
The Great China Bubble: Anniversary Lessons and Outlook
Quant Investment in China A-share market
The hedge strategy between SSE50 and A50--Jan 13,2017
The arbitraging strategy between CSI300 and SSE50
Market review: June 17, 2016
Sleepless in London--Enda Homan(Allied Irish Banks Plc)
MSCI Rebuffs Chinese Equities for Third Time in Blow to Xi
Soros, Druckenmiller among hedgies profiting in market plunge