FangQuant › Financial Futures
Market Summary:
Last week, there was generally decrease over the market. SSE Composite Index (000001.SH) changed -0.82 % to 3006.45. Specifically, small cap shares perform slightly better than large cap shares and we can observe that CSI500 did better than SSE50 (-0.73% vs -1.2%). The trading activity decrease as the average daily turnover dropped to 527.88 billion RMB, an decrease of 16.84%
The market environment is beneficial for improving risk preference. Liquidity environment tend to ease. The Feds September interest rate meeting decided to cut interest rates by another 25 bps, in line with market expectations. However, the internal divergence of the Federal Reserve has increased. Three voting committees have vetoed the interest rate cut. The dot matrix shows that 17 members also have great divergence on the interest rate path in 2019 and 2020. In China, LPR 1Y rate dropped 0.05% to 4.2%. Trade confliction shows sign of alleviation. with the previous tax rate put off, On September 17, the official website of the U.S. Office of Trade Representatives published three lists of exceptions to tariff imposed on China.
As for arbitrage opportunity, all futures current-month contracts show some room for arbitrage opportunities. No price spread for next-month/current month contracts show room for arbitrage.
News:
(1) Sina: Guo Kai, member of CF40 and deputy director of the Monetary Policy Department of the Central Bank, made suggestions on the internationalization of RMB in the "Jingshan Report 2019". When Shanghai becomes an international financial center, it must be the center of RMB, not other currencies. The construction of Shanghai International Financial Center should focus on the allocation of RMB financial assets and risk management. We will make further efforts to consolidate the status of Shanghai as a global business center and promote the internationalization of RMB.
(2) China Securities Daily: EPFR: In the week ending September 18 (September 12-September 18), global equity funds performed well, attracting net inflows of $19.2 billion, the largest one-week net inflows since the end of the first quarter of 2018, of which the net inflows of U.S. equity funds reached 26 weeks. At a high level, emerging market equity funds ended the previous 21 weeks of net outflows and turned to "net suction".
(3) Sina: Li Daokui, founding dean of the Institute of Chinese Economic Thought and Practice of Tsinghua University, believes that China will become the largest economy in the world, and enter the ranks of high- income countries around 2025, reaching the average level of high-income countries in 2049; the modern market economic system with Chinese characteristics will gradually take shape, with the western market economic system. We can learn from each other and complement each other. The middle-income group will double in the next 15 years, and its scale will increase from 400 million to 800 million.
(4) Xinhua News Agency: The United States announced three tariff exclusion lists to take another step in the opposite direction. On September 17, the official website of the U.S. Office of Trade Representatives published three lists of exceptions to tariff imposed on China.
(5) Surging News: Li Xiaoga talked about the rejection of the Harbour Exchange and the Purchasing Land Exchange: We are a little late, we should continue to work hard; we believe that once these two big markets merge together, the strategic effect is huge, which is the strategic significance of generations.
(6) Shanghai Securities Daily: Since this year, the total assets of the central bank have decreased by 120 billion yuan. Is it the central bank's "abbreviation"? The analysis shows that because of the difference of balance sheet structure and monetary policy operation mode, we can not simply analogize the shrinkage or expansion of the balance sheet of the Central Bank of China to that of the Federal Reserve, and then think that monetary policy is changing.
1. StockMarket
(1) Indices Performance
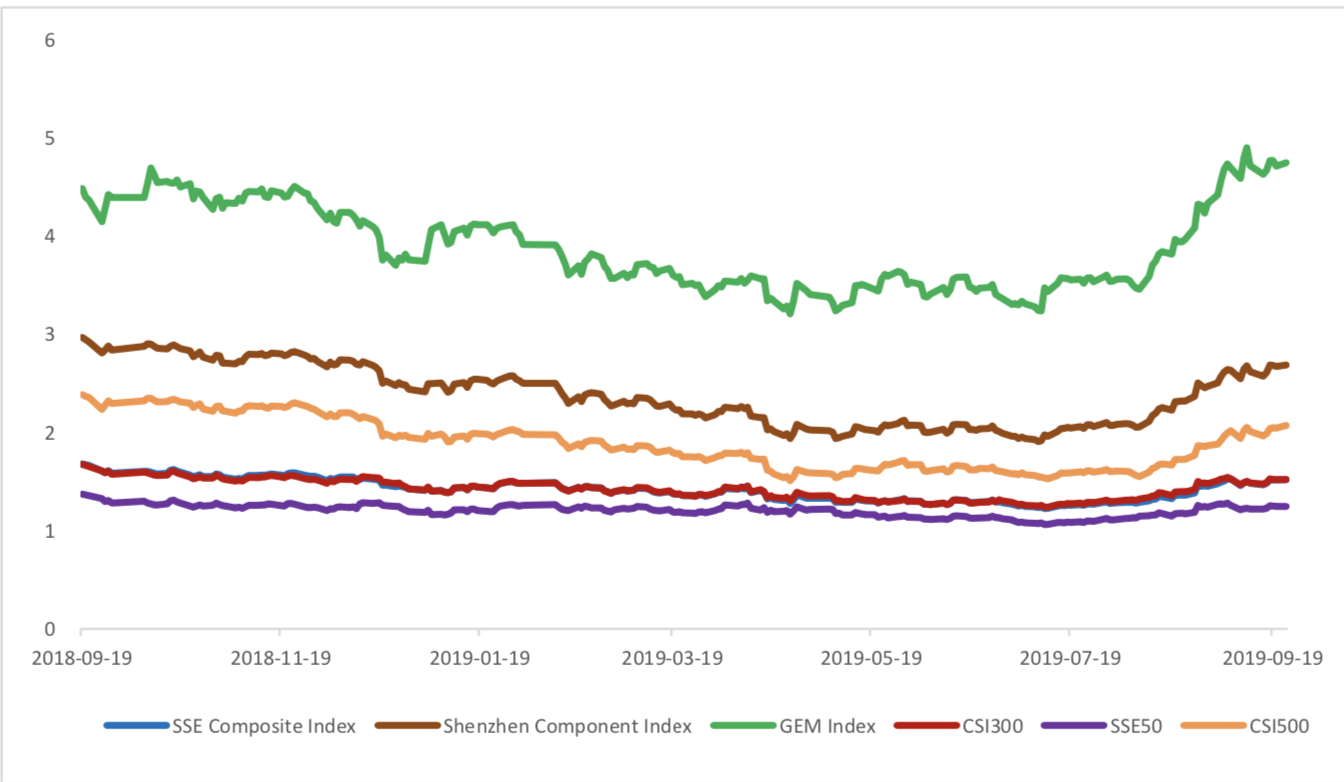
During last week, SSE Composite Index (000001.SH) changed -0.82 % to 3006.45, SHENZHEN COMPONENT INDEX (399001.SZ) changed -0.39 % to 9881.25, ChiNext PRICE INDEX (399006.SZ) changed -0.32 % to 1705.05, CSI 300 INDEX (000300.SH) changed -0.92 % to 3935.65, CSI SmallCap 500 index (000905.SH) changed -0.73 % to 5204.48, SSE 50 Index (000016.SH) changed -1.20 % to 2963.43.
Graph 1: Indices Performance over past 3 months

The average daily turnover of the whole market during past 5 trading days is 527.88 billion CNY, it decreased 16.84% compared with the previous 5-trading day period.
Graph 2: Market turnover

In the view of sectors, during last week (from 2019-09-13 to 2019-09-20), 8 of 24 Wind Level-2 sector(s) increased while 16 sector(s) dropped. Specifically, Semiconductors & Semiconductor Equipment (3.01%), Food, Beverage & Tobacco(1.94%) and Technology Hardware & Equipment(1.57%)
did the best performance while Diversified Financials(-4.68%), and Insurance (-2.90%) did the worst performance.
Graph 3: Sectors performance under Wind Level-2 classification (%)

(3) Indices Valuation (TTM)
The current PE for SSE Composite Index, Shenzhen Component Index, GEM Index, CSI300, SSE50, CSI500 are 13.2270, 24.5779, 55.1688, 12.2450, 9.7326, 25.5859respectively; and these indices are at 25.60%, 36.40%, 68.10%, 35.20%, 32.70%, 23.30% percent rank level of their historic data, respectively
Graph 4: PE of 6 indices

Graph 5: PE percent rank of 6 indices (calculated by data of past 1200 trading days, only 1Y data is presented on the graph)

The current PB for SSE Composite Index, Shenzhen Component Index, GEM Index, CSI300, SSE50, CSI500 are 1.5185,2.6827,4.7397,1.5190,1.2443, 2.0682respectively, and these indices are at 32.10%, 30.10%, 38.60%, 52.20%, 55.70%, 15.30% percent rank level of their historic data, respectively.
Graph 6: PB of 6 indices
Graph 7: PB percent rank of 6 indices (calculated by data of past 1200 trading days, only 1Y data is presented on the graph)

(4) Foreign Fund Flow
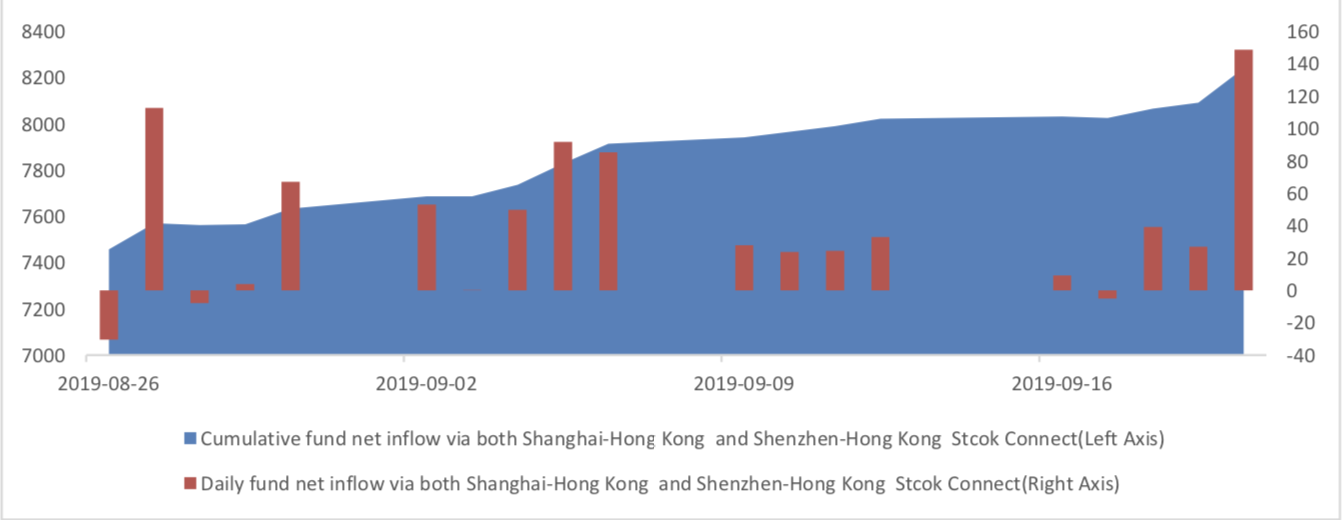
Last week, there were 5 trading days for northward channel open for stock connect programs. During last week the total foreign fund flow via Stock Connect is 21.87 billion RMB, and the cumulative inflows was 824.10 billion RMB. Specifically, the fund flow via Shanghai-Hong Kong Stock Connect is 9.68 billion RMB and the fund flow via Shenzhen-Hong Kong Stock Connect is 12.19 billion RMB.
Graph 8: Fund flow via both Shanghai and Shenzhen-Hong Kong Stock Connect in past 1M (100 million CNY)
Graph 9: Fund flow via Shenzhen-Hong Kong Stock Connect in past 1M (100 million CNY)

Graph 10: Fund flow via both Shanghai-Hong Kong Stock Connect in past 1M (100 million CNY)

2. Index Futures
(1) Trading Volume and Open Interests
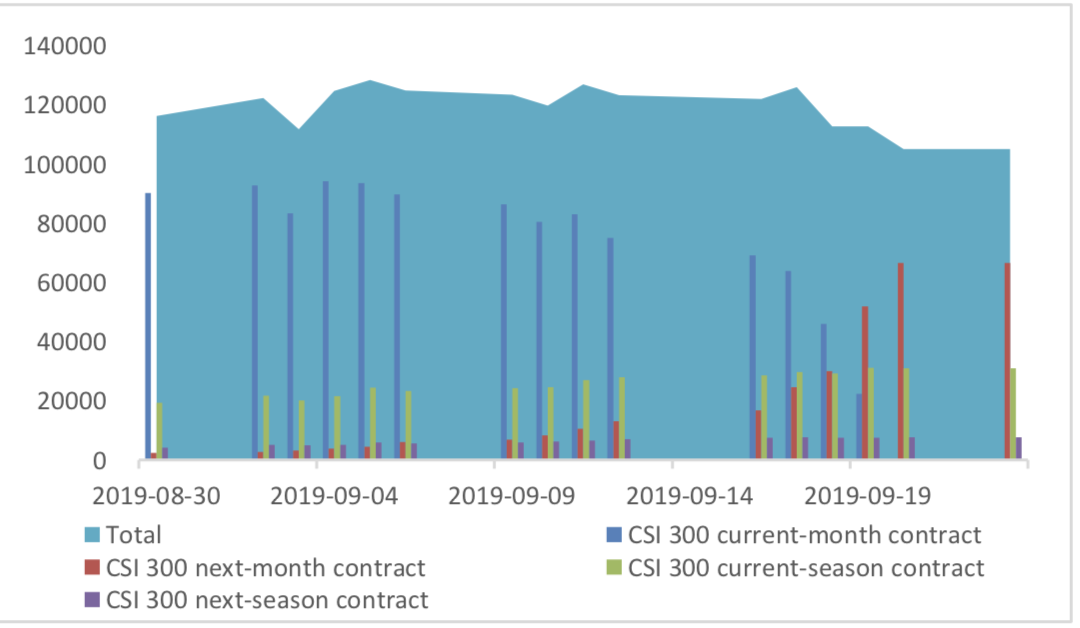
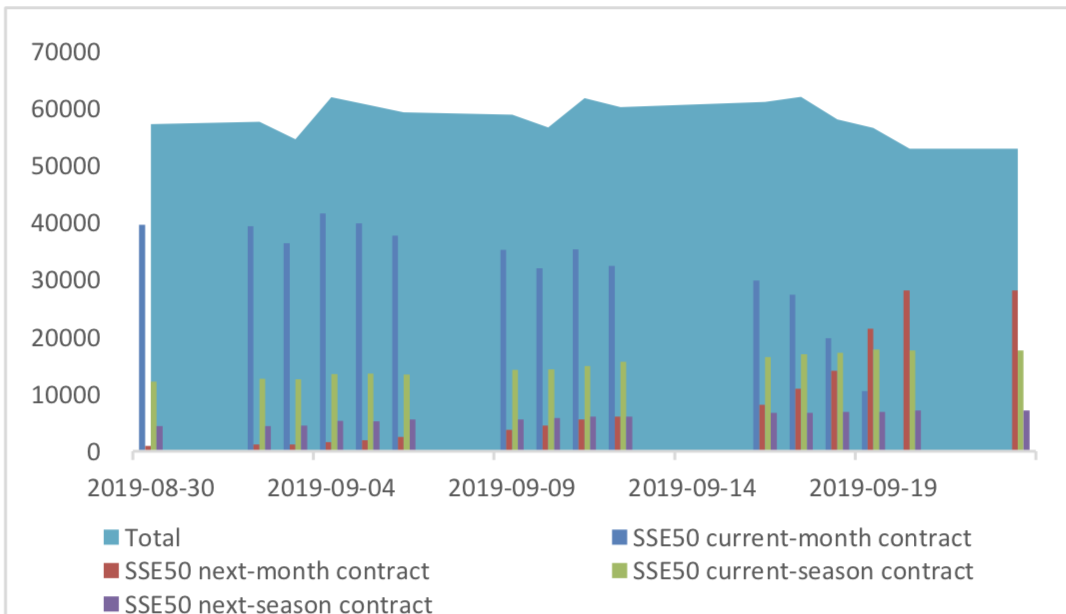
During past 5 trading days the average trading volume for CSI300(IF), SSE50(IH), CSI500(IC) contracts
are 76230 (-16.71%, the previous 5-trading day period),30548 (-13.62%),80244 (-17.29%) lots, respectively. On the last trading day, the total open interests for them are 105142 (-13.82%),52886 (-13.51%),144177 (- 10.66%) lots respectively.
Graph 11: CSI300 Index futures’ trading volume

Graph 12: CSI300 Index futures’ open interests
Graph 13:SSE50 Index futures’ trading volume

Graph 14: SSE50 Index futures’ open interests
Graph 15: CSI500 Index futures’ trading volume

Graph 16: CSI500 Index futures’ open interests

(2) Roll Level Bid-Ask Distribution
There are 5 trading days during last week, so the distribution is worked out with 36005 data points for each contract pair.
Graph 17: CSI300 Current/Next Month Contract Roll Spread Distribution (2s frequency)
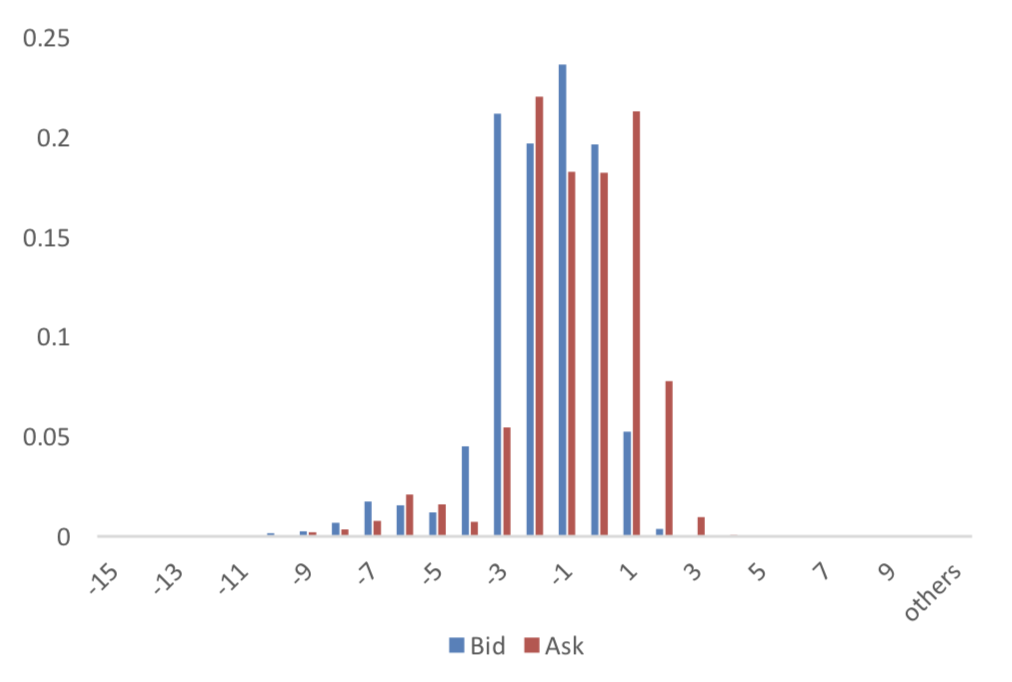
Graph 18: SSE50 Current/Next Month Contract Roll Spread Distribution (2s frequency)

Graph 19: CSI500 Current/Next Month Contract Roll Spread Distribution (2s frequency)

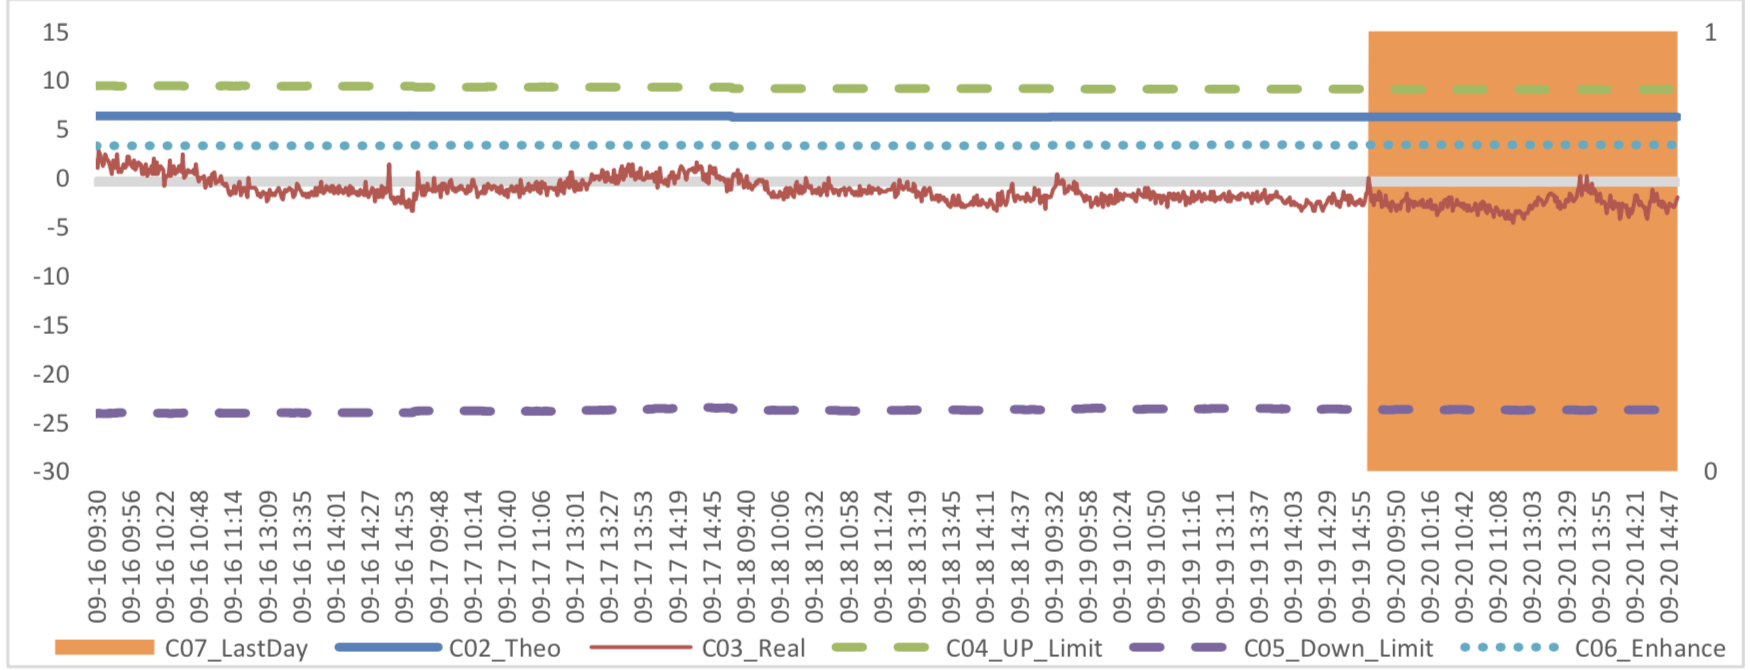
Assumption: risk-free rate: 3%; security borrowing cost: 8%; trading expense for spot: 0.025%; trading expense for futures: 0.005%; margin rates for futures contracts: 0.11 for CSI300 and SSE50, 0.13 for CSI500; margin rate for security borrowing: 0.3 (or 130% maintain rate).
When real price spread is out of theoretical range (calculated by our assumption), there exists absolute future-spot arbitrage opportunity.
Graph 20: Future (Current Month)-Spot Arbitrage Opportunity for CSI300 contract (in the view of price difference)

Graph 21: Future (Current Month)-Spot Arbitrage Opportunity for SSE50 contract (in the view of price difference)

Graph 22: Future (Current Month)-Spot Arbitrage Opportunity for CSI500 contract (in the view of price difference)

Graph 23: Future (Next Month-Current Month) Arbitrage Opportunity for CSI300 contract (in the view of price difference)

Graph 24: Future (Next Month-Current Month) Arbitrage Opportunity for SSE50 contract (in the view of price difference)
Graph 25: Future (Next Month-Current Month) Arbitrage Opportunity for CSI500 contract (in the view of price
difference)

3. Financial Markets
(1) InterestRates
The term structure of treasury bonds’ yields is currently upward sloping in concave shape.
Specifically, last week, short-term yields short term yield of Treasury bond experienced some fluctuation and 3M yield now at 2.0%-2.4% level. Furthermore, as for long-term yield, there is a small drop. 10Y yield is about 3.0%-3.2%.
Graph 26: Term Structure Evolvement of Treasury Bonds Yields During Recent 3 Months (%)

As for Shibor rates, short-term rates experienced significant fluctuation. Specifically, O/N rate experienced obvious fluctuation to 2.6%-2.8% level.
Graph 27: Term Structure Evolvement of Shibor Rates During Recent 3 Months (%)

(2) ExchangeRates
During last week, CNY/USD changed 0.369% to 7.0901 and offshore rate, CNH/USD, changed 0.83% to 7.1205 and USD index changed -0.16%.
Graph 28: USD/CNY, USD/CNH and USD Index

Macroeconomic Topic:
The data show that, after dropping in August, the scale of new social financing rebound to 1977 billion yuan, with pre-value of 1002 billion. Meanwhile, M1 and M2 increased by 3.4% and 8.2% respectively, both increased, and the scissors difference between M1 and M2 shrink.
August Finance Data
(1) Social Financing Data
Graph A: Total Social Financing Data(100m RMB)

In on-balance-sheet financing, in terms of RMB loans, 1304.5 billion yuan was added in August, rose from 808.6 billion yuan from last month, and also above than value, 1279 billion, at the same period of last year. New RMB loans accounted for 66% of the new social financing scale.
Graph B: On-balance-sheet Financing Data(100m RMB)

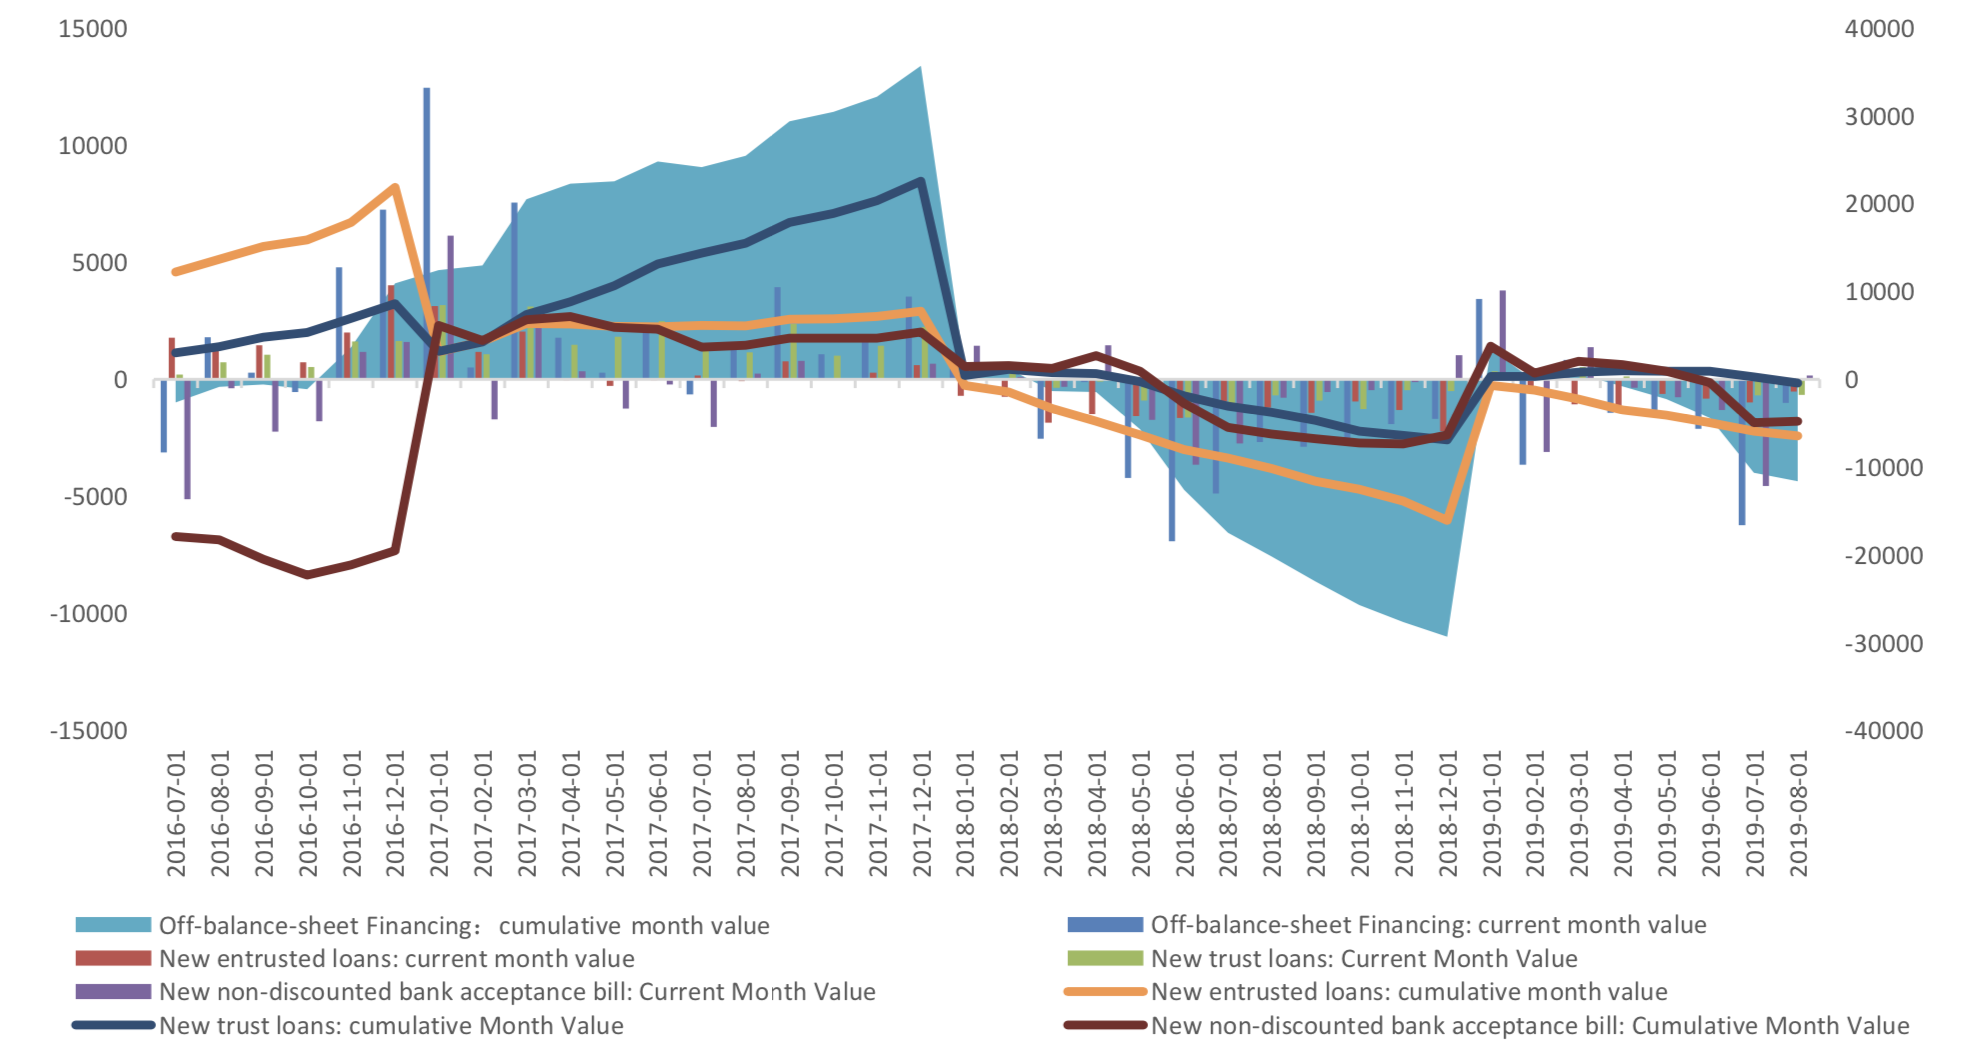
From the perspective of new off-balance sheet financing, it faced an obvious contraction in August. In August, trust loan business decreased by -65.8 billion yuan, entrusted loans decreased by 51.3 billion yuan, the business of acceptance of non-discounted bills rose by 15.7 billion yuan.
Graph C: Off-balance-sheet Financing Data(100m RMB)
In terms of the direct financing, the direct financing of enterprises was 329.7 billion yuan, less compared with the same period last year, but with the ring ratio increased substantially, mainly because of the increase in corporate bond financing, reaching 304 billion yuan, rose40.4% in ring ratio. This year we saw obvious rose in direct financing.
Graph D: Direct Financing Data(100m RMB)

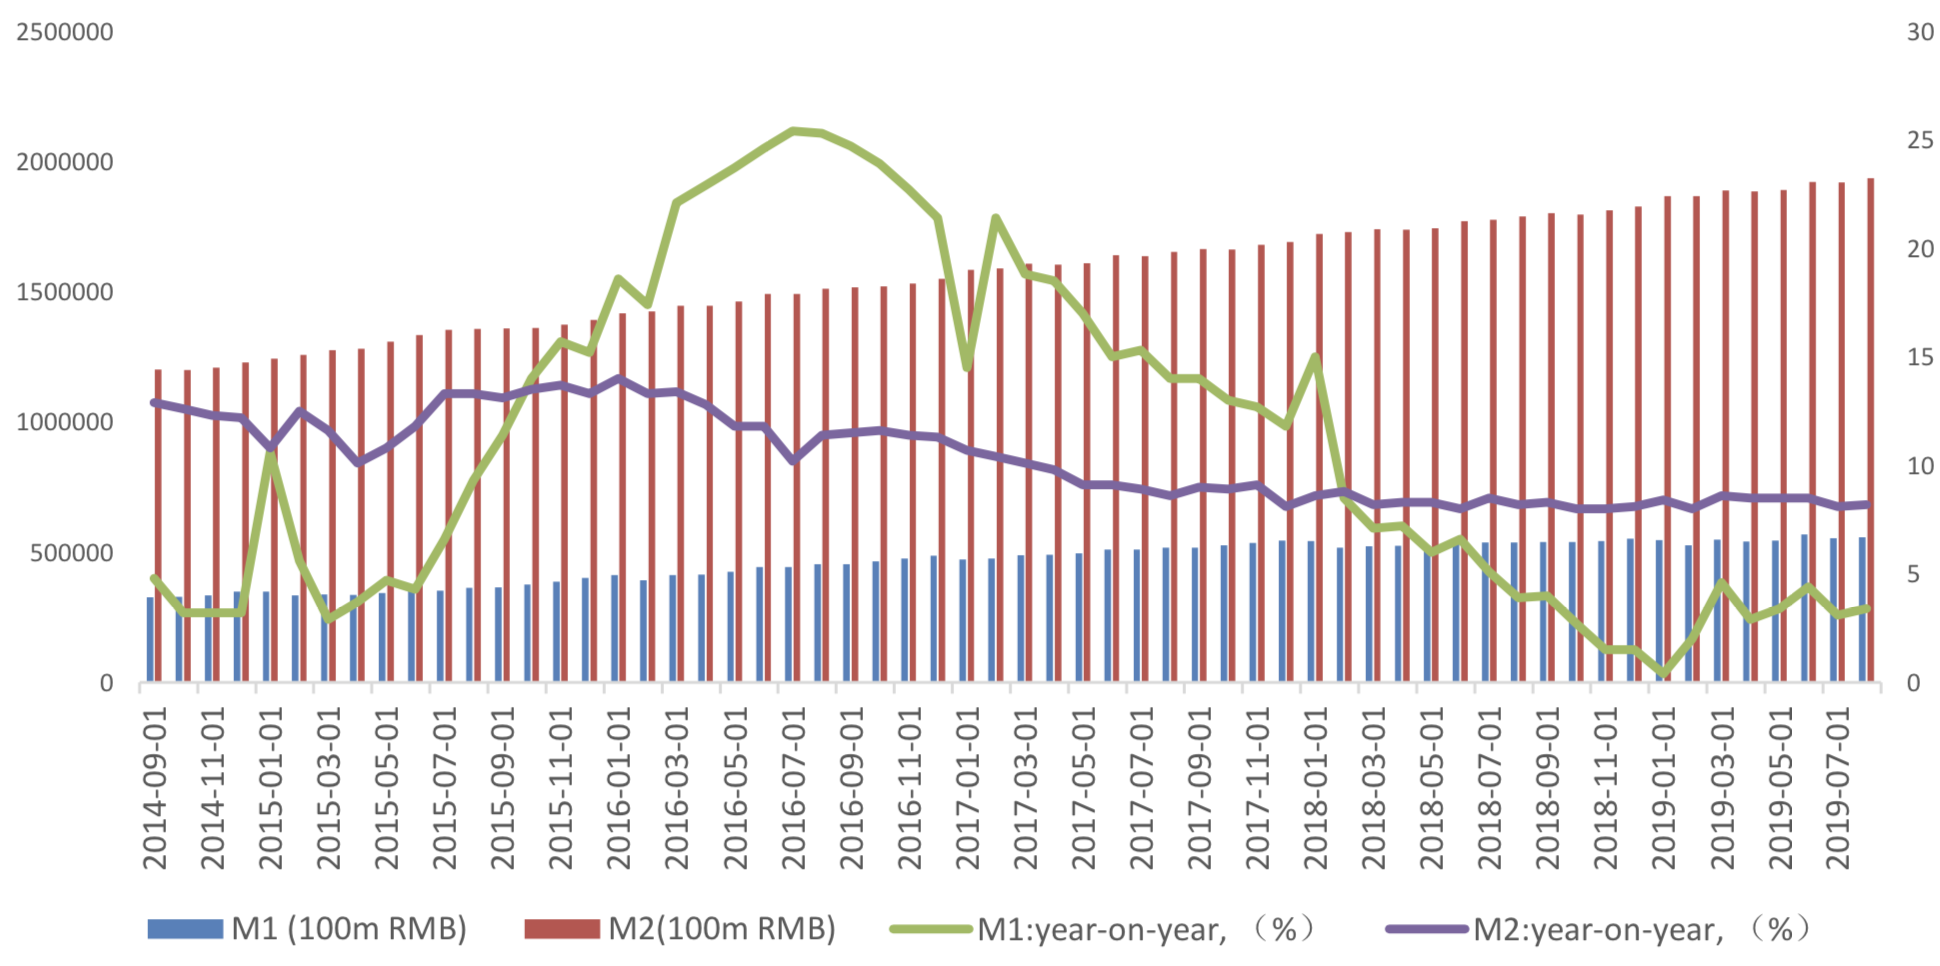
(2) Monetary Data
In August, M2 rose from 8.1 to 8.2%, and M1 rose from 3.1% to 3.4%, and the difference between M2 and M1 decrease from 5.0% to 4.8%.
Graph E: M1 and M2 data
Currently no Comments.
Hot Topics
The 13rd China International Future Forum
The Shanghai Derivatives Energy Forum has received extensive attention from relevant industries both within and outside the borders.
Financial institutions deep explore commodity market opportunities, commodity index financial products show full-scale trend
R-Code for analysis: getKDJ
R-Code@June 06, 2016
New indicator to analyze the arbitrage opportunities between sse50 and csi500
Market review: January 11, 2017
The Great China Bubble: Anniversary Lessons and Outlook
Quant Investment in China A-share market
The hedge strategy between SSE50 and A50--Jan 13,2017
The arbitraging strategy between CSI300 and SSE50
Market review: June 17, 2016
Sleepless in London--Enda Homan(Allied Irish Banks Plc)
MSCI Rebuffs Chinese Equities for Third Time in Blow to Xi
Soros, Druckenmiller among hedgies profiting in market plunge