FangQuant › Financial Futures
Market Summary:
Last week, there was generally decrease over the market. SSE Composite Index (000001.SH) changed -2.47 % to 2932.17. Specifically, large cap shares perform slightly better than small cap shares and we can observe that SSE50 did better than CSI500 (-1.15% vs -3.82%). The trading activity decrease as the average daily turnover dropped to 503.51 billion RMB, a decrease of 6.51%
As close to National holidays, the trading activity shrank obviously during last Friday, it may also in low activity during this Monday, the only trading day over this week.
Looking forward to the October, according to the Ministry of Commerce, China and the United States will face the 13th round of trade talks in October. Meanwhile, the Office of the United States Trade Representative announced the postponement of tariff increases until October 15, when the progress of the negotiations and whether tariff landings will affect the tone of the follow-up policy. With the goodwill released by US side, it is possible to reach a result that can somewhat alleviate the market worrying (but may not fully resolve the confliction).
As for arbitrage opportunity, CSI500 futures current-month contracts show some room for arbitrage opportunities. No price spread for next-month/current month contracts show room for arbitrage.
News:
(1) Wind: Zhong Shan, Minister of Commerce, said in the People's Daily article that as we embark on the long march towards a new era, we should thoroughly implement the new development concept, promote high-quality business development and better meet the growing needs of the people for a better life. Build a strong domestic market. Give full play to the huge advantages of the large market with a population of nearly 1.4 billion, tap the consumption potential and enhance the ability to participate in international competition. Promoting a higher level of openness. More attention should be paid to institutional openness, such as rules, to promote the formation of a new pattern of comprehensive openness. Deepening global open cooperation. We should adhere to the principle of building and sharing through consultation, expand the intersection of interests with other countries and promote common development.
(2) Ministry of Commerce: From January to August, China's total trade in services reached 3572.08 billion yuan, an increase of 3% over the same period last year; among them, exports reached 1264.56 billion yuan, an increase of 9.7%; imports reached 2307.52 billion yuan, a decrease of 0.3%; service exports increased further, service trade deficit decreased, and knowledge-intensive service trade performed prominently.
(3) Shanghai Stock Exchange: The construction of the next generation core trading system will advance steadily around the goal of continuously improving the level of safe operation, effectively supporting business development and continuously optimizing market access.
(4) Xinhua News Agency: Hu Chunhua, member of the Political Bureau of the CPC Central Committee and Vice Premier of the State Council, recently supervised the production and supply of live pigs in Shandong, Hebei and Henan. He emphasized that the spirit of General Secretary Xi Jinping's important instructions should be thoroughly implemented, the decision-making and deployment of the Party Central Committee and the State Council should be implemented, the policies should be actively promoted to achieve results, the production of live pigs should be stabilized and restored, and the market supply should be guaranteed to be stable.
(5) Wind: Twenty-one ministries such as the Development and Reform Commission issued the Outline of Action for Promoting High-quality Development of Health Industries (2019-2022). It was proposed that by 2022, a health industry system with rich connotations and reasonable structure should be basically formed. The outline puts forward 10 major projects around key areas and key links, including: quality medical and health resources expansion project, "Internet + medical health" upgrading project, Chinese medicine health service upgrading project, health service cross boundary fusion project, health industry science and technology innovation project, and health insurance development deepening project. Health industry agglomeration development project, health industry talent promotion project, health industry business environment optimization project, health industry comprehensive supervision project.
(6) Securities Times: Shanghai Stock Exchange: We will firmly grasp the development opportunities, actively realize the interconnection with more overseas capital markets, facilitate cross-border investment by domestic and foreign investors, promote win-win economic and financial cooperation among countries, push China's capital market reform and opening up to a deeper level and open a new chapter in the process of internationalization.
(7) Wind: The Finance Committee of the State Council held its eighth meeting to study deepening the reform of the financial system and enhancing the economic capacity of financial service entities. The meeting pointed out that China's economy is running smoothly on the whole, the momentum of growth is speeding up, and financial risks tend to converge. The financial system should continue to implement sound monetary policy, strengthen counter-cyclical regulation, maintain reasonable liquidity and reasonable growth of social financing scale. We should further deepen the reform of policy-oriented financial institutions, improve the governance system and incentive mechanism, follow the operating rules of financial institutions, and play a good counter-cyclical role in the economic transformation and upgrading and high-quality development of policy-oriented financial institutions. We should speed up the construction of a long-term mechanism for capital replenishment of commercial banks, enrich the sources of capital for bank replenishment, and further dredge the transmission channels of financial system liquidity to the real economy. Focus on supporting small and medium-sized banks to replenish capital, combining capital replenishment with improving corporate governance and internal management, effectively guiding small and medium-sized banks to take a heavy heart and serve the local, and supporting private and small and medium-sized enterprises. We should further expand the high-level two-way opening of the financial sector and encourage foreign financial institutions and funds to enter the domestic financial market..
1. StockMarket
(1) Indices Performance
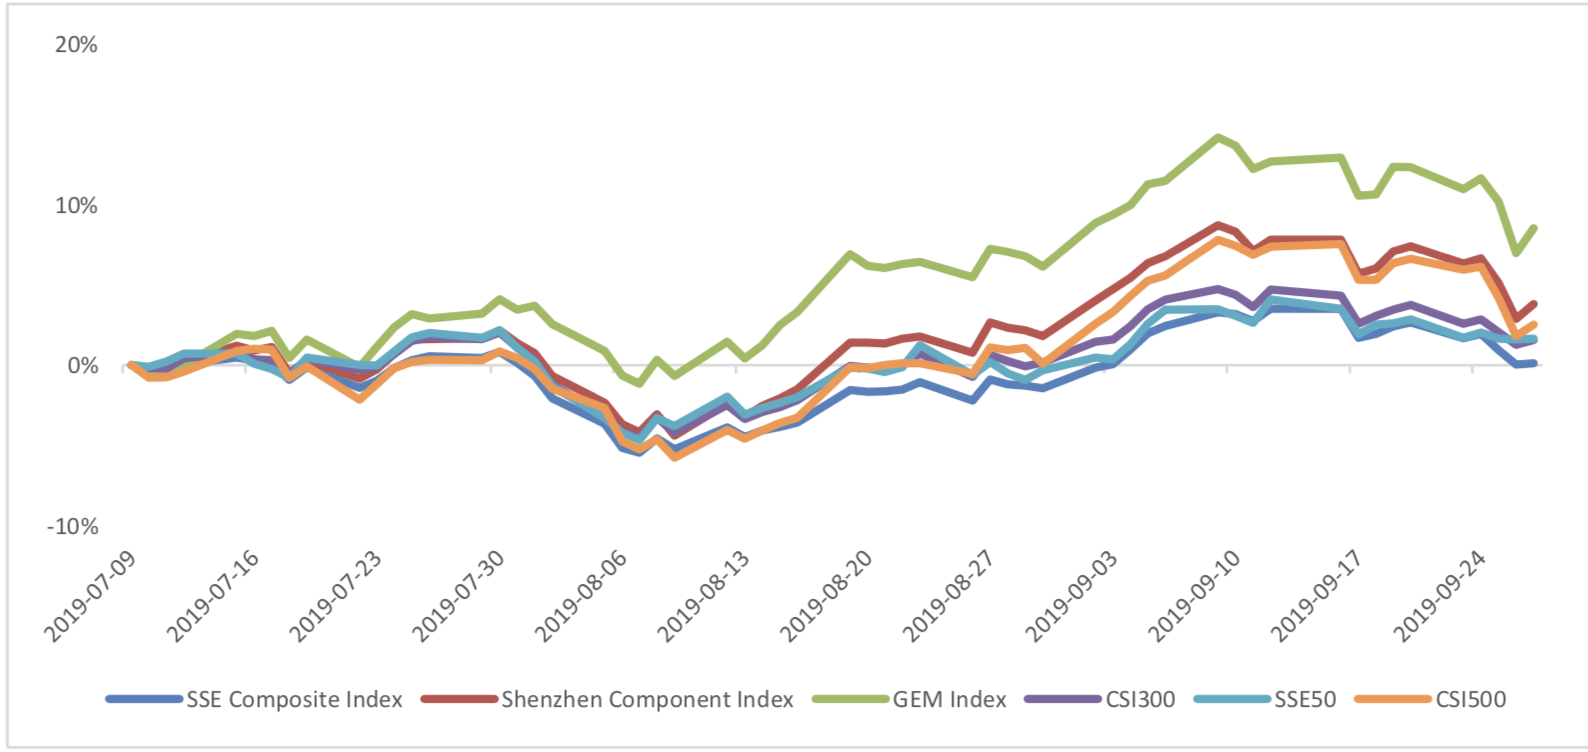
During last week, SSE Composite Index (000001.SH) changed -2.47 % to 2932.17, SHENZHEN COMPONENT INDEX (399001.SZ) changed -3.36 % to 9548.96, ChiNext PRICE INDEX (399006.SZ) changed -3.37 % to 1647.53, CSI 300 INDEX (000300.SH) changed -2.11 % to 3852.65, CSI SmallCap 500 index (000905.SH) changed -3.82 % to 5005.63, SSE 50 Index (000016.SH) changed -1.15 % to 2929.47.
Graph 1: Indices Performance over past 3 months
The average daily turnover of the whole market during past 5 trading days is 503.51 billion CNY, it decreased 6.51% compared with the previous 5-trading day period.
Graph 2: Market turnover

(2) Sectors Performance
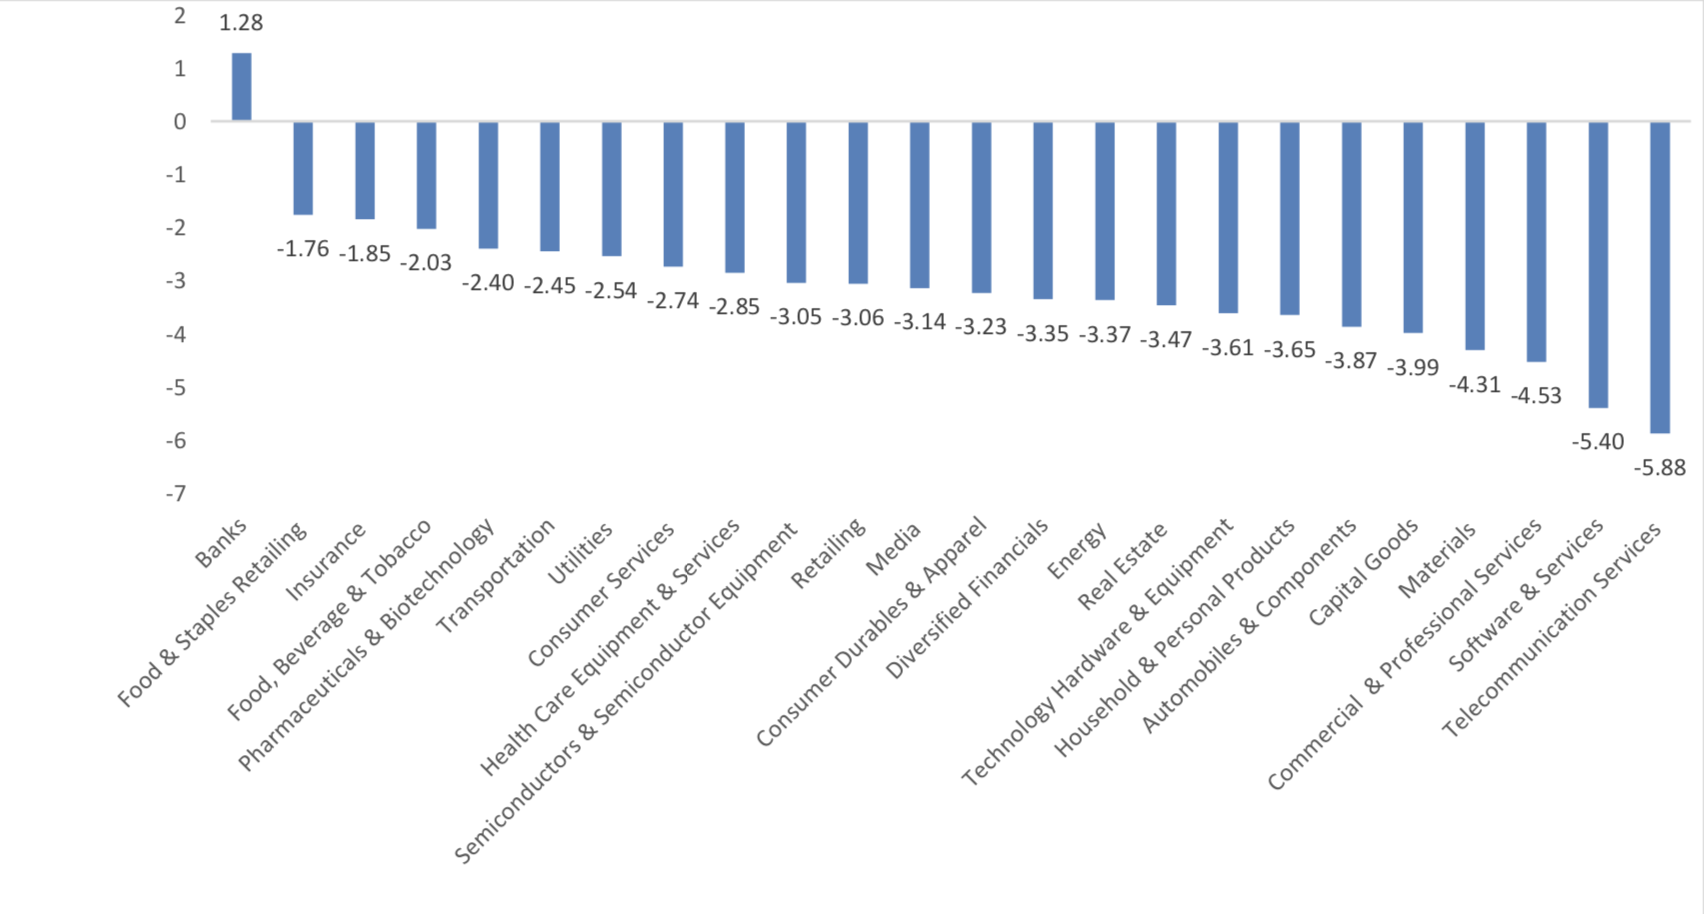
In the view of sectors, during last week (from 2019-09-20 to 2019-09-27), 1 of 24 Wind Level-2 sector(s) increased while 23 sector(s) dropped. Specifically, Banks(1.28%), Food & Staples Retailing (- 1.76%) and Insurance (-1.85%) did the best performance while Telecommunication Services (-5.88%),
Software & Services(-5.40%) and Commercial & Professional Services(-4.53%) did the worst performance.
Graph 3: Sectors performance under Wind Level-2 classification (%)
(3) Indices Valuation (TTM)
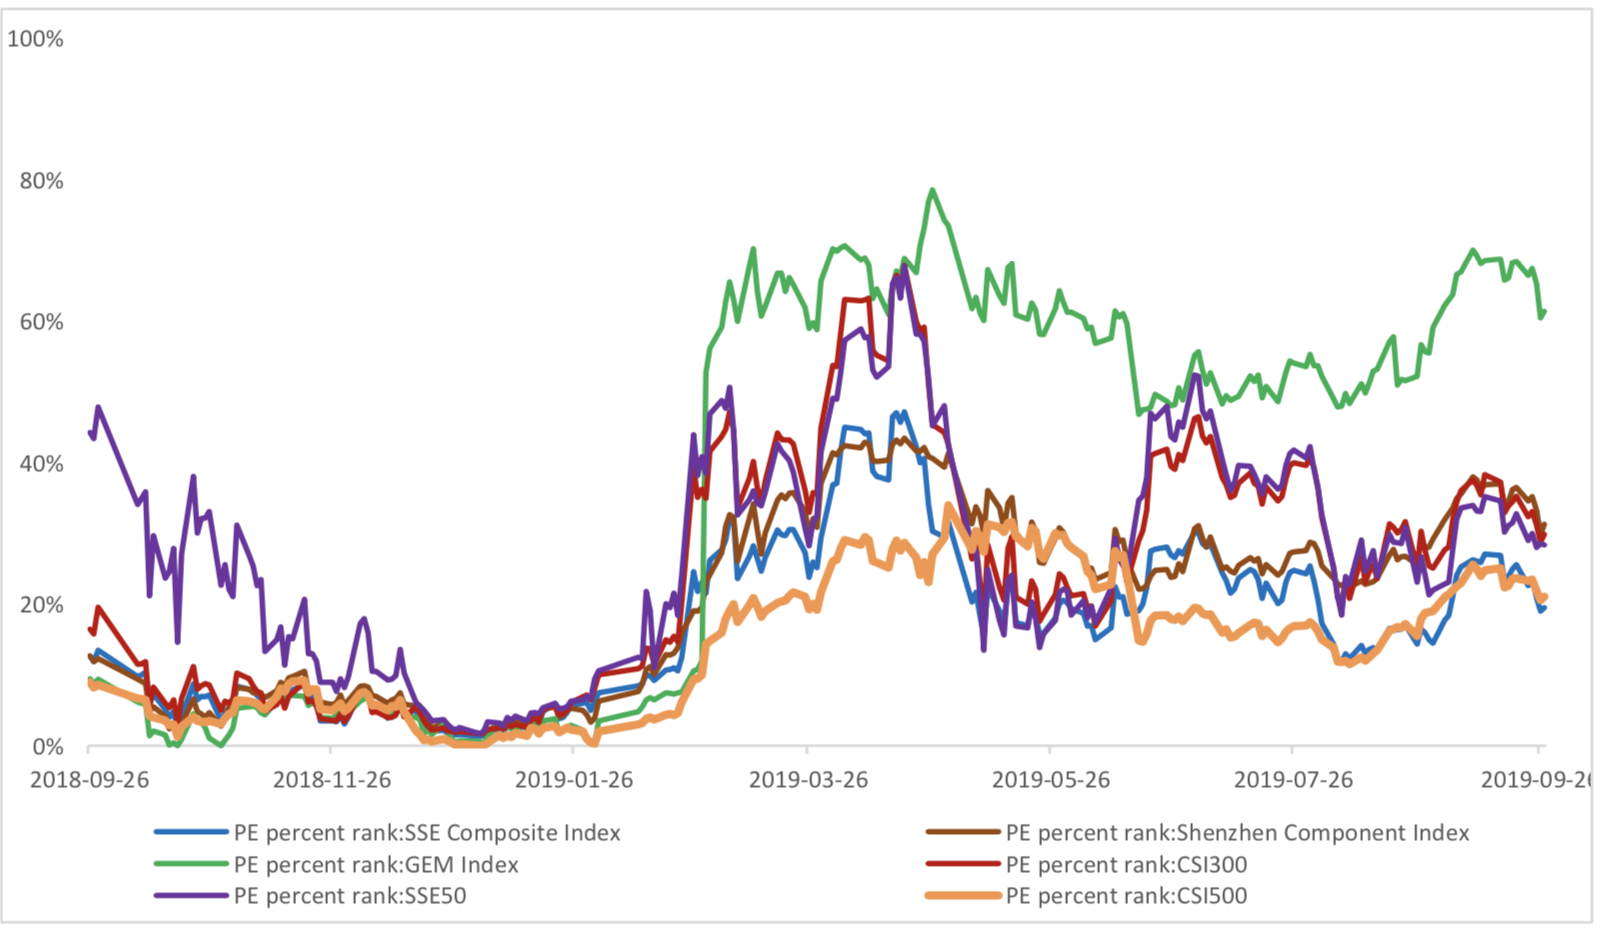
The current PE for SSE Composite Index, Shenzhen Component Index, GEM Index, CSI300, SSE50, CSI500 are 12.9340, 23.7794, 53.3283, 12.0084, 9.6196, 24.6372respectively; and these indices are at 19.50%, 31.30%, 61.40%, 29.90%, 28.40%, 21.10% percent rank level of their historic data, respectively
Graph 4: PE of 6 indices

Graph 5: PE percent rank of 6 indices (calculated by data of past 1200 trading days, only 1Y data is presented on the graph)
The current PB for SSE Composite Index, Shenzhen Component Index, GEM Index, CSI300, SSE50, CSI500 are 1.5185,2.6827,4.7397,1.5190,1.2443, 2.0682respectively, and these indices are at 32.10%, 30.10%, 38.60%, 52.20%, 55.70%, 15.30% percent rank level of their historic data, respectively.
Graph 6: PB of 6 indices

Graph 7: PB percent rank of 6 indices (calculated by data of past 1200 trading days, only 1Y data is presented on the graph)

(4) Foreign Fund Flow
Last week, there were 5 trading days for northward channel open for stock connect programs. During last week the total foreign fund flow via Stock Connect is 4.53 billion RMB, and the cumulative inflows was 828.63 billion RMB. Specifically, the fund flow via Shanghai-Hong Kong Stock Connect is -0.82 billion RMB and the fund flow via Shenzhen-Hong Kong Stock Connect is 5.35 billion RMB.
Graph 8: Fund flow via both Shanghai and Shenzhen-Hong Kong Stock Connect in past 1M (100 million CNY)

Graph 9: Fund flow via Shenzhen-Hong Kong Stock Connect in past 1M (100 million CNY)

Graph 10: Fund flow via both Shanghai-Hong Kong Stock Connect in past 1M (100 million CNY)

2. Index Futures
(1) Trading Volume and Open Interests
During past 5 trading days the average trading volume for CSI300(IF), SSE50(IH), CSI500(IC) contracts
are 79564 (-15.57%, the previous 5-trading day period),30336 (-19.58%),91959 (-8.61%) lots, respectively. On the last trading day, the total open interests for them are 104956 (-0.18%),54555 (3.16%),150289 (4.24%) lots respectively.
Graph 11: CSI300 Index futures’ trading volume

Graph 12: CSI300 Index futures’ open interests

Graph 13:SSE50 Index futures’ trading volume
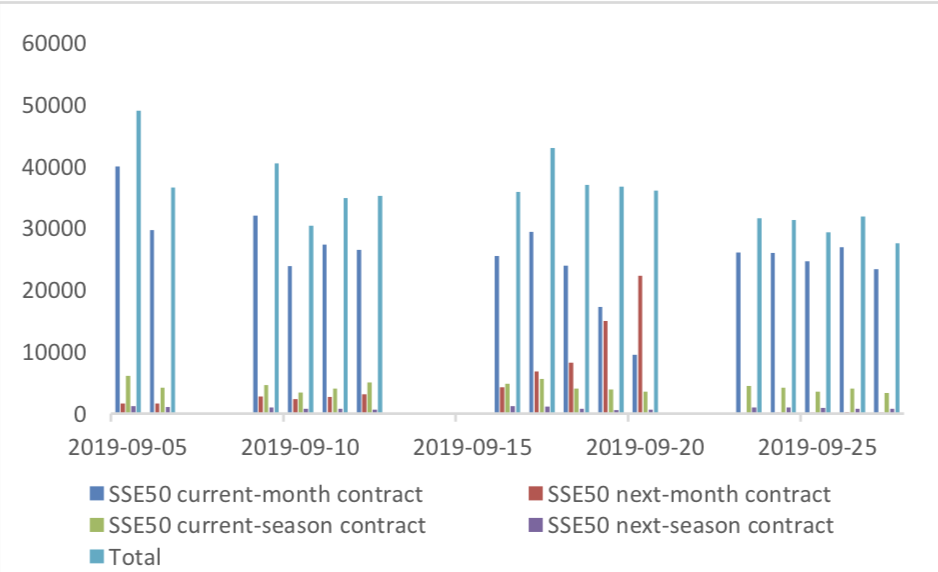
Graph 14: SSE50 Index futures’ open interests

Graph 15: CSI500 Index futures’ trading volume
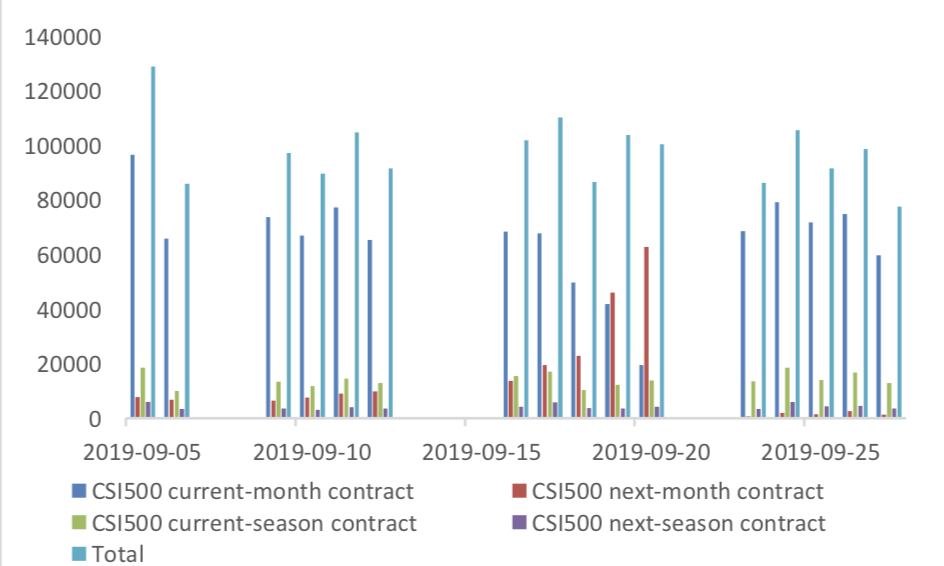
Graph 16: CSI500 Index futures’ open interests

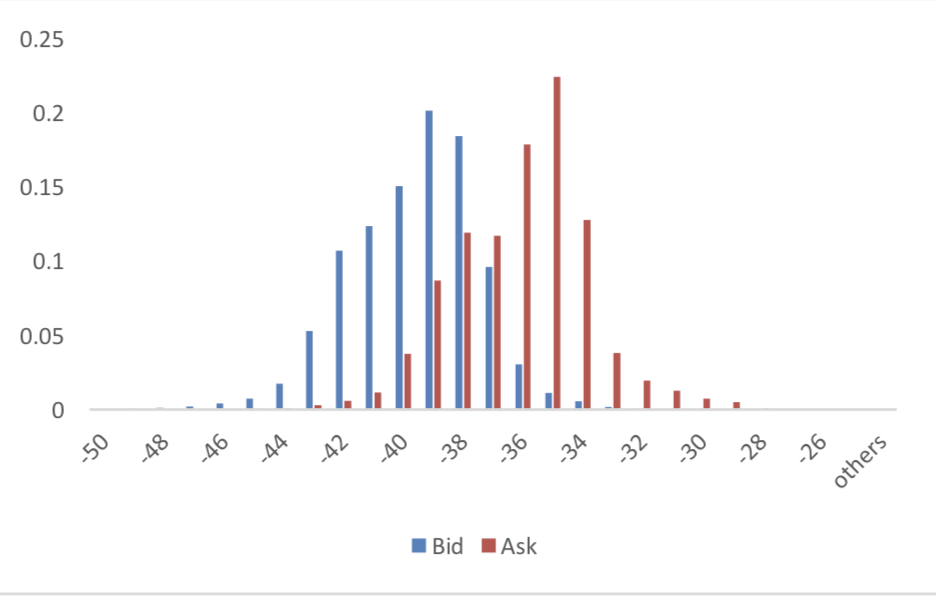
(2) Roll Level Bid-Ask Distribution
There are 5 trading days during last week, so the distribution is worked out with 36005 data points for each contract pair.
Graph 17: CSI300 Current/Next Month Contract Roll Spread Distribution (2s frequency)

Graph 18: SSE50 Current/Next Month Contract Roll Spread Distribution (2s frequency)

Graph 19: CSI500 Current/Next Month Contract Roll Spread Distribution (2s frequency)
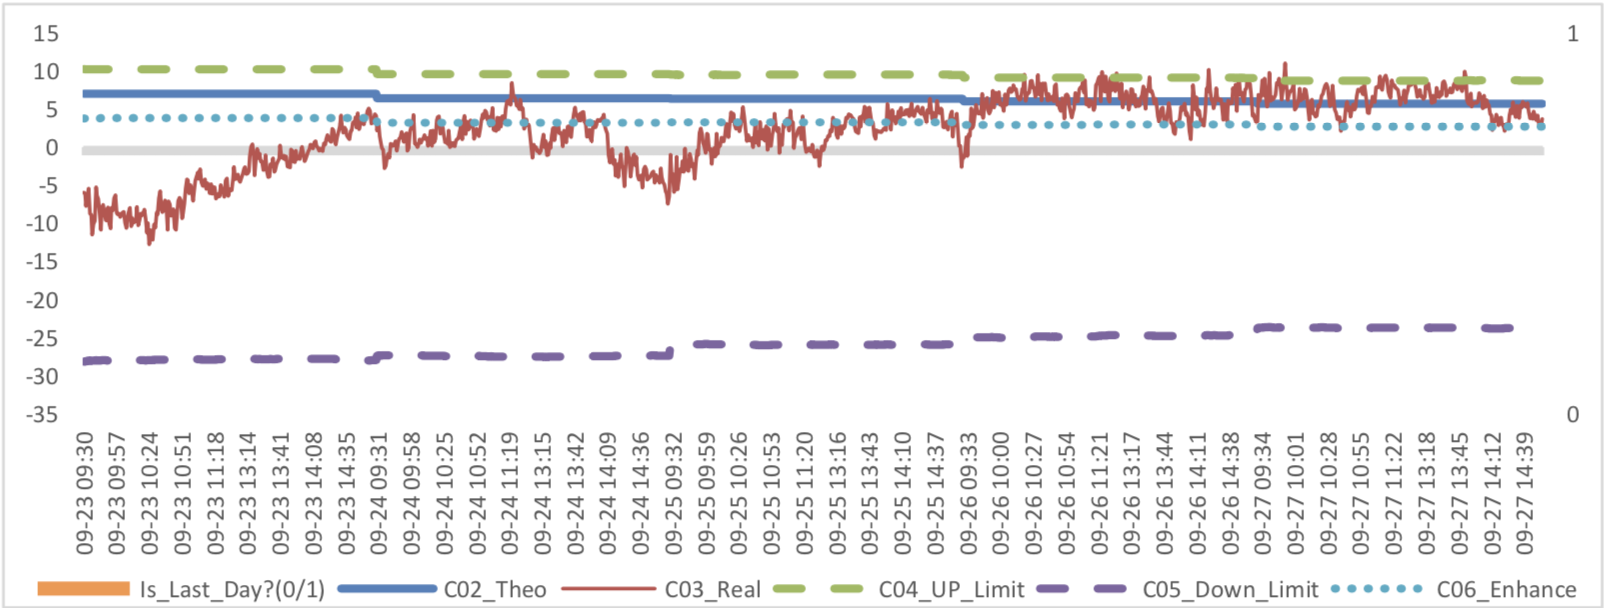
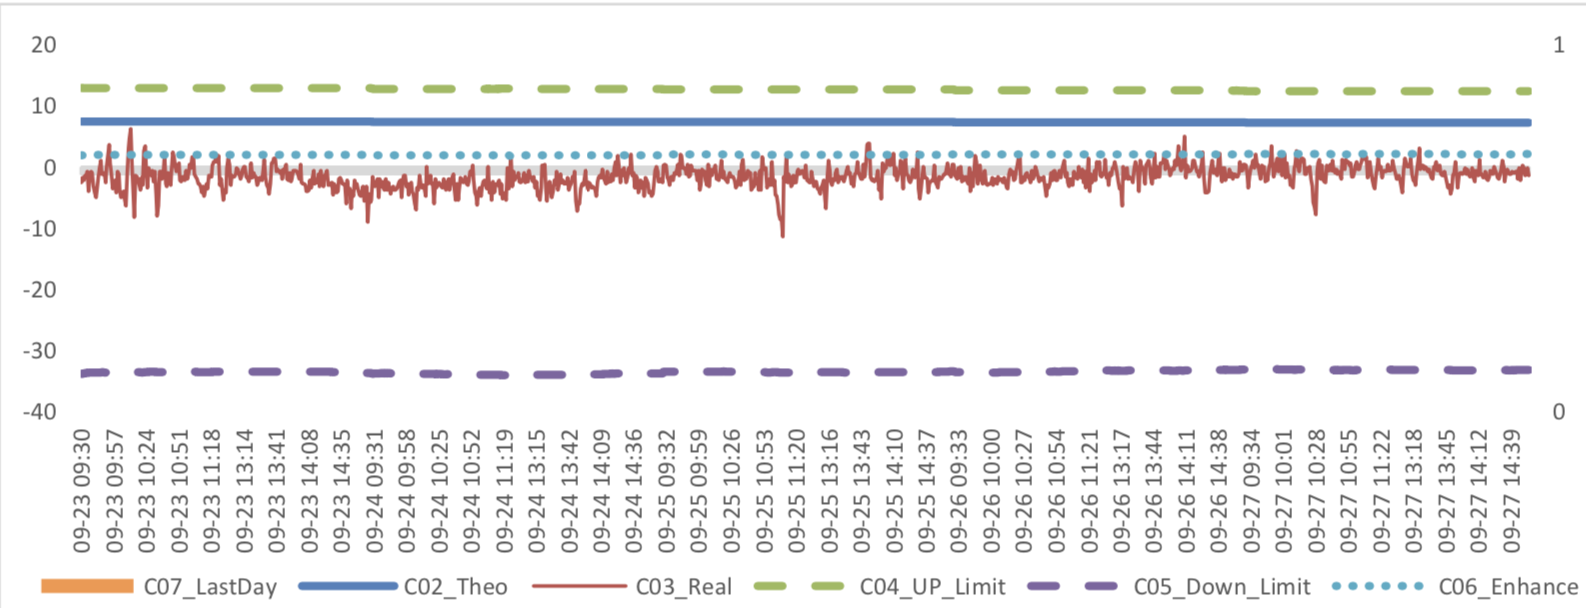
(3) Weekly Review of Future/Spot Arbitrage Opportunity
Assumption: risk-free rate: 3%; security borrowing cost: 8%; trading expense for spot: 0.025%; trading expense for futures: 0.005%; margin rates for futures contracts: 0.11 for CSI300 and SSE50, 0.13 for CSI500; margin rate for security borrowing: 0.3 (or 130% maintain rate).
When real price spread is out of theoretical range (calculated by our assumption), there exists absolute future-spot arbitrage opportunity.
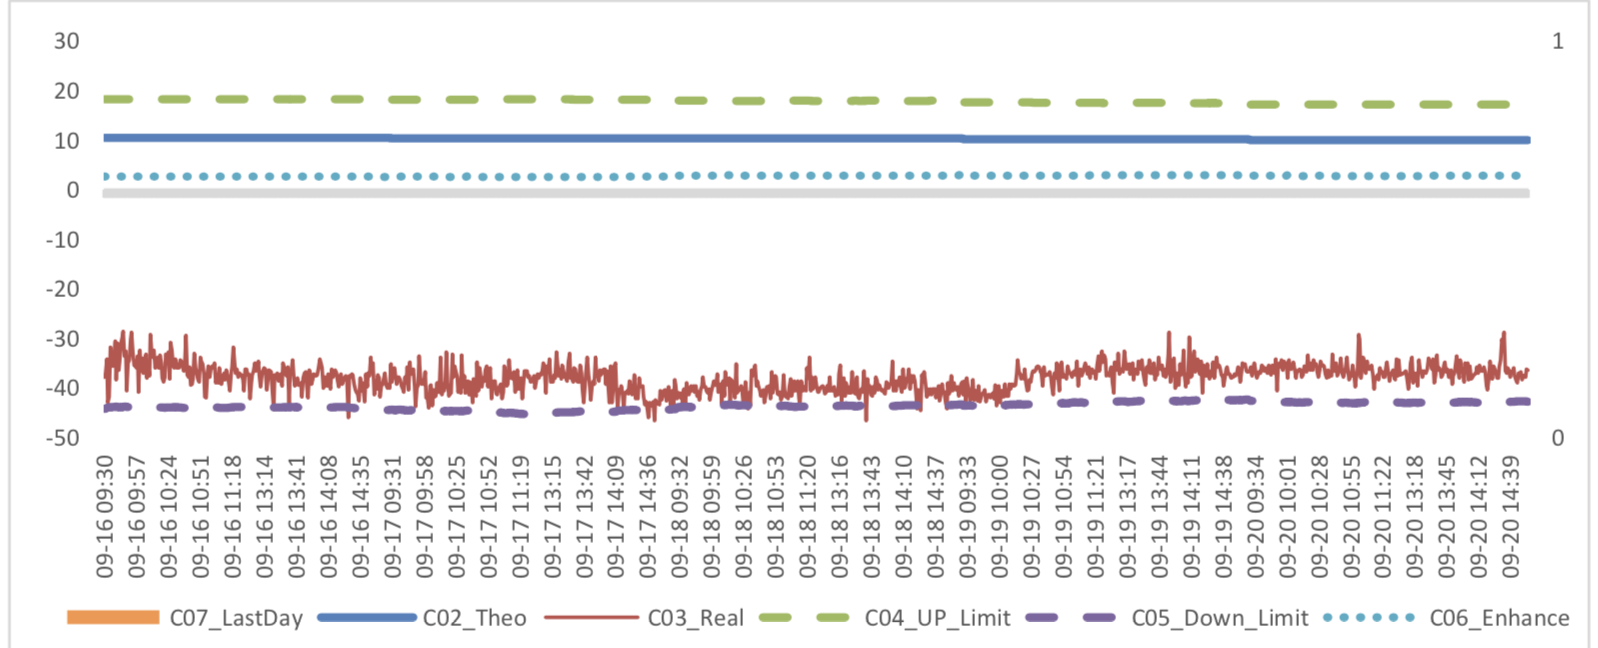
Graph 20: Future (Current Month)-Spot Arbitrage Opportunity for CSI300 contract (in the view of price difference)
Graph 21: Future (Current Month)-Spot Arbitrage Opportunity for SSE50 contract (in the view of price difference)

Graph 22: Future (Current Month)-Spot Arbitrage Opportunity for CSI500 contract (in the view of price difference)

Graph 23: Future (Next Month-Current Month) Arbitrage Opportunity for CSI300 contract (in the view of price difference)
Graph 24: Future (Next Month-Current Month) Arbitrage Opportunity for SSE50 contract (in the view of price difference)

Graph 25: Future (Next Month-Current Month) Arbitrage Opportunity for CSI500 contract (in the view of price
difference)
3. Financial Markets
(1) Interest Rates
The term structure of treasury bonds’ yields is currently upward sloping in concave shape.
Specifically, last week, short-term yields short term yield of Treasury bond experienced some fluctuation and 3M yield now at 2.2%-2.4% level. Furthermore, as for long-term yield, there is a small drop. 10Y yield is about 3.0%-3.2%.
Graph 26: Term Structure Evolvement of Treasury Bonds Yields During Recent 3 Months (%)

As for Shibor rates, short-term rates experienced significant fluctuation. Specifically, O/N rate experienced obvious fluctuation to 1.2%-1.4% level.
Graph 27: Term Structure Evolvement of Shibor Rates During Recent 3 Months (%)

(2) ExchangeRates
During last week, CNY/USD changed 0.415% to 7.1195 and offshore rate, CNH/USD, changed 0.24% to 7.1374 and USD index changed 0.64%.
Graph 28: USD/CNY, USD/CNH and USD Index

Macroeconomic Topic:
Data released by the National Bureau of Statistics show that in August, the added value of industries above scale increased by 4.4% in terms of monthly year-on-year ratio, with the pre-value of 4.8%; in January-August, the national fixed assets investment increased by 5.5% in nominal terms, with pre-value of 5.7%; and in August, the total retail sales of consumer goods increased by 7.5% in terms of monthly year- on-year ratio, with pre-value of 7.6%. The growth rate of industry and consumption will continue to hover at a low level. The situation of investment growth needs to be observed whether the policy level will start to exert its strength in November and December.
August Economic Data
(1) Fixed Assets Investment
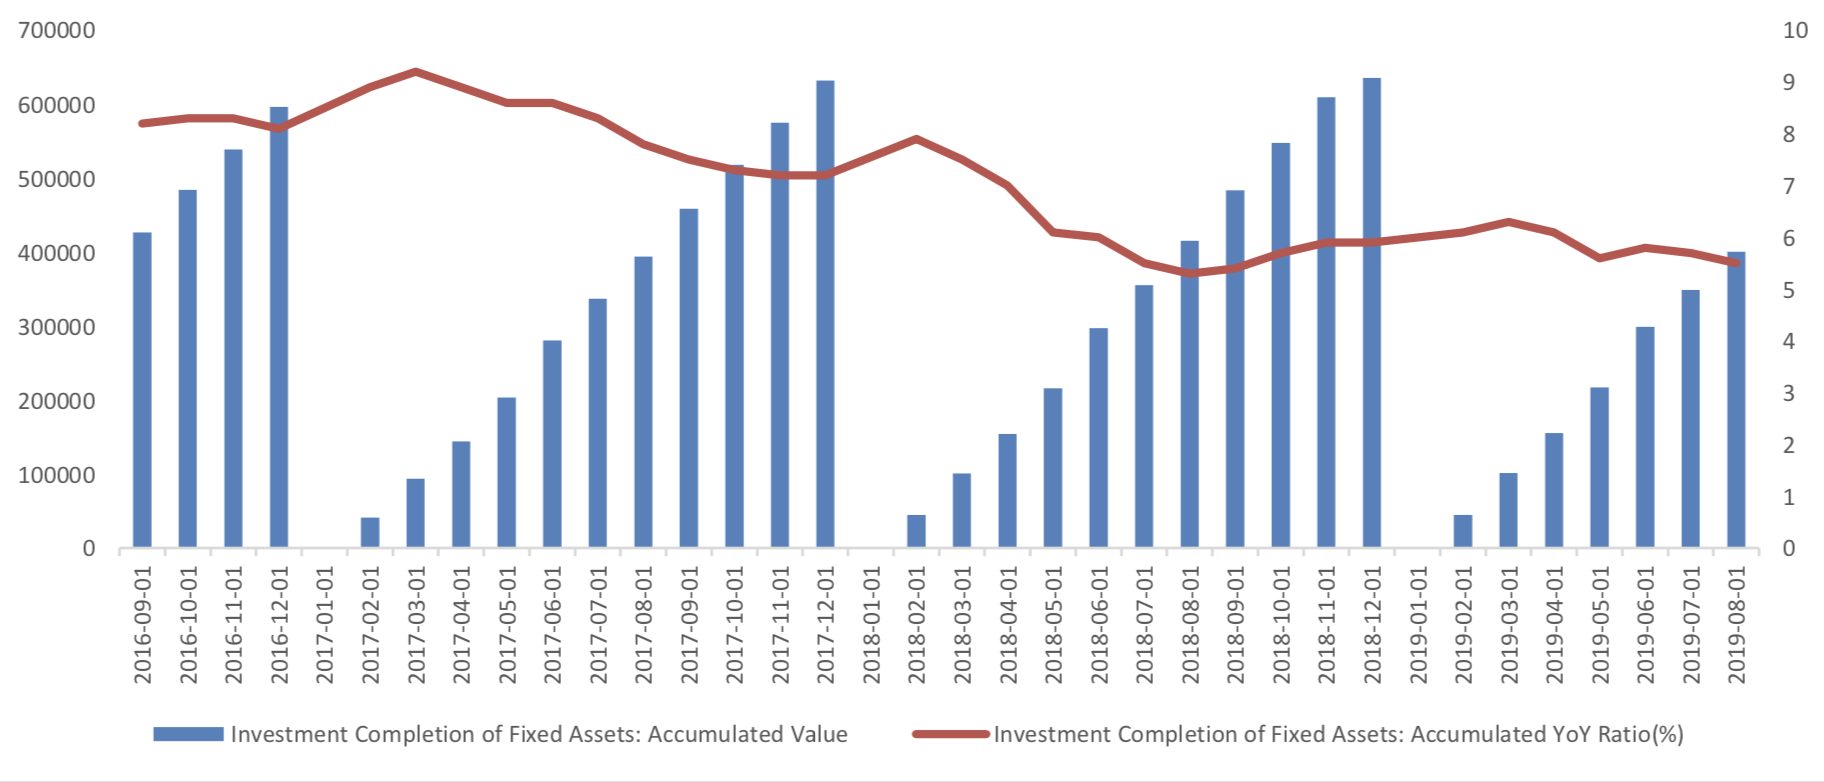
From January to August, the cumulative growth rate of fixed assets investment was 5.5% year-on-year, show a slow dropping trend. From the structural point of view, the growth rate of real estate investment has slightly decreased, manufacturing investment has slightly decreased, and infrastructure investment has slightly increased.
Graph A: Investment Completion of Fixed Assets (100m RMB)
Graph B: Investment Completion of Real Estate Development, Manufacturing Industry, Infrastructure Construction
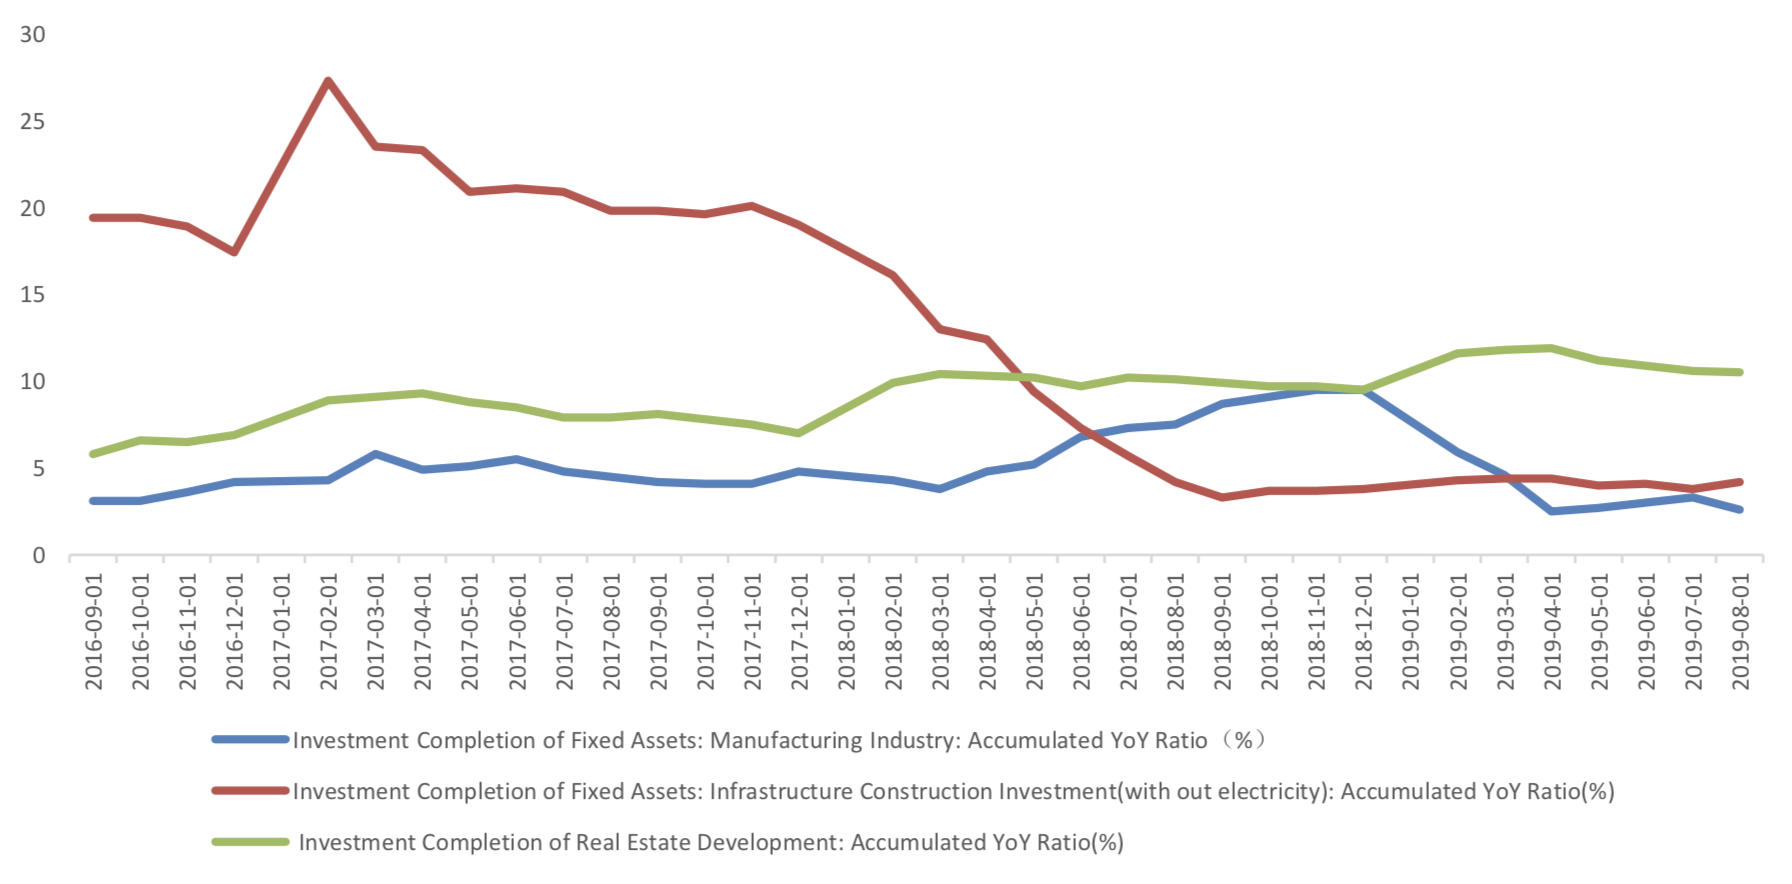
From January to August, investment in infrastructure (excluding electricity) increased by 4.2% year-on- year, with pre-value of 3.8%.
From January to August real estate investment increased by 10.5% year-on-year, 0.1 percentage points slower than the previous value, showed a drop trend. In August, the growth rate of new housing construction area dropped. From January to August, the cumulative growth rate was 8.9% year-on-year, which was lower than the previous value of 9.5%. It played an obvious role in dragging real estate development investment in the same period.
Graph C: Build Construction Data

From January to August, manufacturing investment increased by 2.6% year-on-year, and the growth rate increased by 0.7 percentage points compared with the previous value.
Private investment completion of fixed assets decreased. From January to August, the cumulative growth rate of private fixed assets investment was 4.9% year-on-year, which was 0.5 percentage points lower than the previous period.
Graph D: Private Investment Completion of Fixed Assets

(2) Industrial Value Added
In August, the value added of industries above the designated size increased by 4.4% year on year, and the growth rate dropped by 0.4 percentage points compared with the previous month.
Graph E: Industrial added value above designated size: Monthly YoY Ratio (%)

Currently no Comments.
Hot Topics
The 13rd China International Future Forum
The Shanghai Derivatives Energy Forum has received extensive attention from relevant industries both within and outside the borders.
Financial institutions deep explore commodity market opportunities, commodity index financial products show full-scale trend
R-Code for analysis: getKDJ
R-Code@June 06, 2016
New indicator to analyze the arbitrage opportunities between sse50 and csi500
Market review: January 11, 2017
The Great China Bubble: Anniversary Lessons and Outlook
Quant Investment in China A-share market
The hedge strategy between SSE50 and A50--Jan 13,2017
The arbitraging strategy between CSI300 and SSE50
Market review: June 17, 2016
Sleepless in London--Enda Homan(Allied Irish Banks Plc)
MSCI Rebuffs Chinese Equities for Third Time in Blow to Xi
Soros, Druckenmiller among hedgies profiting in market plunge