FangQuant › Financial Futures
Summary:
As of September 30, 2019, the FTSE China A50 Index and the SSE 50 index rose by 32.31% and 28.06% respectively this year. The trend of this two index is basically the same, however, the cumulative yield of the A50 index is 4.25% higher than that of the SSE50 index in the first three quarters of this year.
This report mainly reviews the difference in the trend of the A50 Index and the SSE50 Index in the first three quarters of this year, and analyses the reasons why the cumulative yield of the A50 Index is leading from the Industry differences in index constituents. To summarize, the market fluctuated sharply in the first two quarters, and the strengths of various industries during this period are also significantly different, and the Food, Beverage & Tobacco and Consumer Durables & Apparel industries, which has a higher weight in the A50 Index, was even stronger during the period from January to May, making the A50 index perform better than the SSE50 Index in terms of cumulative yield.
1. Introduction
The SSE 50 Index is based on scientific and objective methods to select the 50 most representative stocks in the Shanghai securities market, which are the most liquid stocks. The purpose of the index is to comprehensively reflect the overall situation of a group of leading companies with the most market influence in the Shanghai securities market. The SSE50 Index was officially released on January 2, 2004, in order to create an active investment index that can be used as a target for derivatives.
The FTSE China A50 Index (A50 Index) is a real-time trading index that includes the 50 largest A-share companies. The index provides the best balance between representation and tradability in China's A-share market, with indicators including performance, liquidity, volatility, industry distribution and market representation, which are all at market leading levels.
Table 1: Introduction of the SSE 50 Index and the FTSE China A50 Index

In the method of index construction, the candidate stocks of the SSE50 Index must be in the SSE180 index, and each constituent stock should be representative. The construction of the A50 Index is focus on the top 50 A-share companies with biggest market capitalization after free-floating adjustments, while also taking into account the investability of foreign investors.
2. Market Review
Overall, the A50 Index and the SSE50 Index are basically in line with this year's trend. As of the end of the third quarter, the A50 Index's cumulative yield this year is 4.25% higher than the SSE50 Index. From the performance of each month, the A50 Index performs better in most months, and its monthly yields in January, March, April, July, August and August exceed the SSE50 Index by 1.71%, 1.18%, 0.58%, and 0.46%, 0.92% and 0.37%, respectively., while SSE50 only outperformed the A50 Index by 0.96%, 0.57% and 0.36% in February, June and September respectively. Judging from the difference in monthly yields, the A50 Index and the SSE50 Index fluctuated significantly in the first half of the year due to the sharp increase in the market in the first and second quarters of this year, resulting in a large difference in monthly yields between the two in the first half of the year; In the third quarter, as the market entered the shock zone, the fluctuations of the two were significantly reduced, and the difference in monthly yields also decreased.
The reason why the final cumulative yield of the A50 Index in the first three quarters of this year is significantly higher than the SSE50 Index is that the A50 Index performs better when the market fluctuates greatly from January to May. The yields of the two did not differ much in June and September. The cumulative yields of the A50 and SSE50 indices during the period from June to September were 6.62% and 6.18%, respectively.
Figure 1: Cumulative Yield of the SSE50 Index and the A50 Index in the First Three Quarters of This Year

Figure 2: The Difference in Monthly Yield between the SSE50 Index and the A50 Index

3. Industry Composition Changes
The A50 Index is adjusted once a quarter, the most recent one is China Railway Construction and Bank of Beijing in September 20, and newly transferred to China International Travel Service and Shanghai Airport; The SSE50 Index is adjusted once every six months. The most recent constituent stock adjustment was on June 17th, and five sample stocks of Shandong Gold, Greenland Holdings, Datong–Qinhuangdao Railway, Bank of Beijing and 360 were transferred out, five sample stocks of Sany, Haitong Securities, CSC Corporation, Air China and PICC were newly transferred into.
Judging from the composition of index component industries or changes in weight this year, the major changes are:
(1) From the perspective of Banking industry constituent stocks, after the adjustment in September, the number of constituents of the A50 decreased from 14 at the end of last year to 12, and the weight dropped from 35.97% at the end of last year to 30.07%; The number of constituents of the SSE50 has decreased from 12 at the end of last year to 11, and the weight has dropped from 33.39% last year to 27.90%. The decline is more obvious.
(2) From the perspective of Capital Goods industry constituent stocks, the number of constituent stocks of A50 decreased from 6 at the end of last year to 4, and the weight dropped significantly from 6.27% at the end of last year to 3.16%, the number of constituents of SSE50 is opposite to that of A50. The number has increased from 6 at the end of last year to 7, and the weight has dropped from 8.72% at the end of last year to 7.81%.
(3) From the perspective of Diversified Finance industry constituent stocks (including mainly brokerage stocks), the number of constituent stocks of A50 has not changed, and the weight has increased from 4.04% at the end of last year to 4.19%; The number of constituents of SSE50 increased from 3 to 5, and the weight increased significantly from 5.77% at the end of last year to 8.10%.
(4) From the perspective of the Food, Beverage & Tobacco industry constituent stocks, the number of A50 constituent stocks increased from 5 at the end of last year to 6, and the weight significantly increased from 12.10% to 17.48%; The number of constituents of SSE50 has not changed, and the weight has increased from 10.12% to 13.49%.
(5) From the perspective of Insurance industry constituent stocks, the number of A50 constituent stocks is the same as that at the end of last year, and the weight has increased from 14.88% to 17.31%; the number of SSE50 constituent stocks has increased from 4 to 5, and the weight has increased from 17.98% to 20.91%.
Overall, there is a small adjustment in the number of constituent stocks in each of the A50 and SSE50 industries. The return performance of the various industries has the influence of objective difference, there is a certain change in the weight of the constituent stocks. The same is that the A50 and SSE50 constituent stocks weights in the banking industry have dropped significantly, and the constituent stocks weight in the food and beverage, tobacco and insurance industries have increased significantly. The difference is that A50 and SSE50 have significant differences in the adjustment of constituent stocks in the capital goods industry, resulting in an increase difference in the weight between the two, and the number and weight of constituents stocks of the A50 in the diversified financial industry have hardly changed, while the SSE50 have increased significantly in this industry.
Table 2: The Industry Composition Changes of the A50 Index (Number of Constituents)
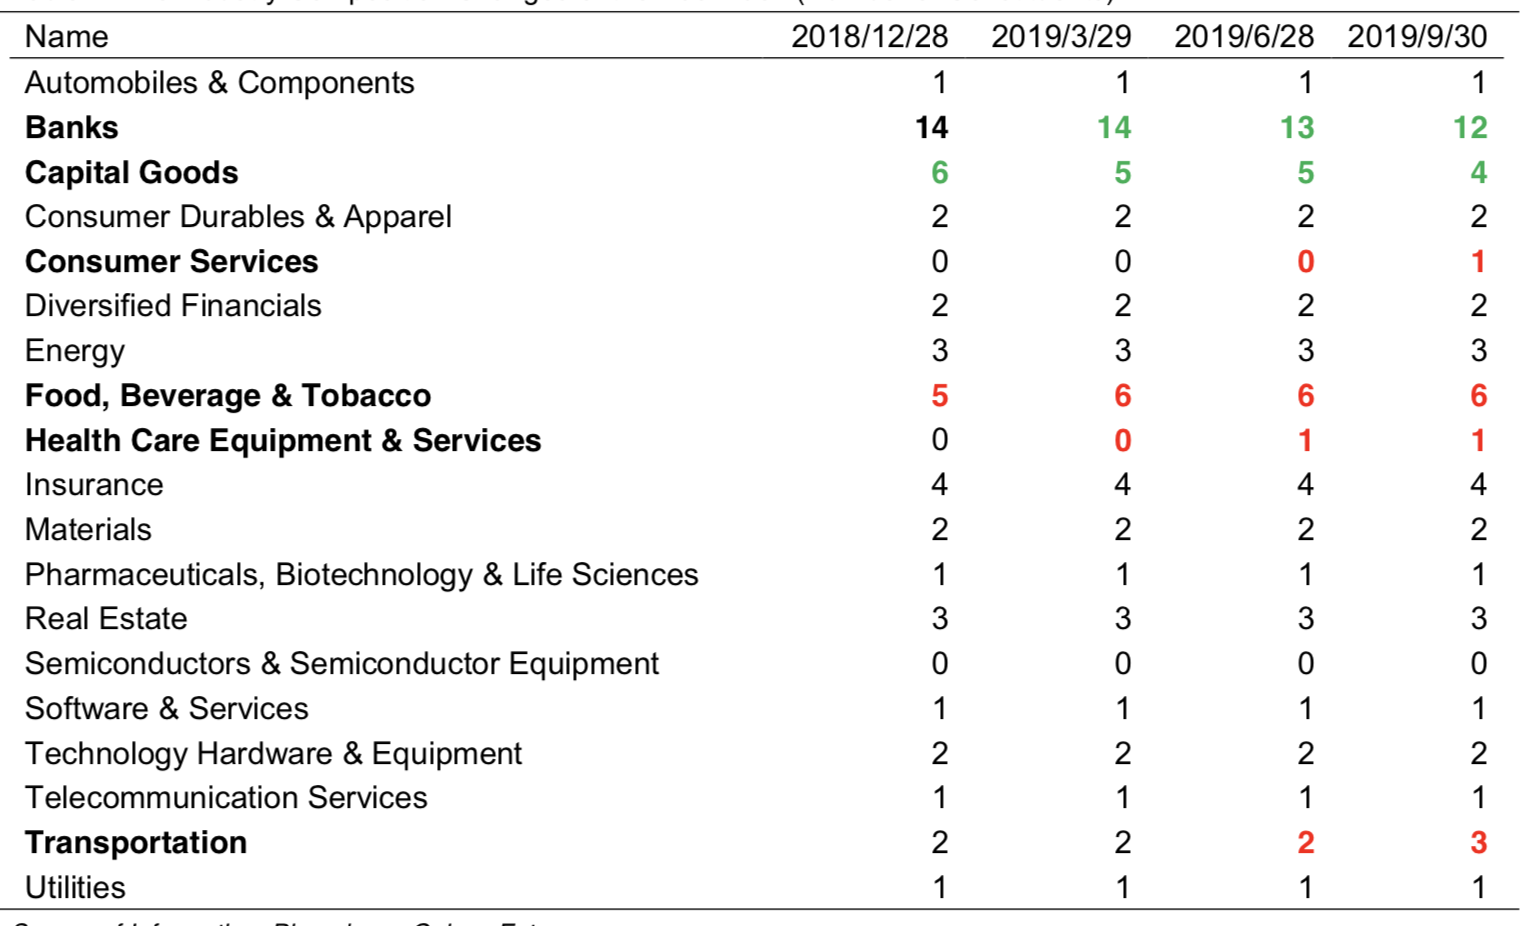
Table 3: The Industry Composition Changes of the SSE50 Index (Number of Constituents)

Table 4: The Industry Composition Changes of the A50 Index (Industry Weight,%)

Table 5: The Industry Composition Changes of the SSE50 Index (Industry Weight,%)

4. Reasons for Performance Differences
In terms of the trend of the first three quarters of 2019, the A50 Index and SSE50 Index
correlation, but the cumulative yield of the A50 Index in the first three quarters is 4.25% higher than that of the SSE50 Index. The main reason why the A50 Index outperformed the SSE50 Index in the first three quarters is that it performed better in the first quarter and the second quarter (the first half) of this year when the market rose sharply.
Looking back at the market performance in the first three quarters of this year, it can be seen that the situation of Sino-US trade consultation has deteriorated sharply and the uncertainty of global market has increased significantly due to the announcement by President Trump on May 6 that tariffs on Chinese imports to the United States will be raised. Affected by this, the domestic stock market has changed from the previous unilateral upward trend to shocks. Considering that Trump threatened to impose tariffs in the first ten days of May, and constituent adjustment of the SSE50 Index occurred in mid-June, when analyzing the performance differences between the A50 Index and the SSE50 Index, this report divides the first three quarters into two periods, January to May and June to September.
From January to May, the average yield in all industries was 19.74%. The industries that exceeded the average yield of include Food, Beverage & Tobacco, Insurance, Semiconductor, Consumer Durables &
Apparel, Diversified Finance Industries, while the industries that performed poorly mainly include the Banking, Capital Goods, Energy, Media, Automobile & Components industries.
Figure 3: Performance of various industries from January to May (%,the Average Yield is 19.74%)

From June to September, the average yield in all industries was 3.66%. The industries that exceeded the average yield of the industry included the Semiconductor, Technology Hardware & Equipment, Health Care Equipment & Services, Insurance, Pharmaceutical Biotechnology & Life Sciences and other industries, while the industries that performed poorly included Capital Goods, Transportation, Real Estate, Media, Materials, Energy, Retailing and other industries.
Figure 3: Performance of various industries from June to September (%,the Average Yield is 3.66%)

Comparing the weight differences of A50 Index and SSE50 Index in each industry, the major differences between the two indexes are: the weight of A50 Index in Banking, Consumer Durables & Apparel, Food, Beverage & Tobacco and Real Estate industries is higher than that of A50 Index; while the weight of SSE50 Index in capital goods, multi finance, insurance and materials industries is significantly higher than that of SSE50 Index.
Table 6: The Difference in the Industry Weight between the A50 Index and the SSE50 Index (W(SSE50)-W(A50), %)

Considering the performance of the above-mentioned industries and the difference in the weight of equity components between the two indices, the following conclusions can be drawn:
From January to May, the market as a whole showed a unilateral upward trend, and all industries achieved positive returns. Returns of Food, Beverage & Tobacco, Consumer Durables & Apparel, Real Estate and Banking industries with higher weights in A50 Index components were 51.3%, 27.2%, 17.8% and 14.9%, ranking 1st, 4th, 12th and 17th respectively among 24 Wind secondary industries. The yield of Insurance, Diversified Finance, Materials and Capital Goods industries with higher weights in SSE50 Index are 38.5%, 25.9%, 17.9% and 14.9%, ranking 2nd, 5th, 11th and 18th respectively in 24 industries. The strong performance of the Food, Beverage & Tobacco, Consumer Durables & Apparel industries made the A50 Index perform better from January to May.
From June to September, the market as a whole showed a volatile trend, with the rise and fall of the industries interacting. The yield of Food, Beverage & Tobacco, banking, Consumer Durables & Apparel and Real Estate industries with higher weights in A50 Index components are 7.0%, 4.0%, 1.4% and -3.8%, ranking 9, 12, 14 and 20 respectively in 24 Wind secondary industries. The yield of Insurance, Diversified Finance, Capital Goods and Materials industries with higher weights in SSE50 Index are 8.9%, 4.3%, 1.2% and -4.1%, ranking 6th, 10th, 17th and 22nd respectively in 24 industries. Industries with large differences in constituent weight between the two indexes all show general performance, and the difference in return rate is small, which leads to little difference in the overall cumulative yield between the two indexes from June to September.
Overall, due to the large market fluctuations in the first three quarters of this year, especially in the first two quarters, the strength of various industries during this period is also clearly divided. Food, Beverage & Tobacco and Consumer Durables & Apparel industries with high equity weight in the A50 Index performed strongly in the first half of this year, making the A50 Index perform better than SSE50 Index in the cumulative yield.
It is worth mentioning that the adjustment of constituent stocks of the SSE50 Index in the mid-June, moved out five sample stocks of Shandong Gold, Greenland Holdings, Datong–Qinhuangdao Railway, Bank of Beijing and 360, and moved into S five sample stocks of Sany, Haitong Securities, CSC Corporation, Air China and PICC. If the adjustment is reflected in the change of industry weights, the SSE50 Index reduced the weights of Software& Services, Banking, Real Estate and Materials industries, and increased the weights of Insurance, Diversified Finance and Capital Goods industries. From June to September, the yields of the four industries mentioned above are 7.35%, 4.0%, 3.8% and -4.1% respectively, ranking 8th, 12th, 20th and 22th among the 24 industry industries, while the yields of Insurance, Diversified Finance and Capital Goods industries in the same period are 8.9%, 4.3% and -1.2% respectively, ranking 6th, 10th and 17th, respectively among the industries. The average yield of all industries in the same period is 3.66%. By contrast, the industry performance of the constituent stocks transferred by SSE50 Index is obviously better than that of the constituent stocks transferred out. That is to say, the SSE50 Index adjusted its constituent stocks in mid-June, making it perform better from June to September, so that the difference between the yield of the two indexes has not been widened.
5. Outlook for the Fourth Quarter
From the risk preference point of view, the reaction of the third quarter A-share market to the negative news of China-US frictions has shown marginal passivation. From October 10 to 11, the thirteenth round of China-US high-level economic and trade consultation made a breakthrough. The US side will postpone the tariff imposition on 250 billion US dollars of Chinese goods originally scheduled for October 15. Trump said that he might sign an agreement with China around the APEC summit in Chile on November 16. It is expected that before APEC meeting in November, the market will be in a rebound brought about by increased risk appetite.
Fundamentally, PMI in official manufacturing industry rebounded in September, and Caixin PMI rebounded for three consecutive months, indicating that domestic manufacturing boom has improved and the economy has shown some resilience.
From the policy point of view, at the meeting of the Finance Committee on September 27, the strengthening of counter-cyclical adjustment was once again emphasized, and domestic monetary policy easing is expected to continue. With the deepening of financial supply-side reform and the acceleration of financial opening to the outside world, the financial industry, especially the Diversified Finance industry which is mainly composed of securities companies, is expected to benefit in the long run. On the one hand, the reform of registration system from STAR Board to GEM improves the efficiency of direct financing of SMEs, and benefits technological innovation enterprises. On the other hand, it is expected to increase the earnings of securities firms.
From the perspective of investment style, with the continuous inflow of foreign capital and FTSE Russell, MSCI and other indicators to expand the proportion of A-shares, the investment style of the domestic market will gradually be in line with international standards and become more mature. According to historical data, foreign capital prefers enterprises with large market value, high dividend and low fluctuation, while banks, diversified finance, insurance, food and beverage, household appliances and medical industries are expected to benefit from the inflow of foreign capital for a long time. In addition, according to statistics, US funds prefer the Internet, software, semiconductor and other technology industries. Qualified companies listed on the Star Board will also be included in the MSCI Global Investable Market Index from November, and technology companies may benefit from foreign capital inflows for a long time.
Generally speaking, the Banking, Diversified Finance, Insurance, Food & Beverage, Household Appliances, Medical Treatment and Science & Technology industries that meet foreign investment preferences are expected to perform better in the long run with the inflow of foreign capital. Although the outcome of this round of trade negotiations exceeded expectations and the China-US trade conflict was temporarily eased, we should not be too optimistic about the outcome of this round of negotiations, and the follow-up reverse may repeat. In the short run, the Electronics and Telecommunications industries, which were highly affected by the trade war in the earlier period, are expected to perform better during the window when the trade war eased. In fact, it can be seen from the comparison of the performance of the previous industry industries that the reaction of the A-share market to the negative news of China-US friction in the third quarter has been marginally passivated, and the yield of the Semiconductor and Technical Hardware & Equipment industry from June to September have been marginally passivated were 16.8% and 15.7% respectively, ranking first and second among all industries.
Taking the weights of A50 Index and SSE50 Index into consideration, the weights of A50 Index are higher in Banking, Food & Beverage, Consumer Durables & Apparel industries, while SSE50 Index has higher weights in Diversified Finance, Insurance and Medical treatment. Both of them have different weights in the industry of foreign investment preference, and both indexes will benefit from the long-term inflow of foreign investment. The weight of the A50 Index in the Technical Hardware & Equipment industry is 1.63% higher than that of the SSE50 Index, while the weight of the SSE50 Index in the Semiconductor industry is 0.62% higher than that of the A50 Index, and there is little difference between the two weights. Looking forward to the fourth quarter, it is expected that the A50 Index and SSE50 Index will be close in earnings performance. With the disclosure window of the three-quarter report, the molecular logic will still dominate the market, and the industry and individual stocks with high performance certainty will obtain stable excess earnings opportunities.
Copyright by Fangquant.com
Currently no Comments.
Hot Topics
The 13rd China International Future Forum
The Shanghai Derivatives Energy Forum has received extensive attention from relevant industries both within and outside the borders.
Financial institutions deep explore commodity market opportunities, commodity index financial products show full-scale trend
R-Code for analysis: getKDJ
R-Code@June 06, 2016
New indicator to analyze the arbitrage opportunities between sse50 and csi500
Market review: January 11, 2017
The Great China Bubble: Anniversary Lessons and Outlook
Quant Investment in China A-share market
The hedge strategy between SSE50 and A50--Jan 13,2017
The arbitraging strategy between CSI300 and SSE50
Market review: June 17, 2016
Sleepless in London--Enda Homan(Allied Irish Banks Plc)
MSCI Rebuffs Chinese Equities for Third Time in Blow to Xi
Soros, Druckenmiller among hedgies profiting in market plunge