FangQuant › Financial Futures
Market Summary:
Last week, there was generally increase over the market. SSE Composite Index (000001.SH) changed 0.57 % to 2954.93. Specifically, small cap shares perform slightly better than small cap shares and we can observe that CSI500 did better than SSE50 (0.13% vs 0.66%). The average daily turnover of the whole market during past 5 trading days is 372.84 billion CNY, it decreased 8.15% compared with the previous 5-trading day period
Last week, the net inflow of northbound funds reached a new high point, totally 844.4 billion RMB. In the near future, the net inflow of foreign investment will continue. The next step is to focus on the third step of MSCI expansion, and the increase of foreign investment is expected. In terms of the fourth quarter, the proportion of a shares included in MSCI will be increased from 15% to 20% in November, while the proportion of medium cap shares will be included at 20%, which will take effect after the close of business on November 26, when the incremental foreign capital will flow into the A-share market, which will boost market sentiment.
As for arbitrage opportunity, CSI500 futures current-month contracts show some room for arbitrage opportunities. No price spread for next-month/current month contracts show room for arbitrage.
News:
(1) Shanghai Securities News: according to the latest statistics, about 70% of the 10 billion private placement positions are over 80%. For example, considering the factors such as daily response to redemption to maintain liquidity, "more than 80% of the positions" for a private placement means that the position is close to the upper limit and there is a strong desire to long.
(2) Securities Times: Miao Jianmin, chairman of the People's Insurance Group of China, said that China's market interest rate is currently at a low level. From the perspective of economic fundamentals, domestic demand is weak. With the slowdown of external demand, downward pressure on the economy is increasing, and the marketization reform of domestic interest rates is coming to an end. Under the dual pressure of economic downturn, short-term structural inflation and medium and long-term deflation risk, macro- economy and demand have been stabilized through such tools as reducing reserve and tax reduction. But in the medium and long term, both the real interest rate and the nominal interest rate will show a downward trend.
(3) China Securities Network: Wang Yufei, deputy general manager of DCE, said that in the future, DCE will further improve the breadth and depth of futures market and strive to create better conditions for various institutions to serve the real industry. Accelerate the internationalization of listed varieties, and make preparations for QFII and other institutions to participate in the policy design and landing services of futures market.
(4) Shanghai Securities Journal: Lu Lei, deputy director of the State Administration of foreign exchange, said that the next step would be to coordinate the trading and exchange links, focus on the two-way opening of the financial market, orderly promote the opening of non-exchangeable projects, moderately increase the participants in the foreign exchange market, enrich the varieties of foreign exchange transactions, support the construction and development of the science and technology innovation board, and encourage foreign investors to participate in the science and technology innovation board.
(5) In September, China's Industrial Enterprises above Designated Size realized a total profit of 575.58 billion yuan, down 5.3% year on year, with a decrease rate of 3.3 percentage points higher than that in August. From January to September, China's Industrial Enterprises above Designated Size achieved a total profit of 4593.35 billion yuan, down 2.1% year-on-year, 0.4 percentage points higher than that from January to August. Bureau of Statistics: in the first three quarters of 2019, the total profits of Industrial Enterprises above designated size decreased by 2.1% year-on-year; among them, the first quarter decreased by 3.3%, the second quarter decreased by 1.9%, and the third quarter decreased by 1.8%, showing a trend of narrowing quarter by quarter; in September, the profits of industrial enterprises decreased by 5.3% year-on-year, the decline was larger than that in August, mainly due to the expansion of the drop in the factory price of industrial products and the slowdown in sales growth effect.
(6) Xinhua News Agency: on the evening of October 25, Liu He, the Chinese leader of the China US comprehensive economic dialogue, held a phone call with US side. The two sides agreed to properly address their core concerns and confirmed that the technical consultation of some texts was basically completed. The two sides confirmed that they have reached consensus on the equivalence of the regulatory system for the US side's import of domestic cooked poultry and catfish products, the lifting of the US poultry export ban to China, and the application of the public health information system for meat products. The leaders of both sides will call again in the near future, during which the working level will continue to hold consultations.
1. StockMarket
(1) Indices Performance
During last week, SSE Composite Index (000001.SH) changed 0.57 % to 2954.93, SHENZHEN COMPONENT INDEX (399001.SZ) changed 1.33 % to 9660.44, ChiNext Price Index (399006.SZ) changed 1.62 % to 1675.34, CSI 300 INDEX (000300.SH) changed 0.71 % to 3896.79, CSI SmallCap 500 index (000905.SH) changed 0.66 % to 4994.57, SSE 50 Index (000016.SH) changed 0.13 % to 2967.05.
Graph 1: Indices Performance over past 3 months

The average daily turnover of the whole market during past 5 trading days is 372.84 billion CNY, it decreased 8.15% compared with the previous 5-trading day period.
Graph 2: Market turnover

(2) Sectors Performance
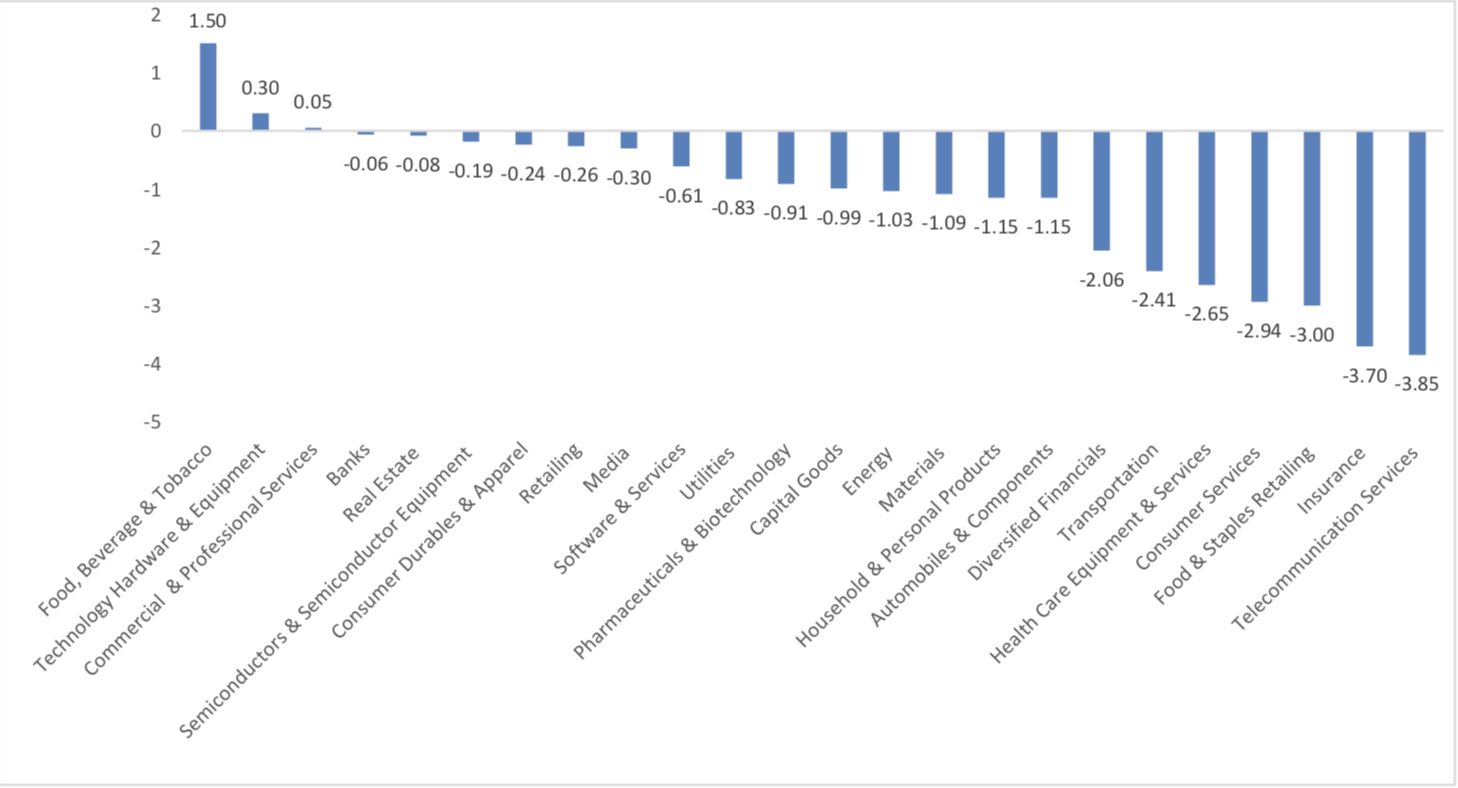
In the view of sectors, during last week (from 2019-10-18 to 2019-10-25), 3 of 24 Wind Level-2 sector(s) increased while 21 sector(s) dropped. Specifically, Food, Beverage & Tobacco(1.50%), Technology Hardware & Equipment(0.30%) and Commercial & Professional Services(0.05%) did the best performance while Telecommunication Services (-3.85%), Insurance (-3.70%) and Food & Staples Retailing (-3.00%) did the worst performance.
Graph 3: Sectors performance under Wind Level-2 classification (%)
(3) Indices Valuation (TTM)
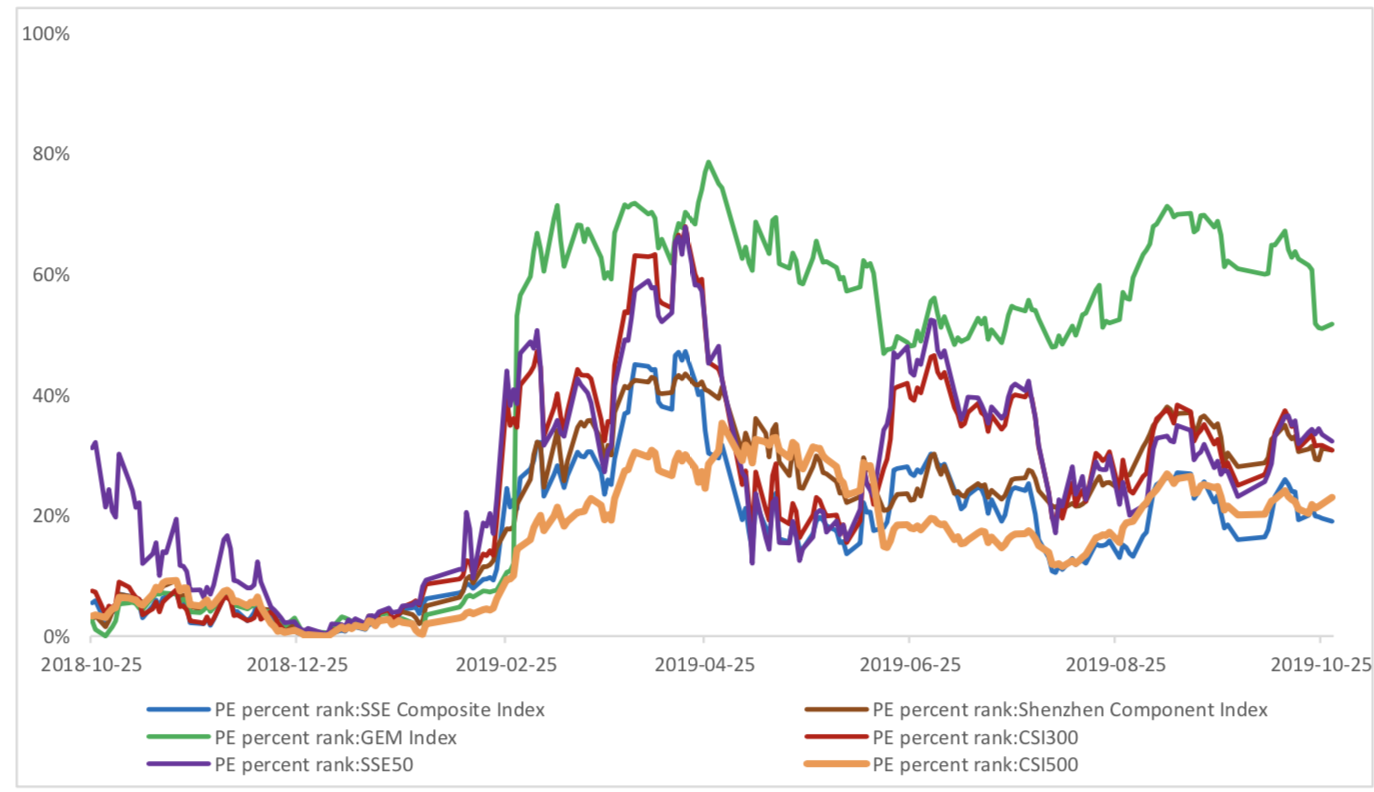
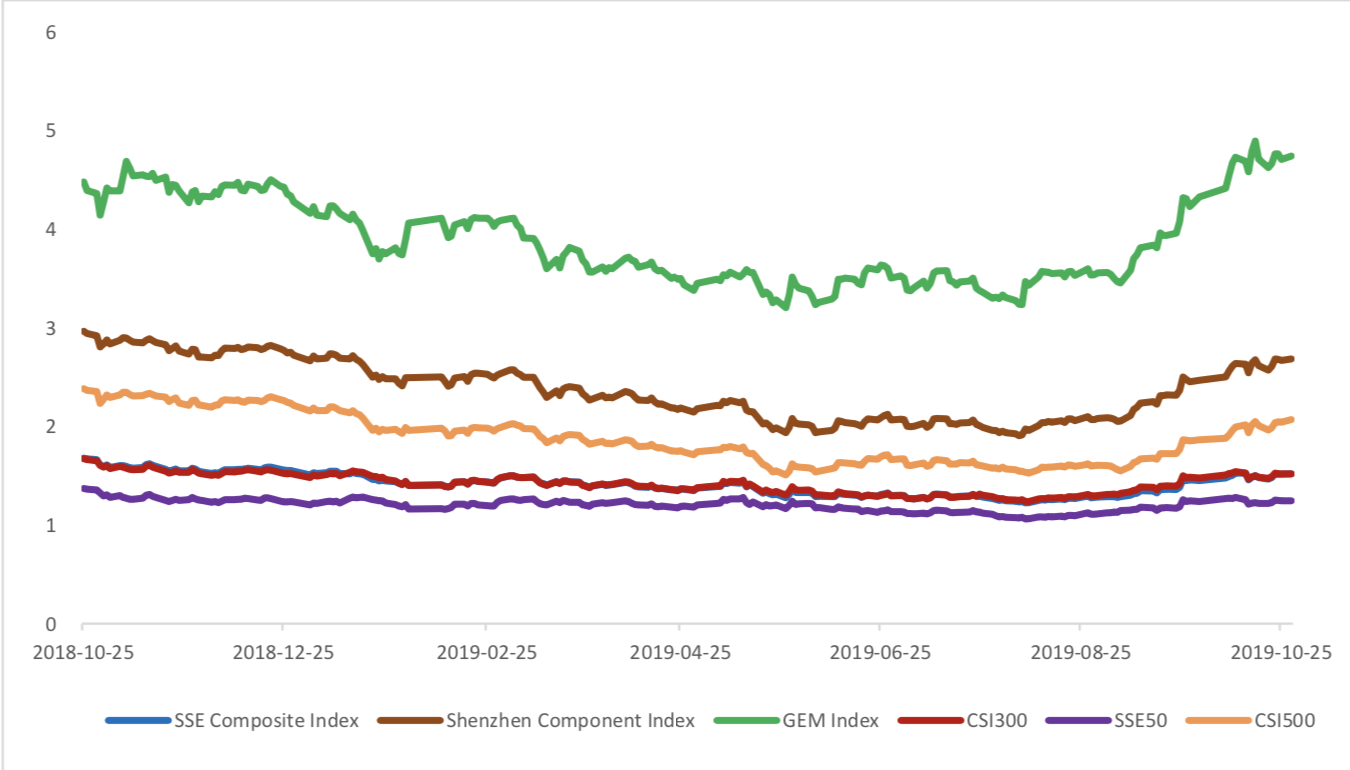
The current PE for SSE Composite Index, Shenzhen Component Index, GEM Index, CSI300, SSE50, CSI500 are 12.9494, 23.8039, 49.3326, 12.0731, 9.7514, 24.9344respectively; and these indices are at 19.00%, 30.80%, 51.70%, 30.80%, 32.30%, 23.00% percent rank level of their historic data, respectively
Graph 4: PE of 6 indices

Graph 5: PE percent rank of 6 indices (calculated by data of past 1200 trading days, only 1Y data is presented on the graph)
The current PB for SSE Composite Index, Shenzhen Component Index, GEM Index, CSI300, SSE50, CSI500 are 1.5185,2.6827,4.7397,1.5190,1.2443, 2.0682respectively, and these indices are at 32.10%, 30.10%, 38.60%, 52.20%, 55.70%, 15.30% percent rank level of their historic data, respectively.
Graph 6: PB of 6 indices
Graph 7: PB percent rank of 6 indices (calculated by data of past 1200 trading days, only 1Y data is presented on the graph)

(4) Foreign Fund Flow
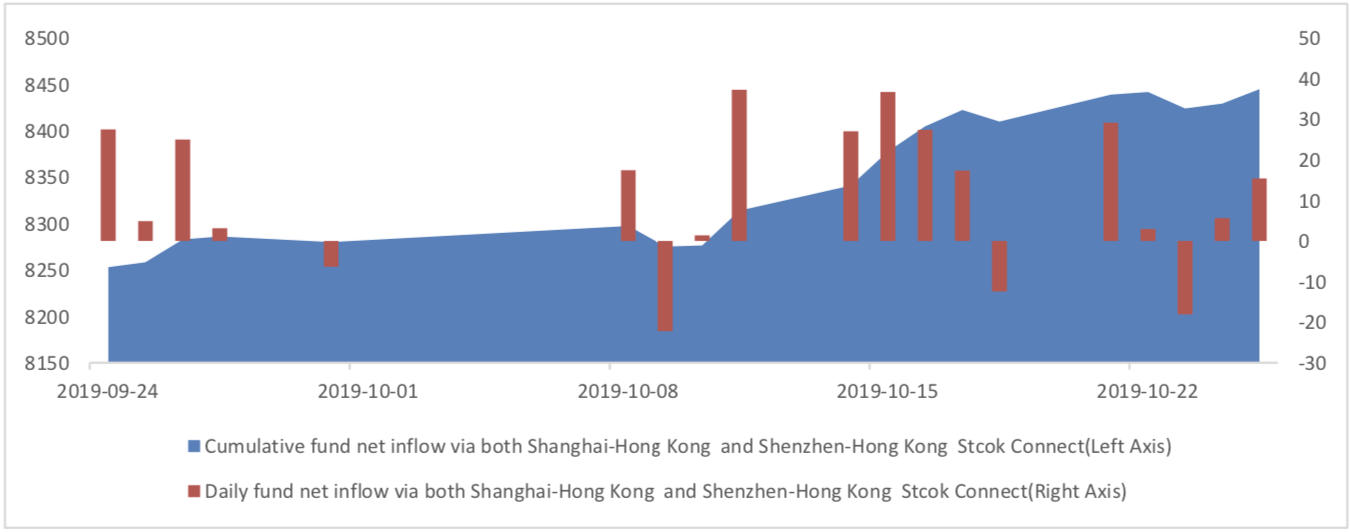
Last week, there were 5 trading days for northward channel open for stock connect programs. During last week the total foreign fund flow via Stock Connect is 3.50 billion RMB, and the cumulative inflows was 844.49 billion RMB. Specifically, the fund flow via Shanghai-Hong Kong Stock Connect is 0.70 billion RMB and the fund flow via Shenzhen-Hong Kong Stock Connect is 2.81 billion RMB.
Graph 8: Fund flow via both Shanghai and Shenzhen-Hong Kong Stock Connect in past 1M (100 million CNY)
Graph 9: Fund flow via Shenzhen-Hong Kong Stock Connect in past 1M (100 million CNY)

Graph 10: Fund flow via both Shanghai-Hong Kong Stock Connect in past 1M (100 million CNY)

2. Index Futures
(1) Trading Volume and Open Interests
During past 5 trading days the average trading volume for CSI300(IF), SSE50(IH), CSI500(IC) contracts
are 63775 (-26.06%, the previous 5-trading day period),27428 (-30.63%),66648 (-26.89%) lots, respectively. On the last trading day, the total open interests for them are 115962 (9.65%),60669 (5.11%),159982 (6.01%) lots respectively.
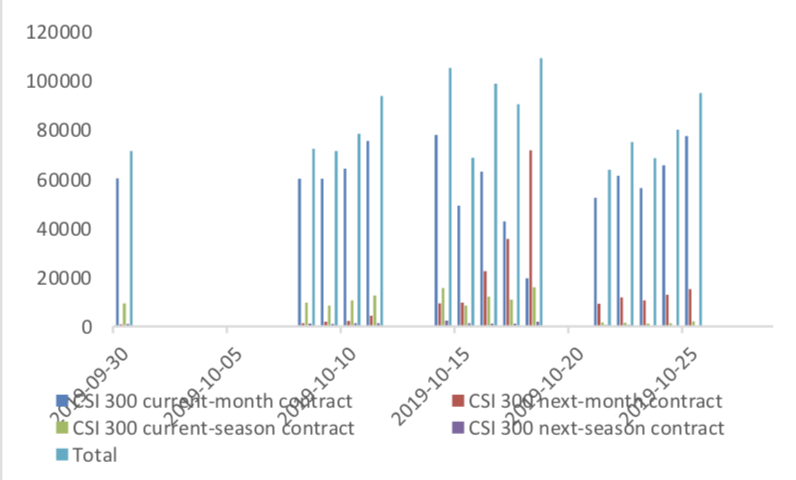
Graph 11: CSI300 Index futures’ trading volume
Graph 12: CSI300 Index futures’ open interests

Graph 13:SSE50 Index futures’ trading volume

Graph 14: SSE50 Index futures’ open interests

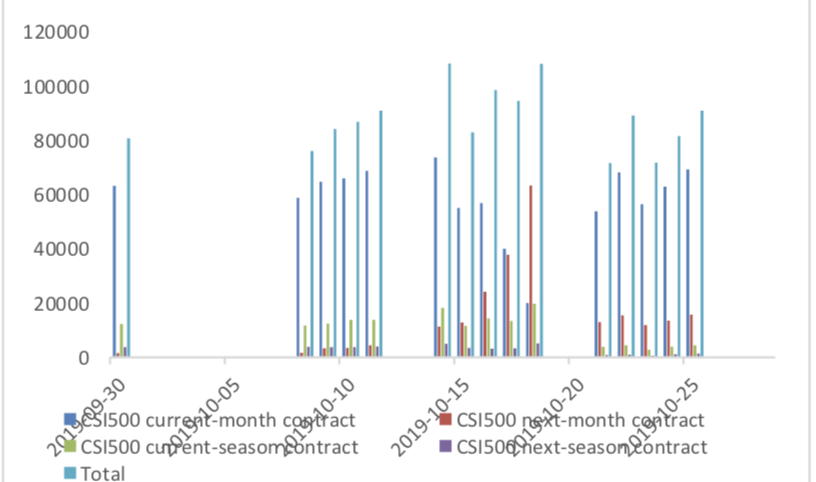
Graph 15: CSI500 Index futures’ trading volume
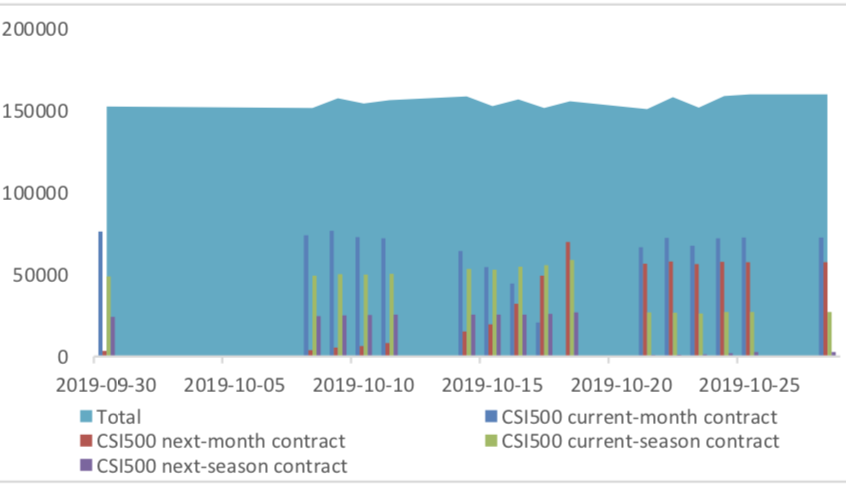
Graph 16: CSI500 Index futures’ open interests
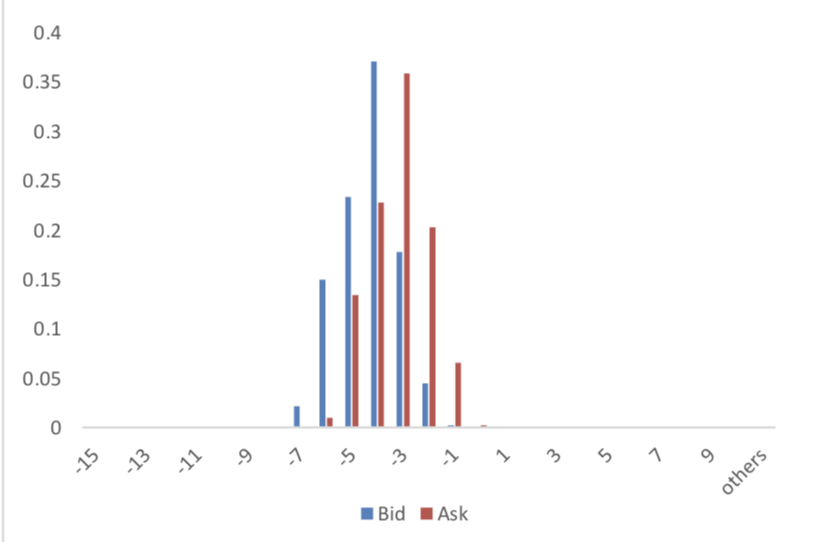
(2) Roll Level Bid-Ask Distribution
There are 5 trading days during last week, so the distribution is worked out with 36005 data points for each contract pair.
Graph 17: CSI300 Current/Next Month Contract Roll Spread Distribution (2s frequency)
Graph 18: SSE50 Current/Next Month Contract Roll Spread Distribution (2s frequency)

Graph 19: CSI500 Current/Next Month Contract Roll Spread Distribution (2s frequency)

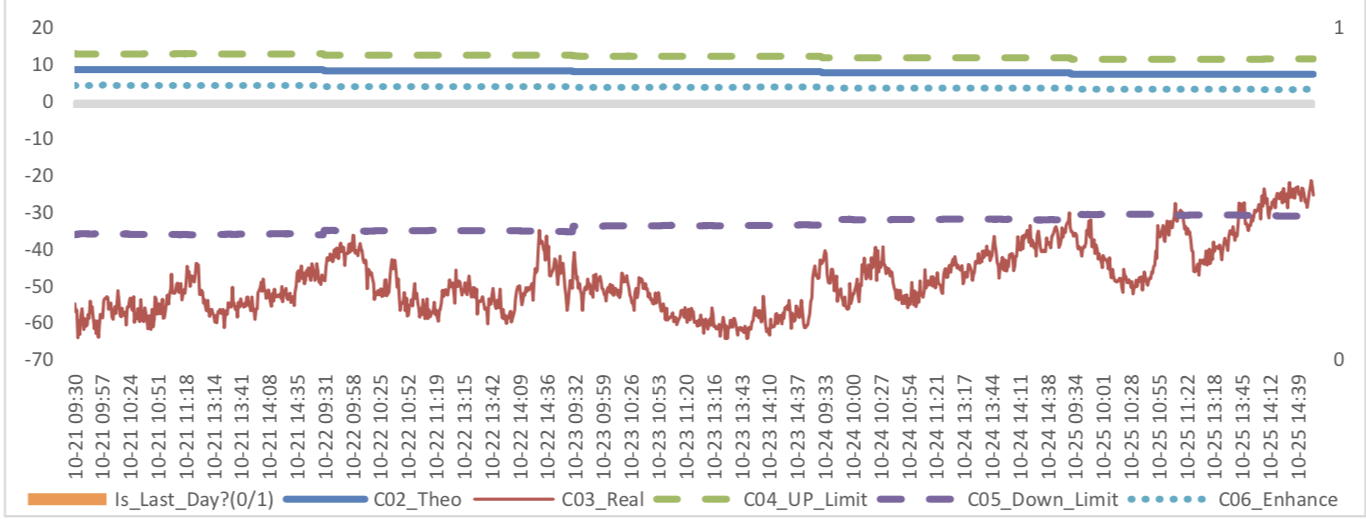
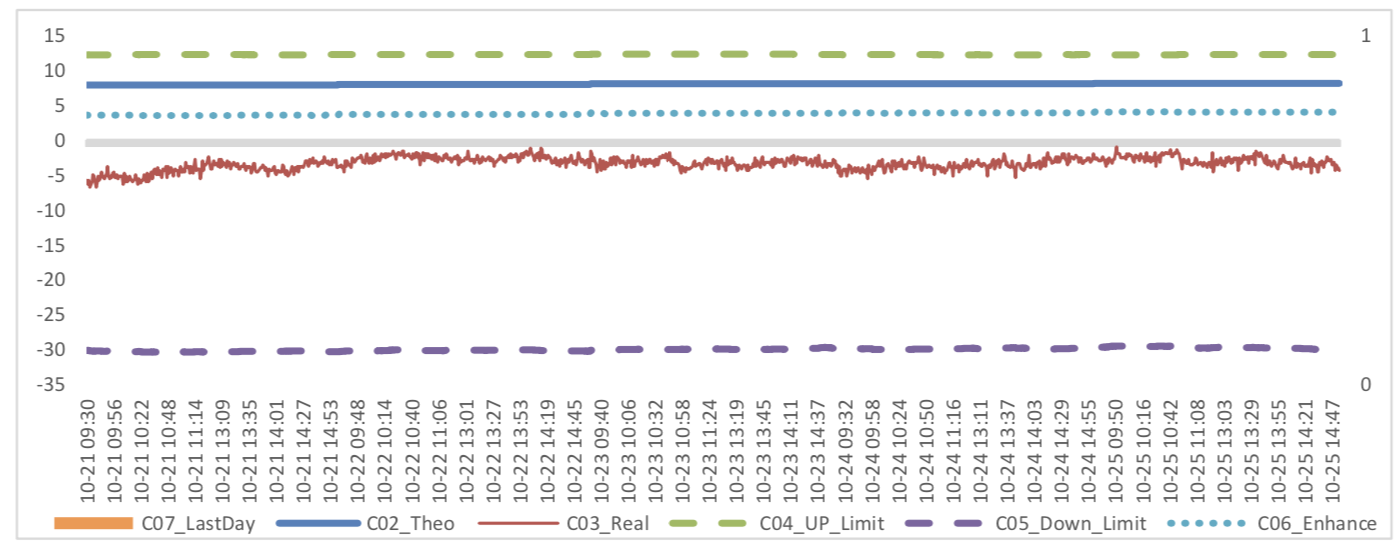
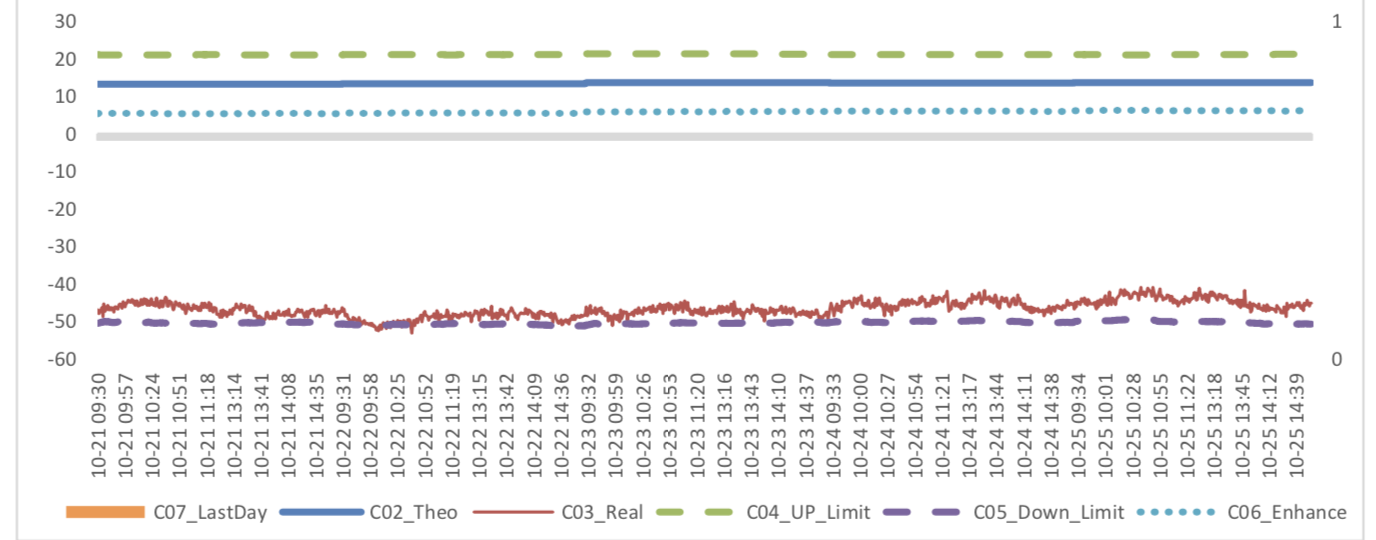
(3) Weekly Review of Future/Spot Arbitrage Opportunity
Assumption: risk-free rate: 3%; security borrowing cost: 8%; trading expense for spot: 0.025%; trading expense for futures: 0.005%; margin rates for futures contracts: 0.11 for CSI300 and SSE50, 0.13 for CSI500; margin rate for security borrowing: 0.3 (or 130% maintain rate).
When real price spread is out of theoretical range (calculated by our assumption), there exists absolute future-spot arbitrage opportunity.
Graph 20: Future (Current Month)-Spot Arbitrage Opportunity for CSI300 contract (in the view of price difference)

Graph 21: Future (Current Month)-Spot Arbitrage Opportunity for SSE50 contract (in the view of price difference)

Graph 22: Future (Current Month)-Spot Arbitrage Opportunity for CSI500 contract (in the view of price difference)
Graph 23: Future (Next Month-Current Month) Arbitrage Opportunity for CSI300 contract (in the view of price difference)

Graph 24: Future (Next Month-Current Month) Arbitrage Opportunity for SSE50 contract (in the view of price difference)
Graph 25: Future (Next Month-Current Month) Arbitrage Opportunity for CSI500 contract (in the view of price
difference)
(4) Roll Spread of Stock Index Futures Tracking
Calculated as the contract price of the current month minus the contract price of the following month, for the long roll, the positive calculation results are gains, the negative calculation results are losses. Code 00 in the figure represents the current month contract, 01 the next month contract, 02 the current quarter contract, 03 the next quarter contract.
(a)IF
Up to2019/10/25,the best roll plan is IF00-IF01,annualized roll yield in monthly term is1.97%.
Graph 26: IF Current month contract roll yield comparison (index point)

Graph 27: IF Current month contract roll yield comparison (annualized return)

(b)IH
Up to 2019/10/25,the best roll plan is IH00-IH01,annualized roll yield in monthly term is1.46%。
Graph 28: IH Current month contract roll yield comparison (index point)

Graph 29: IH Current month contract roll yield comparison (annualized return)

(c)IC
Up to2019/10/25,the best roll plan isIC00-IC01,annualized roll yield in monthly term is37.53%。
Graph 30: ICCurrent month contract roll yield comparison (index point)

Graph 31: ICCurrent month contract roll yield comparison (annualized return)

(5) Basis Tracking of Stock Index Futures
For long side, if the base difference is positive, the change of the base difference brings losses, and if the base difference is negative, the change of the base difference brings profits.
(a)IF
For long side hedge, up to 2019/10/25,IF00 and 01 were in premium others in discount. Here IF next month contract basis return annualized yield is -0.36%.
Graph 32: IF contracts basis

Table 1: IF basis return calculation

(b)IH
For long side hedge, up to 2019/10/25,IH00 was in premium others in discount. Here IH next month
contract basis return annualized yield is 0.54%.
Graph 33: IH contracts basis
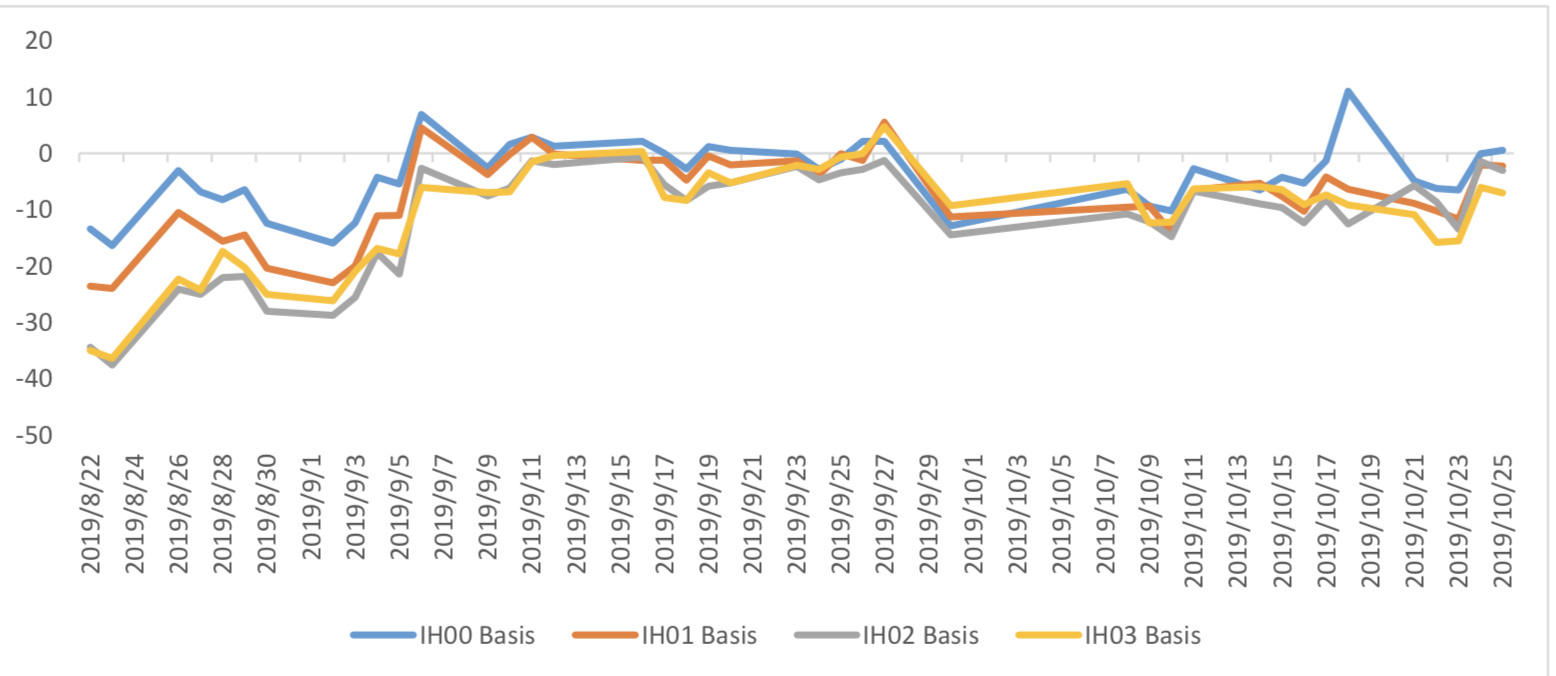
Table 2: IH basis return calculation
(c)IC
For long side hedge, up to 2019/10/25,all IC were in discount. Here IC next month contract basis
return annualized yield is 9.27%.
Graph 34: IC contracts basis

Table 3: IC basis return calculation

3. Financial Markets
(1) Interest Rates
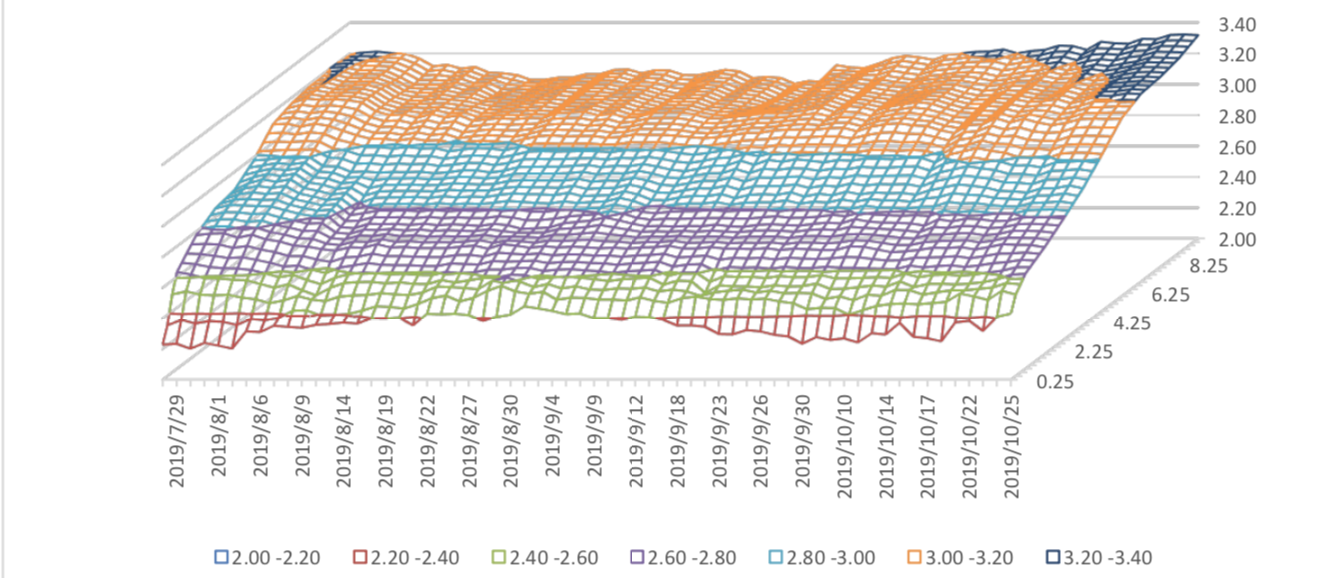
The term structure of treasury bonds’ yields is currently upward sloping in concave shape.
Specifically, last week, short-term yields short term yield of Treasury bond experienced some fluctuation and 3M yield now at 2.2%-2.4% level. Furthermore, as for long-term yield, there is a small drop. 10Y yield is about 3.0%-3.2%.
Graph 35: Term Structure Evolvement of Treasury Bonds Yields During Recent 3 Months (%)
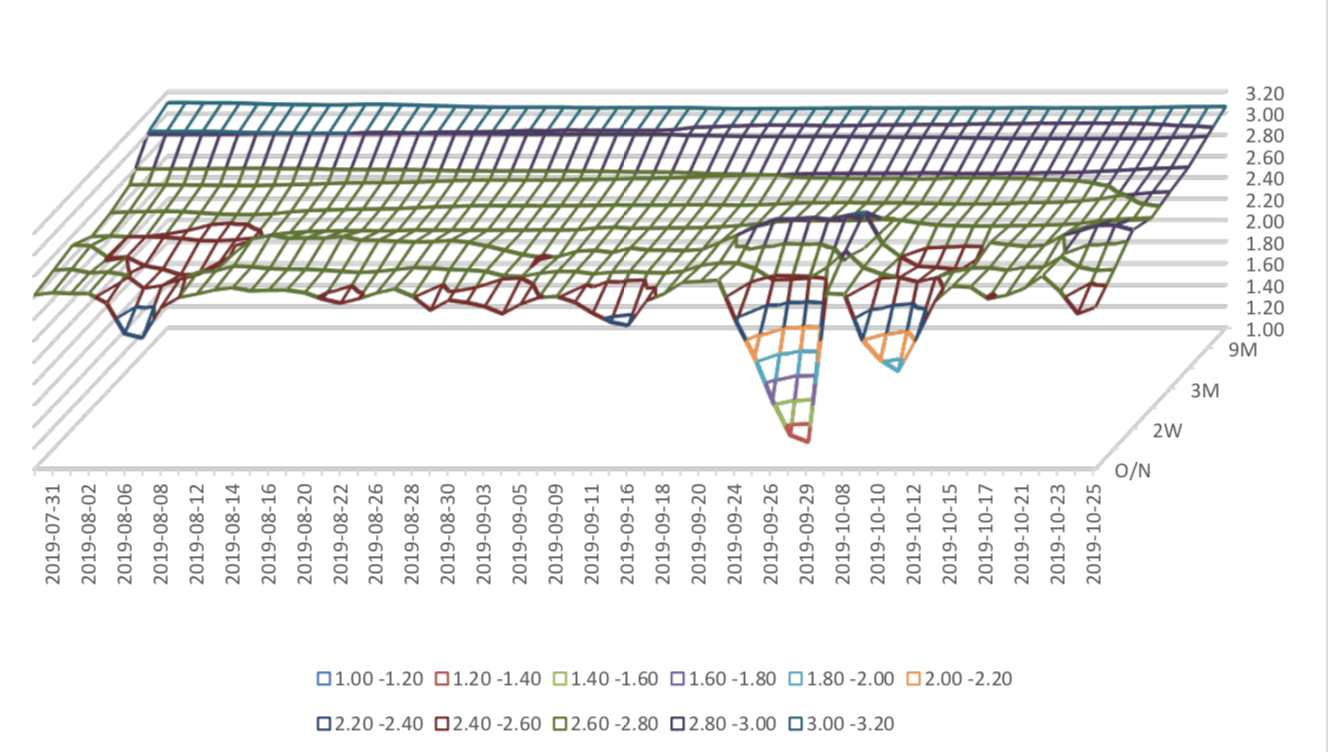
As for Shibor rates, short-term rates experienced significant fluctuation. Specifically, O/N rate experienced obvious fluctuation to 1.2%-1.4% level.
Graph 36: Term Structure Evolvement of Shibor Rates During Recent 3 Months (%)
(2) ExchangeRates
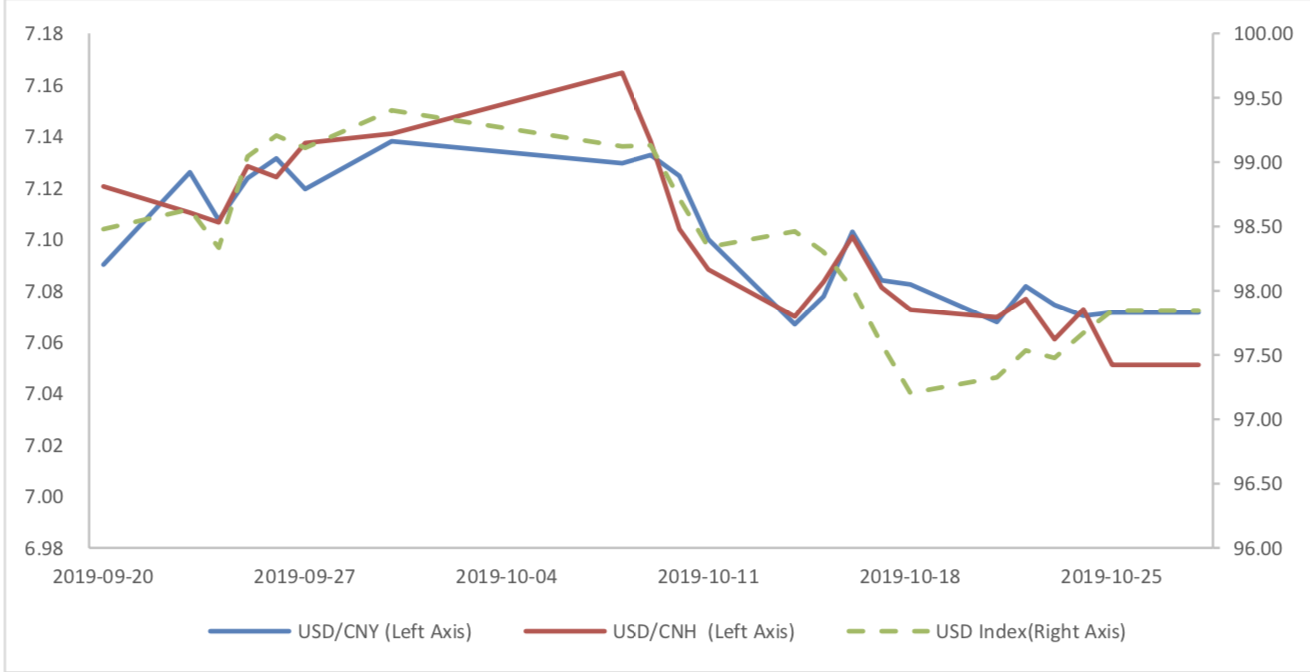
During last week, CNY/USD changed 0.054% to 7.0716 and offshore rate, CNH/USD, changed -0.26% to 7.0511 and USD index changed 0.54%.
Graph 37: USD/CNY, USD/CNH and USD Index
Currently no Comments.
Hot Topics
The 13rd China International Future Forum
The Shanghai Derivatives Energy Forum has received extensive attention from relevant industries both within and outside the borders.
Financial institutions deep explore commodity market opportunities, commodity index financial products show full-scale trend
R-Code for analysis: getKDJ
R-Code@June 06, 2016
New indicator to analyze the arbitrage opportunities between sse50 and csi500
Market review: January 11, 2017
The Great China Bubble: Anniversary Lessons and Outlook
Quant Investment in China A-share market
The hedge strategy between SSE50 and A50--Jan 13,2017
The arbitraging strategy between CSI300 and SSE50
Market review: June 17, 2016
Sleepless in London--Enda Homan(Allied Irish Banks Plc)
MSCI Rebuffs Chinese Equities for Third Time in Blow to Xi
Soros, Druckenmiller among hedgies profiting in market plunge