FangQuant › Financial Futures
Market Summary:
Last week, there was generally decrease over the market. SSE Composite Index (000001.SH) changed -1.19 % to 2938.14. Specifically, large cap shares perform slightly better than small cap shares and we can observe that SSE50 did better than CSI500 (-0.67% vs -1.85%). The average daily turnover of the whole market during past 5 trading days is 414.91 billion CNY, it decreased 3.56% compared with the previous 5- trading day period.
Both price data and finance data are released last week. CPI touched the red line, mainly because the pig price rose sharply, while the core CPI was still stable, and some factors to stabilize the price were also introduced. The ring ratio of pork price has dropped at a high level. In September, the central bank reduced the bank reserve ratio comprehensively and structurally, and the market liquidity should be improved. In the face of downward pressure on the economy, counter cyclical regulation will continue to strengthen. But at the same time, it is restricted by price and other factors.
Last week, the net inflow of northbound funds occurred in four trading days, with a weekly net inflow of nearly 10 billion yuan. Market is more optimistic after holidays and China-US negotiation.
As for arbitrage opportunity, all futures current-month contracts show some room for arbitrage opportunities. Price spread for CSI500 next-month/current month contracts show room for arbitrage.
News:
(1) New Beijing News: Xu Yilin, deputy general manager of Shanghai Stock Exchange, said that it is expected that the number of listed enterprises on STAR Market will reach 50 in the first ten days of November, and the number of registered enterprises on STAR Market is expected to reach 100 by the end of this year. Shanghai Stock Exchange will vigorously promote the listing of industry benchmark enterprises and leading enterprises on science and technology innovation board, and actively promote the listing of red chip enterprises, spin off listing and other policies to be implemented as soon as possible.
(2) New Beijing News: Li Chao, vice chairman of the CSRC, will give full play to the role of STAR Market pilot field, introduce system rules such as refinancing and spin off listing, refine relevant arrangements for the listing of red chip enterprises, attract more outstanding science and technology innovation enterprises to be listed, and summarize replicable and generalizable experience.
(3) Wind: the 40th international monetary and Financial Committee (IMFC) meeting was held in Washington, D.C. Yi Gang, governor of the People's Bank of China, introduced China's economic situation and said that in recent years, the multilateral trading system has encountered severe challenges. China is willing to cooperate with all parties to jointly safeguard the multilateral trading system based on rules. China will continue to promote the opening up of the financial industry, including lifting the share ratio limit of foreign financial institutions and providing an equal competitive environment for Chinese and foreign financial institutions.
(4) Xinhua News Agency: according to the report of 40 years of multinational companies' investment in China, as of the end of 2018, China has set up 961000 foreign-funded enterprises and actually used US $2.1 trillion in foreign investment. At present, foreign-invested enterprises account for less than 3% of China's enterprises, but they have contributed nearly half of China's foreign trade, a quarter of the output value and profits of Industrial Enterprises above Designated Size, and a fifth of their tax revenue, which has become an important part of China's economy.
(5) Xinhua News Agency: the United States formally imposes tariffs on EU products exported to the United States worth 7.5 billion US dollars. According to a statement released earlier this month by the U.S. trade representative's office, the U.S. side imposed 10% tariffs on EU large civil aircraft and 25% on EU agricultural and other products. Analysts believe the move could further aggravate economic and trade disputes between the US and Europe.
(6) Economic observation network: Yao Hongyao, director of global capital management giant Amben standard investment and head of China's stock investment: China's capital market has a great attraction at present, and it is still a good time to invest in a shares; the market performance of a shares is not highly related to the global market, and the overlap with foreign indexes is relatively low, and the A shares market has also won the world's markets in recent years, which is a good opportunity for China to invest in a shares. International investors are very attractive.
1. StockMarket
(1) Indices Performance
During last week, SSE Composite Index (000001.SH) changed -1.19 % to 2938.14, SHENZHEN COMPONENT INDEX (399001.SZ) changed -1.38 % to 9533.51, ChiNext Price Index (399006.SZ) changed -1.09 % to 1648.63, CSI 300 INDEX (000300.SH) changed -1.08 % to 3869.38, CSI SmallCap 500 index (000905.SH) changed -1.85 % to 4961.81, SSE 50 Index (000016.SH) changed -0.67 % to 2963.18.
Graph 1: Indices Performance over past 3 months

The average daily turnover of the whole market during past 5 trading days is 414.91 billion CNY, it decreased 3.56% compared with the previous 5-trading day period.
Graph 2: Market turnover

(2) Sectors Performance
In the view of sectors, during last week (from 2019-10-11 to 2019-10-18), 8 of 24 Wind Level-2 sector(s) increased while 16 sector(s) dropped. Specifically, Banks(2.12%), Insurance (1.31%) and Health Care Equipment & Services(1.17%) did the best performance while Semiconductors & Semiconductor Equipment (-6.69%), Technology Hardware & Equipment(-2.57%) and Automobiles & Components(-2.17%) did the worst performance.
Graph 3: Sectors performance under Wind Level-2 classification (%)
(3) Indices Valuation (TTM)
The current PE for SSE Composite Index, Shenzhen Component Index, GEM Index, CSI300, SSE50, CSI500 are 12.9703, 23.7739, 53.3718, 12.0823, 9.7400, 24.4698respectively; and these indices are at 19.60%, 30.60%, 62.00%, 31.20%, 32.30%, 20.80% percent rank level of their historic data, respectively
Graph 4: PE of 6 indices

Graph 5: PE percent rank of 6 indices (calculated by data of past 1200 trading days, only 1Y data is presented on the graph)

The current PB for SSE Composite Index, Shenzhen Component Index, GEM Index, CSI300, SSE50, CSI500 are 1.5185,2.6827,4.7397,1.5190,1.2443, 2.0682respectively, and these indices are at 32.10%, 30.10%, 38.60%, 52.20%, 55.70%, 15.30% percent rank level of their historic data, respectively.
Graph 6: PB of 6 indices

Graph 7: PB percent rank of 6 indices (calculated by data of past 1200 trading days, only 1Y data is presented on the graph)

(4) Foreign Fund Flow
Last week, there were 5 trading days for northward channel open for stock connect programs. During last week the total foreign fund flow via Stock Connect is 9.60 billion RMB, and the cumulative inflows was 840.99 billion RMB. Specifically, the fund flow via Shanghai-Hong Kong Stock Connect is 2.63 billion RMB and the fund flow via Shenzhen-Hong Kong Stock Connect is 6.97 billion RMB.
Graph 8: Fund flow via both Shanghai and Shenzhen-Hong Kong Stock Connect in past 1M (100 million CNY)

Graph 9: Fund flow via Shenzhen-Hong Kong Stock Connect in past 1M (100 million CNY)

Graph 10: Fund flow via both Shanghai-Hong Kong Stock Connect in past 1M (100 million CNY)

2. Index Futures
(1) Trading Volume and Open Interests
During past 5 trading days the average trading volume for CSI300(IF), SSE50(IH), CSI500(IC) contracts
are 73495 (-12.87%, the previous 5-trading day period),33975 (-6.97%),76844 (-13.89%) lots, respectively. On the last trading day, the total open interests for them are 112404 (-4.24%),61384 (-1.88%),155774 (- 1.80%) lots respectively.
Graph 11: CSI300 Index futures’ trading volume

Graph 12: CSI300 Index futures’ open interests

Graph 13:SSE50 Index futures’ trading volume

Graph 14: SSE50 Index futures’ open interests

Graph 15: CSI500 Index futures’ trading volume

Graph 16: CSI500 Index futures’ open interests

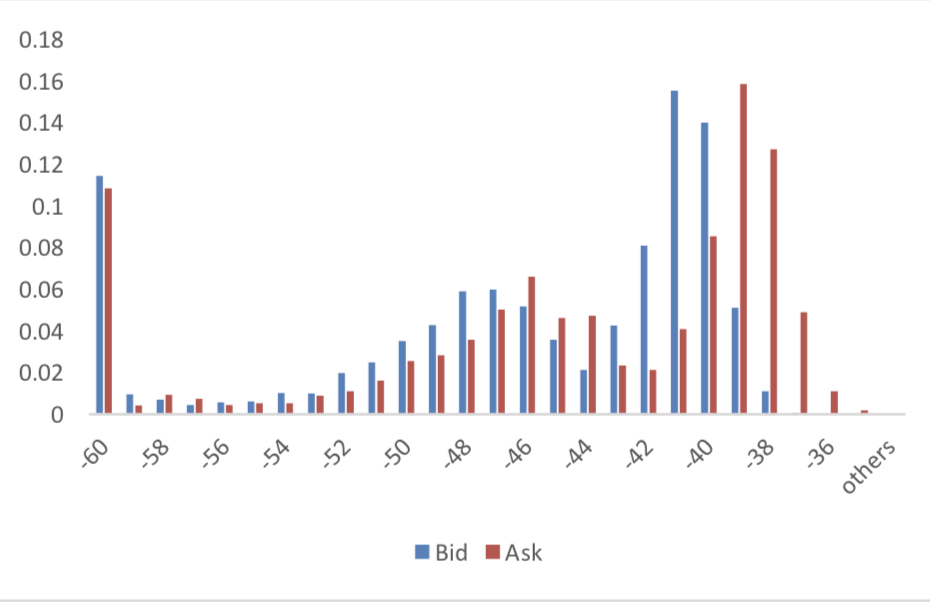
(2) Roll Level Bid-Ask Distribution
There are 5 trading days during last week, so the distribution is worked out with 36005 data points for each contract pair.
Graph 17: CSI300 Current/Next Month Contract Roll Spread Distribution (2s frequency)

Graph 18: SSE50 Current/Next Month Contract Roll Spread Distribution (2s frequency)

Graph 19: CSI500 Current/Next Month Contract Roll Spread Distribution (2s frequency)
(3) Weekly Review of Future/Spot Arbitrage Opportunity
Assumption: risk-free rate: 3%; security borrowing cost: 8%; trading expense for spot: 0.025%; trading expense for futures: 0.005%; margin rates for futures contracts: 0.11 for CSI300 and SSE50, 0.13 for CSI500; margin rate for security borrowing: 0.3 (or 130% maintain rate).
When real price spread is out of theoretical range (calculated by our assumption), there exists absolute future-spot arbitrage opportunity.
Graph 20: Future (Current Month)-Spot Arbitrage Opportunity for CSI300 contract (in the view of price difference)


Graph 22: Future (Current Month)-Spot Arbitrage Opportunity for CSI500 contract (in the view of price difference)
Graph 23: Future (Next Month-Current Month) Arbitrage Opportunity for CSI300 contract (in the view of price difference)

Graph 24: Future (Next Month-Current Month) Arbitrage Opportunity for SSE50 contract (in the view of price difference)

Graph 25: Future (Next Month-Current Month) Arbitrage Opportunity for CSI500 contract (in the view of price
difference)

(4) Roll Spread of Stock Index Futures Tracking
Calculated as the contract price of the current month minus the contract price of the following month, for the long roll, the positive calculation results are gains, the negative calculation results are losses. Code 00 in the figure represents the current month contract, 01 the next month contract, 02 the current quarter contract, 03 the next quarter contract.
(a)IF
Up to2019/10/18,the best roll plan is IF00-IF01,annualized roll yield in monthly term is8.19%。
Graph 26: IF Current month contract roll yield comparison (index point)

Graph 27: IF Current month contract roll yield comparison (annualized return)

(b)IH
Up to 2019/10/18,the best roll plan is IH00-IH01,annualized roll yield in monthly term is7.05%。 Graph 28: IH Current month contract roll yield comparison (index point)

Graph 29: IH Current month contract roll yield comparison (annualized return)

(c)IC
Up to2019/10/18,the best roll plan isIC00-IC01,annualized roll yield in monthly term is20.07%。
Graph 30: ICCurrent month contract roll yield comparison (index point)

Graph 31: ICCurrent month contract roll yield comparison (annualized return)

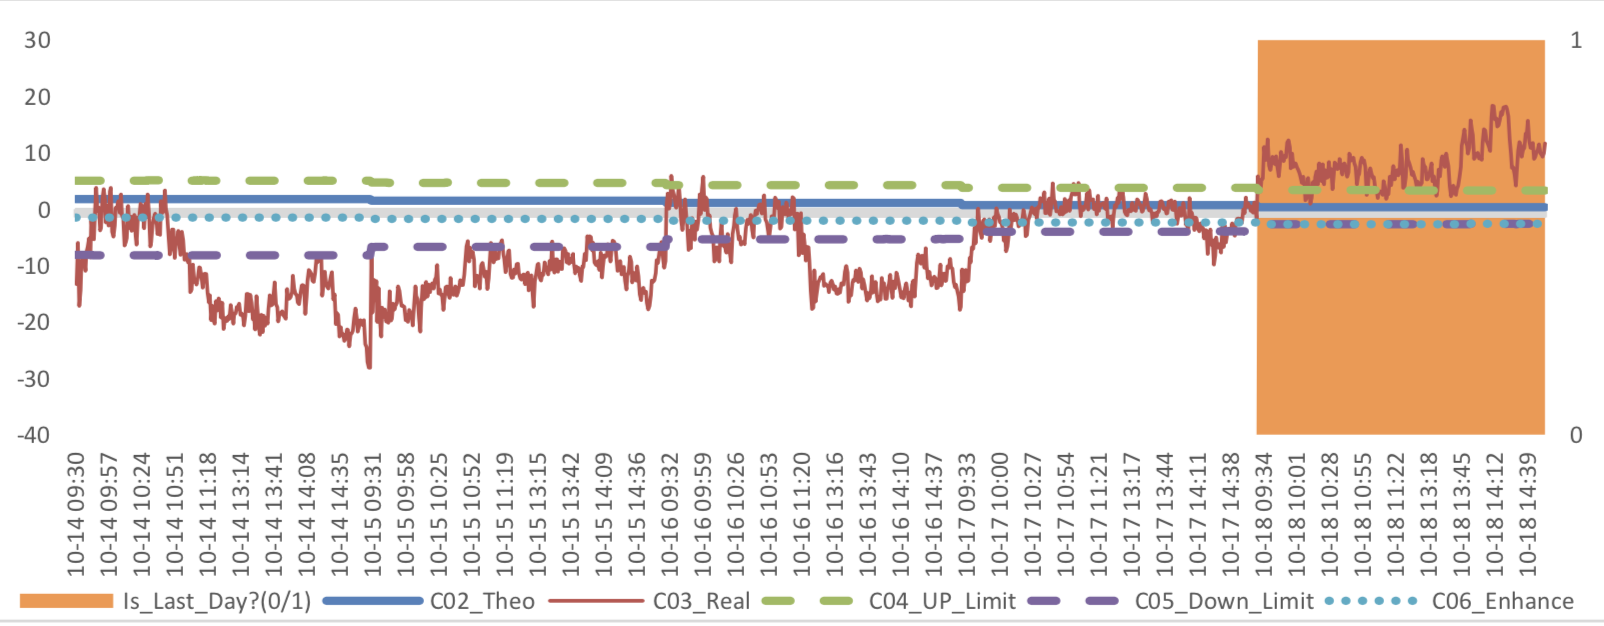
(5) Basis Tracking of Stock Index Futures
For long side, if the base difference is positive, the change of the base difference brings losses, and if the base difference is negative, the change of the base difference brings profits.
(a)IF
For long side hedge, up to 2019/10/18,IF00 was in premium others in discount. Here IF next month contract basis return annualized yield is 4.71%。
Graph 32: IF contracts basis

Table 1: IF basis return calculation

(b)IH
For long side hedge, up to 2019/10/18,IH00 was in premium others in discount. Here IH next month
contract basis return annualized yield is 2.58%。
Graph 33: IH contracts basis

Table 2: IH basis return calculation

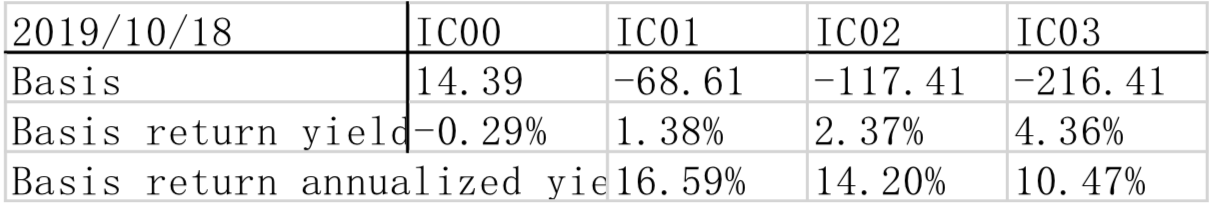
(c)IC
For long side hedge, up to 2019/10/18,IC00 was in premium and others in discount. Here IC next
month contract basis return annualized yield is 16.59%.
Graph 34: IC contracts basis

Table 3: IC basis return calculation
3. Financial Markets
(1) Interest Rates
The term structure of treasury bonds’ yields is currently upward sloping in concave shape.
Specifically, last week, short-term yields short term yield of Treasury bond experienced some fluctuation and 3M yield now at 2.2%-2.4% level. Furthermore, as for long-term yield, there is a small drop. 10Y yield is about 3.0%-3.2%.
Graph 35: Term Structure Evolvement of Treasury Bonds Yields During Recent 3 Months (%)

As for Shibor rates, short-term rates experienced significant fluctuation. Specifically, O/N rate experienced obvious fluctuation to 1.2%-1.4% level.
Graph 36: Term Structure Evolvement of Shibor Rates During Recent 3 Months (%)

(2) ExchangeRates
During last week, CNY/USD changed 0.221% to 7.0825 and offshore rate, CNH/USD, changed 0.04% to 7.0726 and USD index changed -1.28%.
Graph 37: USD/CNY, USD/CNH and USD Index

Macroeconomic Topic (1):
According to the released price data by the national bureau of statistics. The data showed that year-on- year CPI kept in high position. PPI is still in deflation region. The data showed that the year-on-year and ring ratio CPI were 3 percent and 0.9 percent, respectively, compared with pre value of 2.8 percent and 0.7 percent, respectively. Year-on-year and ring ratio PPI were -1.2 percent and 0.1 percent, respectively, compared with the previous figures of -0.8 percent and -0.1 percent, respectively.
September Price Data
(1) CPI Data
Graph A: CPI Data

CPI is mainly affected by the price of pork. From the perspective of core CPI, it still maintained a stable level of 1.5% year on year. However, the core CPI rose to 0.2% on a month on month basis, compared with the previous value of 0.1%. It shows that in the case of low oil prices, the main factor driving the price rise is food prices.
Graph B: year-on-year CPI: by Food, Non-Food, Core, Services, Consumer Goods (%)

Residence, education, culture and entertainment, healthcare, household goods and service prices rose slightly, with growth rates of 0.7%, 1.7%, 2.2% and 0.6% respectively. Transportation and communication dropped 2.9%
Graph C: year-on-year CPI: by Food Alcohol and Tobacco, Clothing, Residence, Household Goods & Services, Transportation & Communications, Education, Culture & Entertainment, Healthcare (%)

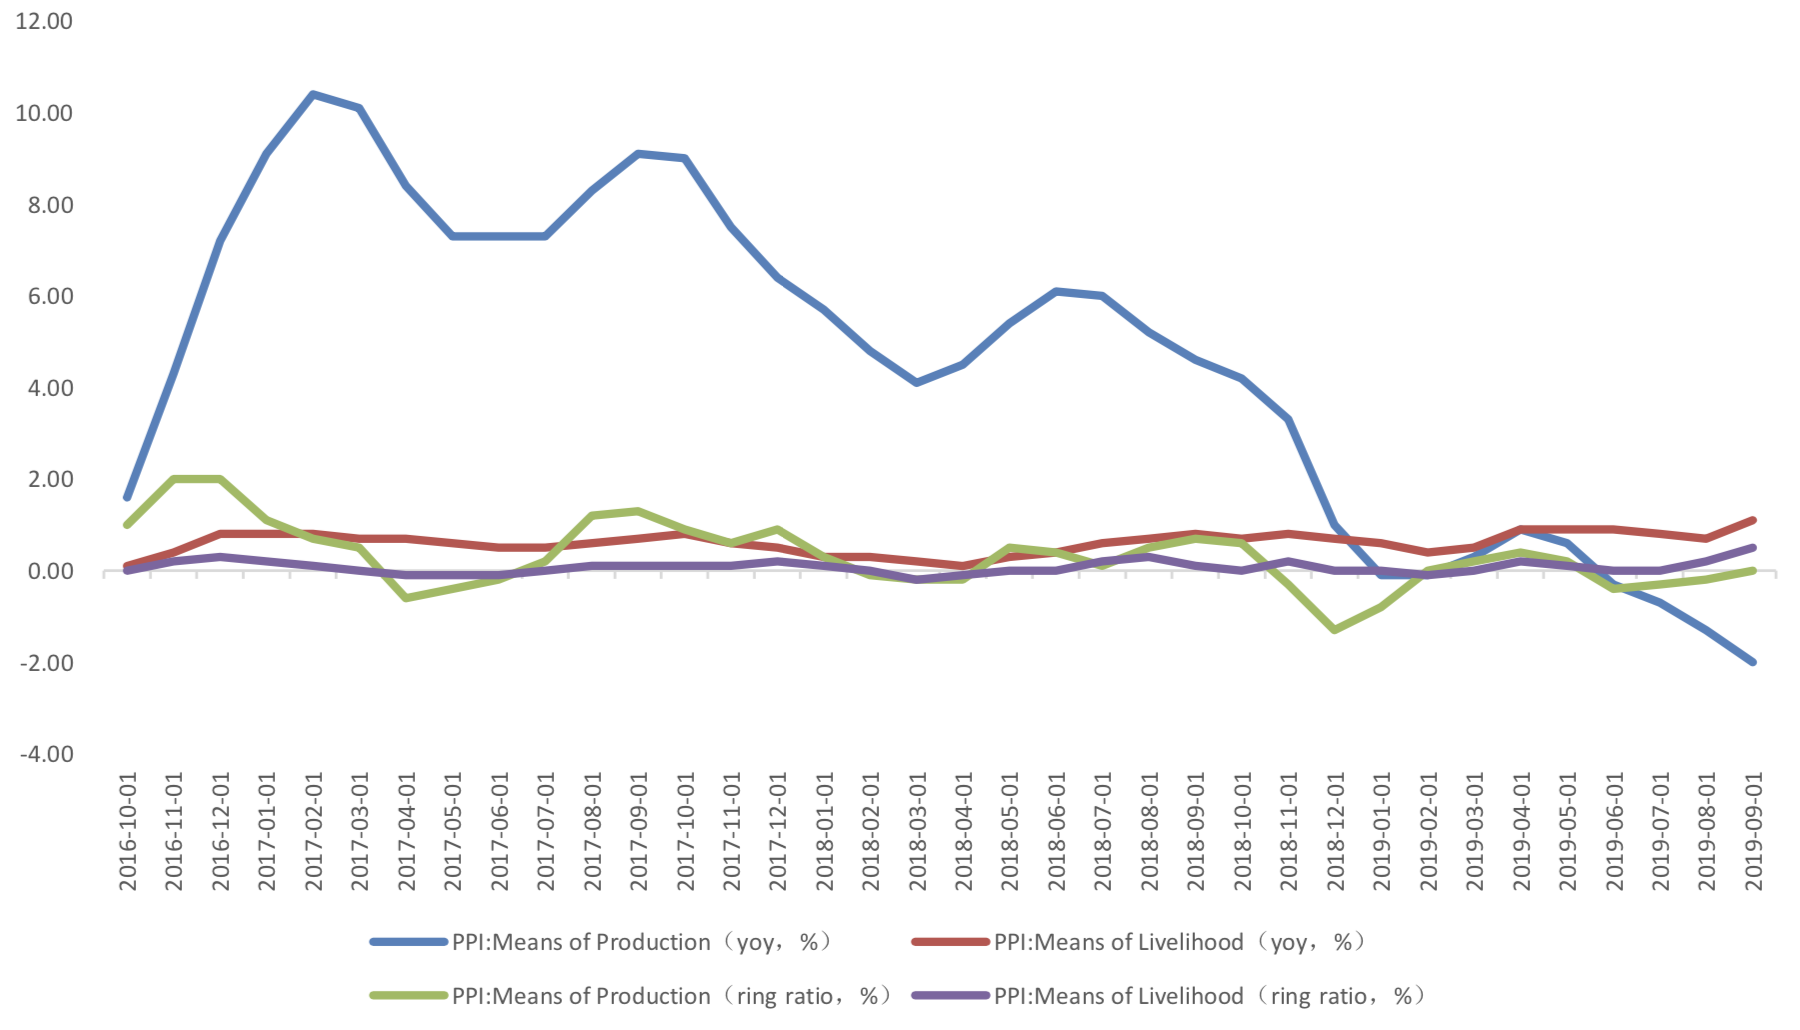
(2) PPI Data
Graph D: PPI Data (%)

The means of production PPI was -2 percent year-on-year, decreased 0.7 percentage point from the previous month. The means of livelihoods PPI, was 1.1 percent, compared with the previous value of 0.7 percent. The mining industry, raw material industry and processing industry increased by 4.2%, - 0.6% and 0.4% respectively. From the perspective of the three major industries of means of production, the decline trend of raw material industry and processing industry in the middle and lower reaches is relatively obvious, while the decline trend of mining industry is relatively moderate.
Graph E: PPI Data, by means of production and means of livelihoods
(3) Summary
CPI touched the red line, mainly because the pig price rose sharply, the core CPI was still stable, and some factors to stabilize the price were also introduced. The month on month ratio of pig price has dropped at a high level, plus the tail raising factor decreased and the negative factor increased. After CPI touched the red line, it is expected to return to below 3% in the fourth quarter.
Macroeconomic Topic(2):
The data show that, in September, the scale of new social financing continued the rebound, showing a significant increase, reaching 2272.5 billion yuan, compared with the previous value of 2017.5 billion yuan. But the month on month increase was less than that in August, from 86.12% to 12.64%. On a year-on-year basis, from 3.29% to 6.48% on a year-on-year basis.
September Finance Data
(3) Social Financing Data
Graph A: Total Social Financing Data(100m RMB)

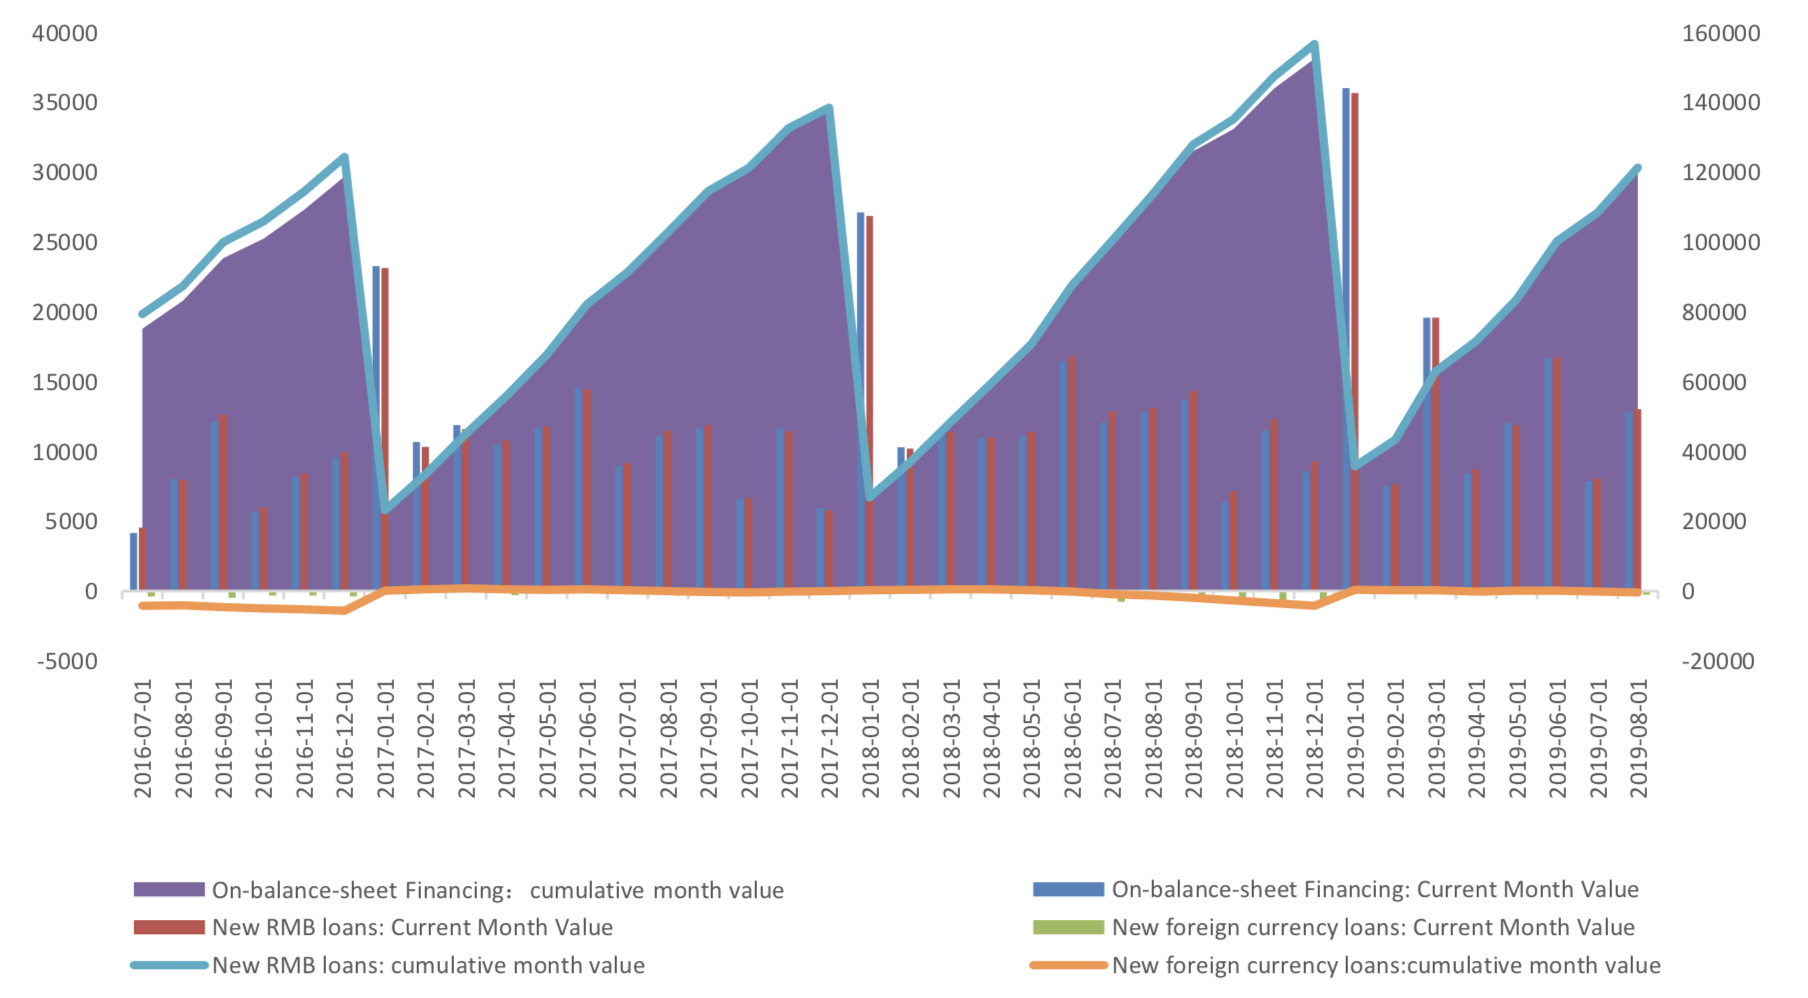
In on-balance-sheet financing, in terms of RMB loans, 1761.2 billion yuan was added in September, rose from 1304.5 billion yuan from last month, and also above than value, 1434 billion, at the same period of last year. New RMB loans accounted for 77.5% of the new social financing scale.
Graph B: On-balance-sheet Financing Data(100m RMB)
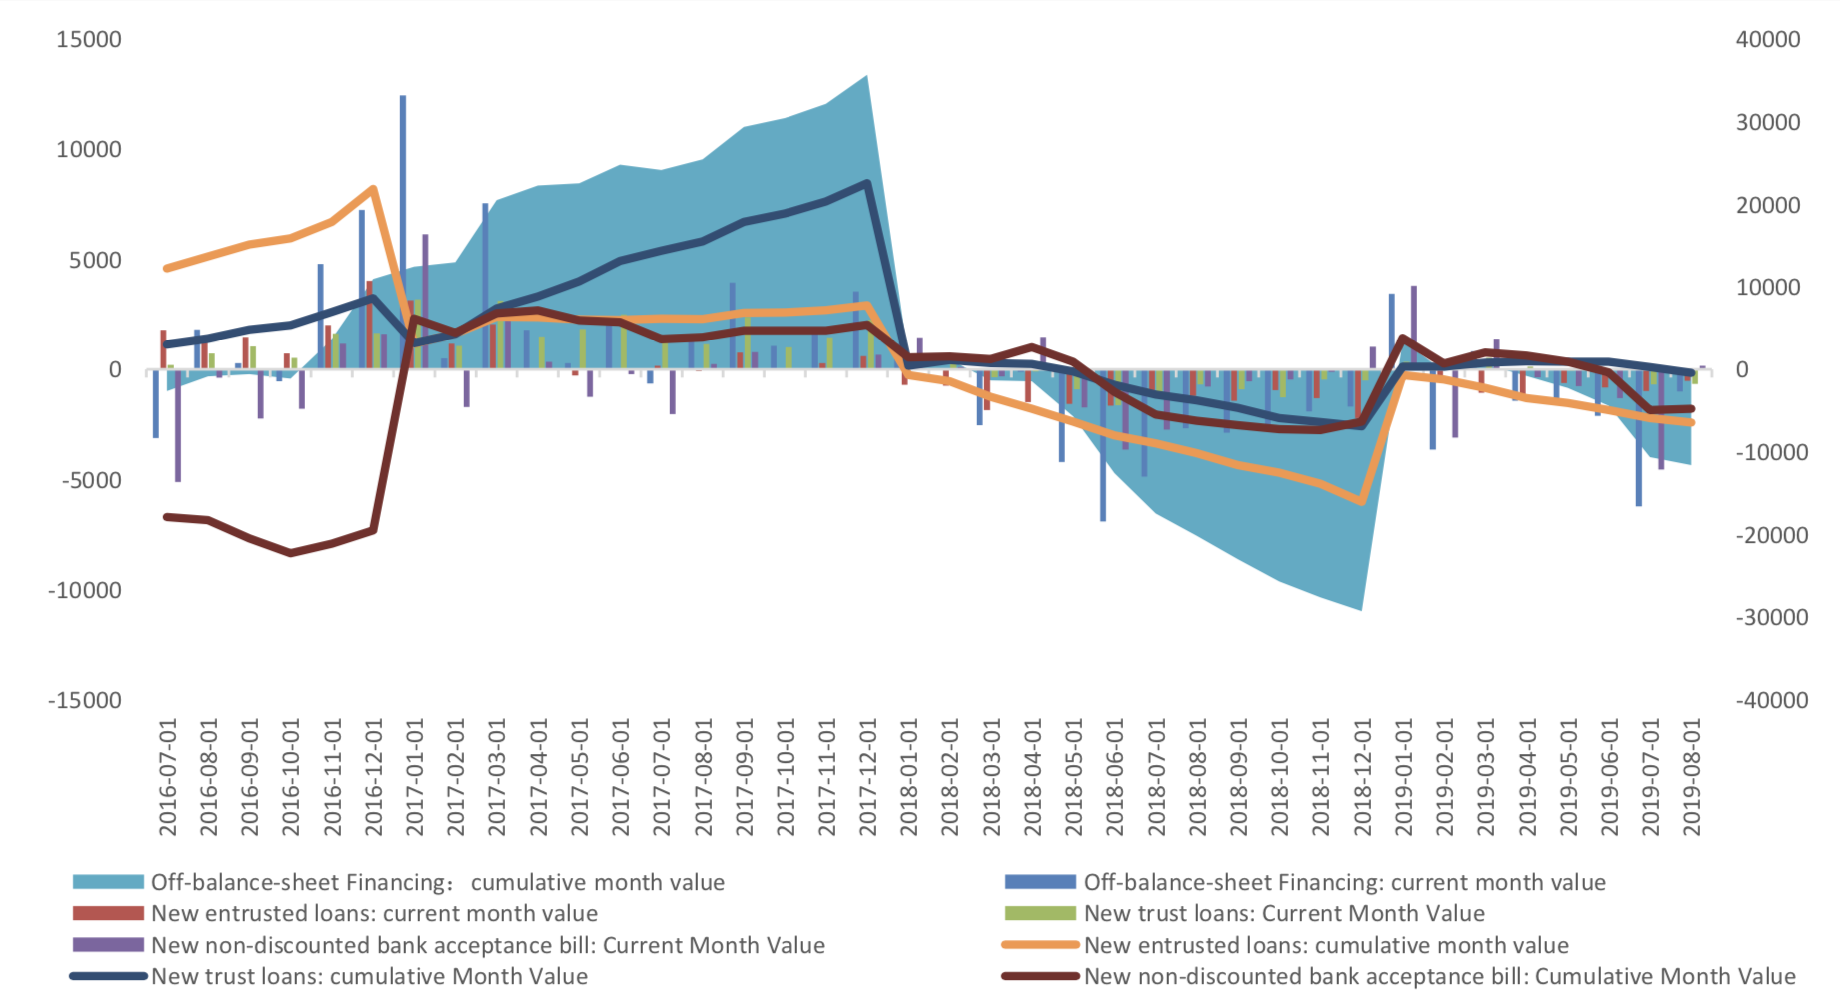
From the perspective of new off-balance sheet financing, it still faced an obvious contraction in September. Contraction continues to slow down, which is basically the same as that in August. In September it report - 112.472 billion yuan, the previous value is - 101.4 billion yuan.
Graph C: Off-balance-sheet Financing Data(100m RMB)
In terms of the direct financing, the direct financing of enterprises was 189.9 billion yuan, obviously higher compared with the same period last year due to low base, but with the ring ratio decreased substantially, mainly because of the decrease in corporate bond financing, only 161 billion yuan, drop 48.7% in ring ratio.
Graph D: Direct Financing Data(100m RMB)

(4) Monetary Data
In September, M2 rose from 8.2 to 8.4%, and M1 kept 3.4%, and the difference between M2 and M1 increase from 4.8% to 5%.
Graph E: M1 and M2 data

(3) Summary
In September, the central bank reduced the bank reserve ratio comprehensively and structurally, and the market liquidity should be improved. In the face of downward pressure on the economy, counter cyclical regulation will continue to strengthen. But at the same time, it is restricted by price and other factors.
Copyright by fangquant.com
Currently no Comments.
Hot Topics
The 13rd China International Future Forum
The Shanghai Derivatives Energy Forum has received extensive attention from relevant industries both within and outside the borders.
Financial institutions deep explore commodity market opportunities, commodity index financial products show full-scale trend
R-Code for analysis: getKDJ
R-Code@June 06, 2016
New indicator to analyze the arbitrage opportunities between sse50 and csi500
Market review: January 11, 2017
The Great China Bubble: Anniversary Lessons and Outlook
Quant Investment in China A-share market
The hedge strategy between SSE50 and A50--Jan 13,2017
The arbitraging strategy between CSI300 and SSE50
Market review: June 17, 2016
Sleepless in London--Enda Homan(Allied Irish Banks Plc)
MSCI Rebuffs Chinese Equities for Third Time in Blow to Xi
Soros, Druckenmiller among hedgies profiting in market plunge