FangQuant › Financial Futures
Market Summary:
Last week, there was generally increase over the market. SSE Composite Index (000001.SH) changed 2.36 % to 2973.66. Specifically, large cap shares perform slightly better than small cap shares and we can observe that SSE50 did better than CSI500 (2.95% vs 2.32%).
On last Friday, a new round of high-level economic and trade consultation between China and the United States in Washington. Under the guidance of the important consensus of the two heads of state, the two sides held efficient and constructive discussions on economic and trade issues of common concern. The two sides have made substantial progress in agriculture, intellectual property protection, exchange rate, financial services, expanding trade cooperation, technology transfer and dispute settlement. The two sides discussed arrangements for follow-up consultations and agreed to work together towards a final agreement. Furthermore, US president Trump said that he believed that the United States and China were "very close" to ending the trade war. This result should restore market confidence and boost it.
As for arbitrage opportunity, all futures current-month contracts show some room for arbitrage opportunities. No price spread for next-month/current month contracts show room for arbitrage.
News:
(1) The People's Daily published another blockbuster article on the new round of high-level economic and trade consultation between China and the United States: Cooperation is the only right choice for the two countries. Both sides should make every effort to ensure that bilateral relations develop along the right track and continuously improve the well-being of the two countries and the people of the world.
(2) U.S. President Trump said that he believed that the United States and China were "very close" to ending the trade war and that the agreement they would reach would benefit both the United States and China and the world.
(3) Bell of People's Daily: Substantive progress has been made in the new round of high-level economic and trade consultation between China and the United States. The two sides discussed the arrangements for follow-up consultation and agreed to work together towards a final agreement. Only by abolishing all tariffs and letting the trade war stop, can we finally solve the economic and trade problems by taking constructive
actions to achieve trade balance and seeking the greatest common interests. 。
(4) Xinhua News Agency: The China Institute of Information and Communications (CITIC) released a report entitled New Global Digital Economy Prospect (2019). It shows that in 2018, the US digital economy ranked first in the world, reaching 12.34 trillion US dollars. China remains the second largest digital economy in the world, reaching 4.73 trillion US dollars.
(5) The central bank: try to avoid the market fluctuation caused by the identification of bond assets. Whether to identify the bond assets fully respects the wishes of the relevant market participants and infrastructure institutions, and stipulates that the supervision requirements of the stock assets should remain unchanged during the transition period, promote the smooth transition of the market and effectively prevent the risk of disposal; After the issuance of the standardized rules for the identification of creditor's rights assets All kinds of new creditor's rights assets can be identified according to the relevant procedures; if the assets are identified, the asset management products can invest in the assets to replace the non-standard assets of the stock.
(6) Central Bank: In order to regulate the investment of assets management products of financial institutions, strengthen the protection of investors, promote the healthy development of direct financing, effectively prevent and control financial risks, it solicits public opinions on the standardized rules for the determination of creditor's rights assets. Standardized creditor's rights assets refer to fixed-income securities such as bonds and asset-backed securities issued according to law, mainly including Treasury bonds, corporate bonds, enterprise bonds, asset-backed securities listed on stock exchanges, and fixed-income securities investment funds.
(7) Xinhua News Agency said that the Federal Reserve announced another extension of the repurchase plan, and since October it has expanded its balance sheet at a rate of $60 billion a month, putting money into the financial market in a two-pronged manner, in an attempt to give the US financial market, which has just experienced the September "money shortage" and is under multiple uncertainties, sufficient funds and confidence. Market analysts generally agree with the Federal Reserve's latest move.
1. StockMarket
(1) Indices Performance
During last week, SSE Composite Index (000001.SH) changed 2.36 % to 2973.66, SHENZHEN COMPONENT INDEX (399001.SZ) changed 2.33 % to 9666.58, ChiNext Price Index (399006.SZ) changed 2.41 % to 1666.83, CSI 300 INDEX (000300.SH) changed 2.55 % to 3911.73, CSI SmallCap 500 index (000905.SH) changed 2.32 % to 5055.52, SSE 50 Index (000016.SH) changed 2.95 % to 2983.12.
Graph 1: Indices Performance over past 3 months

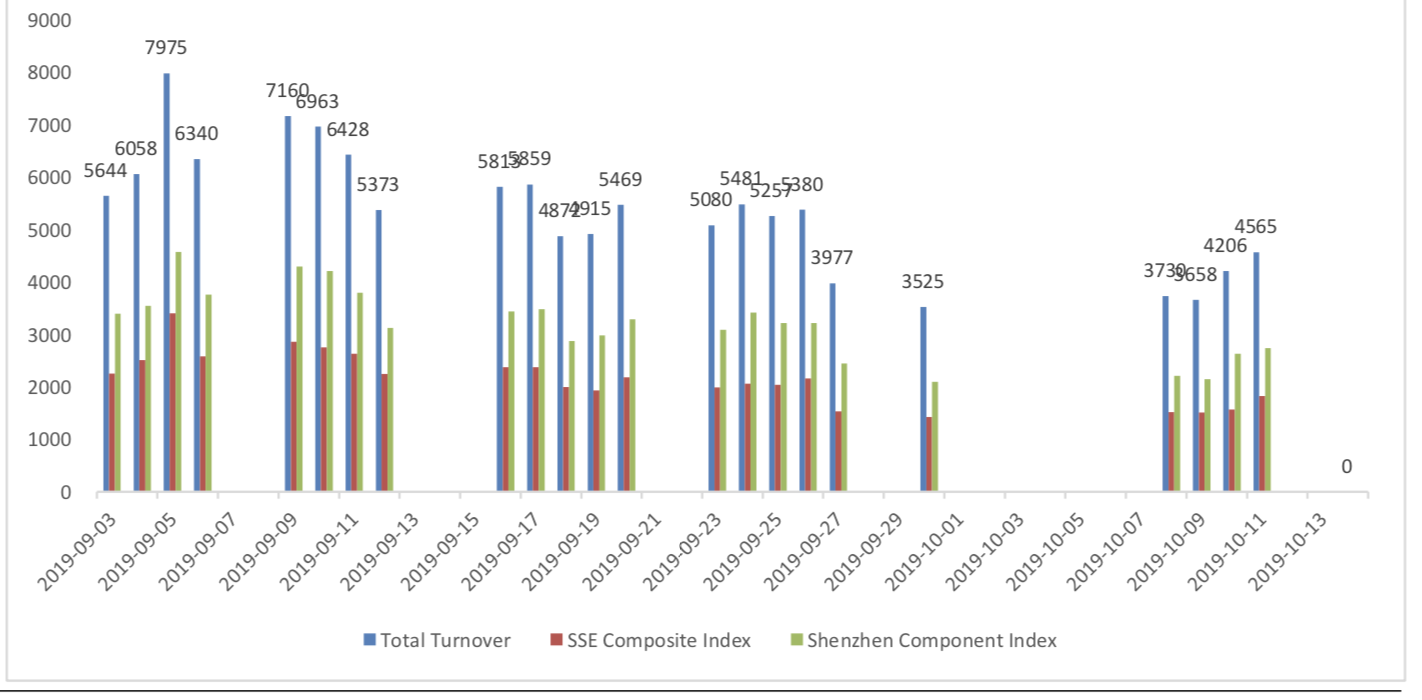
The average daily turnover of the whole market during past 5 trading days is 403.98 billion CNY, it decreased 14.48% compared with the previous 5-trading day period.
Graph 2: Market turnover
(3) Sectors Performance
In the view of sectors, during last week (from 2019-10-04 to 2019-10-11), 23 of 24 Wind Level- 2 sector(s) increased while 1 sector(s) dropped. Specifically, Real Estate (4.93%), Banks(4.51%) and Household & Personal Products(4.47%) did the best performance while Media (-0.42%), Semiconductors & Semiconductor Equipment (0.16%) and Consumer Services (0.78%) did the worst performance.
Graph 3: Sectors performance under Wind Level-2 classification (%)

(3) Indices Valuation (TTM)
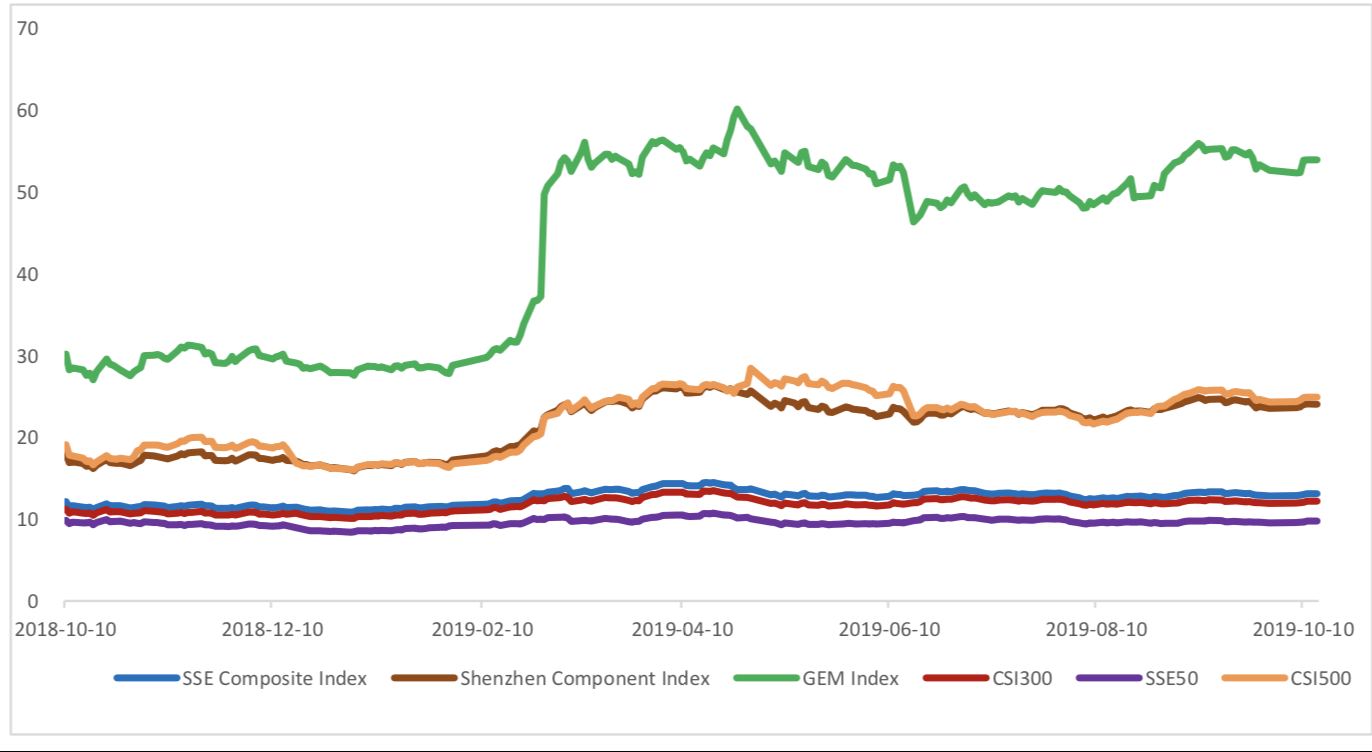
The current PE for SSE Composite Index, Shenzhen Component Index, GEM Index, CSI300, SSE50, CSI500 are 13.1264, 24.0612, 53.9086, 12.1944, 9.7813, 24.9082respectively; and these indices are at 23.40%, 33.20%, 64.00%, 34.00%, 33.70%, 22.10% percent rank level of their historic data, respectively
Graph 4: PE of 6 indices
Graph 5: PE percent rank of 6 indices (calculated by data of past 1200 trading days, only 1Y data is presented on the graph)

The current PB for SSE Composite Index, Shenzhen Component Index, GEM Index, CSI300, SSE50, CSI500 are 1.5185,2.6827,4.7397,1.5190,1.2443, 2.0682respectively, and these indices are at 32.10%, 30.10%, 38.60%, 52.20%, 55.70%, 15.30% percent rank level of their historic data, respectively.
Graph 6: PB of 6 indices

Graph 7: PB percent rank of 6 indices (calculated by data of past 1200 trading days, only 1Y data is presented on the graph)

(4) Foreign Fund Flow
Last week, there were 4 trading days for northward channel open for stock connect programs. During last week the total foreign fund flow via Stock Connect is 2.75 billion RMB, and the cumulative inflows was 831.38 billion RMB. Specifically, the fund flow via Shanghai-Hong Kong Stock Connect is 1.03 billion RMB and the fund flow via Shenzhen-Hong Kong Stock Connect is 1.73 billion RMB.
Graph 8: Fund flow via both Shanghai and Shenzhen-Hong Kong Stock Connect in past 1M (100 million CNY)

Graph 9: Fund flow via Shenzhen-Hong Kong Stock Connect in past 1M (100 million CNY)

Graph 10: Fund flow via both Shanghai-Hong Kong Stock Connect in past 1M (100 million CNY)

2. Index Futures
(1) Trading Volume and Open Interests
During past 5 trading days the average trading volume for CSI300(IF), SSE50(IH), CSI500(IC) contracts
are 63263 (-17.79%, the previous 5-trading day period),27105 (-10.47%),67592 (-25.60%) lots, respectively. On the last trading day, the total open interests for them are 113267 (3.80%),64336 (10.02%),156348 (2.46%) lots respectively.
Graph 11: CSI300 Index futures’ trading volume

Graph 12: CSI300 Index futures’ open interests

Graph 13:SSE50 Index futures’ trading volume 50000

Graph 14: SSE50 Index futures’ open interests

Graph 15: CSI500 Index futures’ trading volume

Graph 16: CSI500 Index futures’ open interests

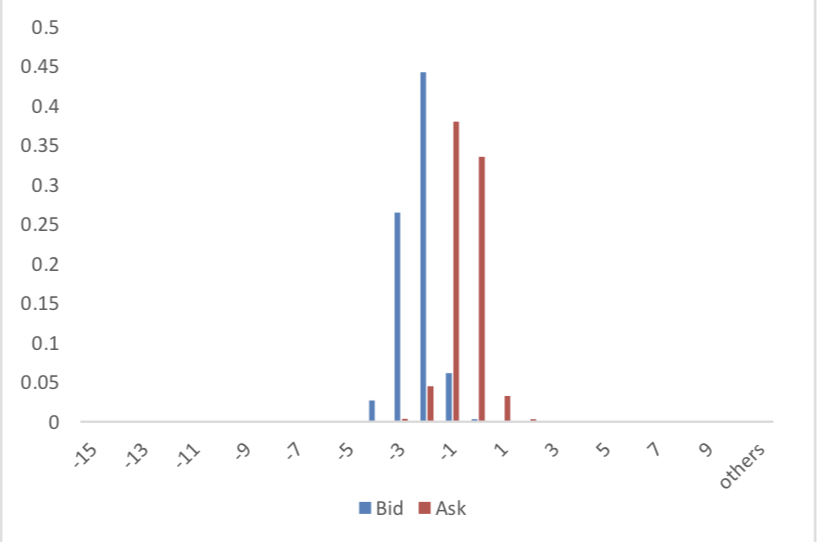
(2) Roll Level Bid-Ask Distribution
There are 5 trading days during last week, so the distribution is worked out with 36005 data points for each contract pair.
Graph 17: CSI300 Current/Next Month Contract Roll Spread Distribution (2s frequency)
Graph 18: SSE50 Current/Next Month Contract Roll Spread Distribution (2s frequency)

Graph 19: CSI500 Current/Next Month Contract Roll Spread Distribution (2s frequency)

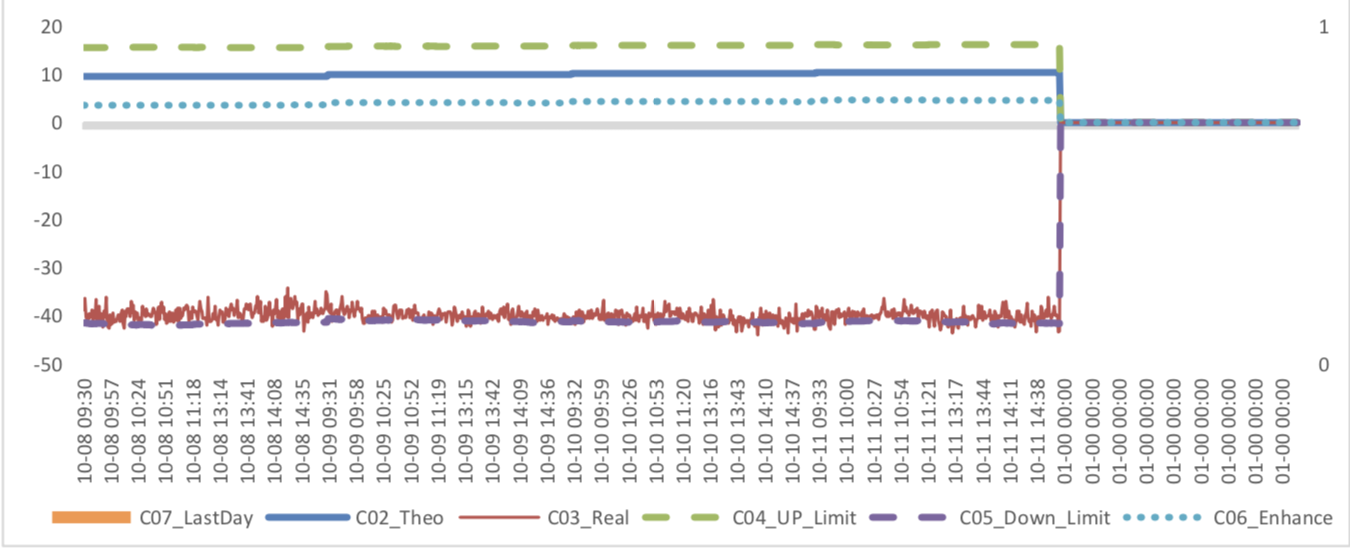
(3) Weekly Review of Future/Spot Arbitrage Opportunity
Assumption: risk-free rate: 3%; security borrowing cost: 8%; trading expense for spot: 0.025%; trading expense for futures: 0.005%; margin rates for futures contracts: 0.11 for CSI300 and SSE50, 0.13 for CSI500; margin rate for security borrowing: 0.3 (or 130% maintain rate).
When real price spread is out of theoretical range (calculated by our assumption), there exists absolute future-spot arbitrage opportunity.
Graph 20: Future (Current Month)-Spot Arbitrage Opportunity for CSI300 contract (in the view of price difference)

Graph 21: Future (Current Month)-Spot Arbitrage Opportunity for SSE50 contract (in the view of price difference)

Graph 22: Future (Current Month)-Spot Arbitrage Opportunity for CSI500 contract (in the view of price difference)

Graph 23: Future (Next Month-Current Month) Arbitrage Opportunity for CSI300 contract (in the view of price difference)

Graph 24: Future (Next Month-Current Month) Arbitrage Opportunity for SSE50 contract (in the view of price difference)

Graph 25: Future (Next Month-Current Month) Arbitrage Opportunity for CSI500 contract (in the view of price
difference)
(4) Roll Spread of Stock Index Futures Tracking
Calculated as the contract price of the current month minus the contract price of the following month, for the long roll, the positive calculation results are gains, the negative calculation results are losses. Code 00 in the figure represents the current month contract, 01 the next month contract, 02 the current quarter contract, 03 the next quarter contract.
(a)IFUp to2019/10/11,the best roll plan is IF00-IF03,annualized roll yield in monthly term is0.61%。
Graph 26: IF Current month contract roll yield comparison (index point)

Graph 27: IF Current month contract roll yield comparison (annualized return)

(b)IH
Up to 2019/10/11,the best roll plan is IH00-IH01,annualized roll yield in monthly term is1.53%。
Graph 28: IH Current month contract roll yield comparison (index point)

Graph 29: IH Current month contract roll yield comparison (annualized return)

(c)IC
Up to2019/10/11,the best roll plan isIC00-IC02,annualized roll yield in monthly term is10.25%。
Graph 30: ICCurrent month contract roll yield comparison (index point)

Graph 31: ICCurrent month contract roll yield comparison (annualized return)

(5) Basis Tracking of Stock Index Futures
For long side, if the base difference is positive, the change of the base difference brings losses, and if the base difference is negative, the change of the base difference brings profits.
(a)IF
for long side hedge, up to 2019/10/11,IF00 was in premium others in discount. Here IF next month contract basis return annualized yield is -0.47%。
Graph 32: IF contracts basis

Table 1: IF basis return calculation

(b)IH
for long side hedge, up to 2019/10/11,IH contracts in discount. Here IH next month contract basis return annualized yield is 2.13%.
Graph 33: IH contracts basis

Table 2: IH basis return calculation

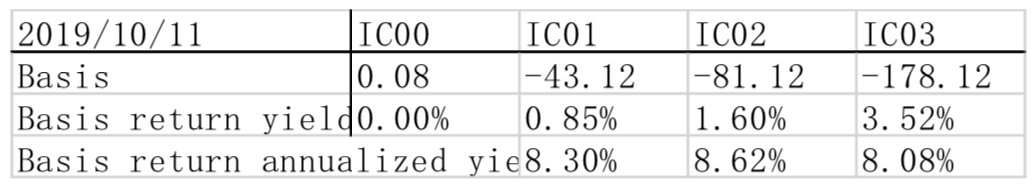
(c)IC
For long side hedge, up to 2019/10/11,IC00 was in premium and others in discount. Here IC next month contract basis return annualized yield is 8.30%.
Graph 34: IC contracts basis

Table 3: IC basis return calculation
3. Financial Markets
(1) Interest Rates
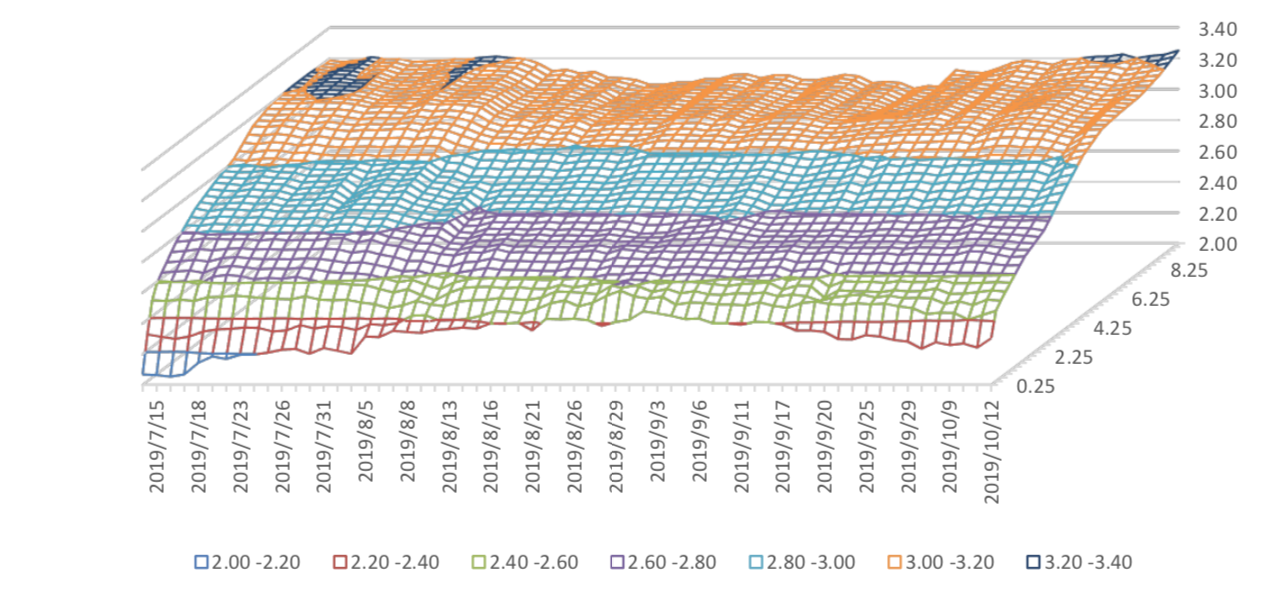
The term structure of treasury bonds’ yields is currently upward sloping in concave shape.
Specifically, last week, short-term yields short term yield of Treasury bond experienced some fluctuation and 3M yield now at 2.2%-2.4% level. Furthermore, as for long-term yield, there is a small drop. 10Y yield is about 3.0%-3.2%.
Graph 35: Term Structure Evolvement of Treasury Bonds Yields During Recent 3 Months (%)
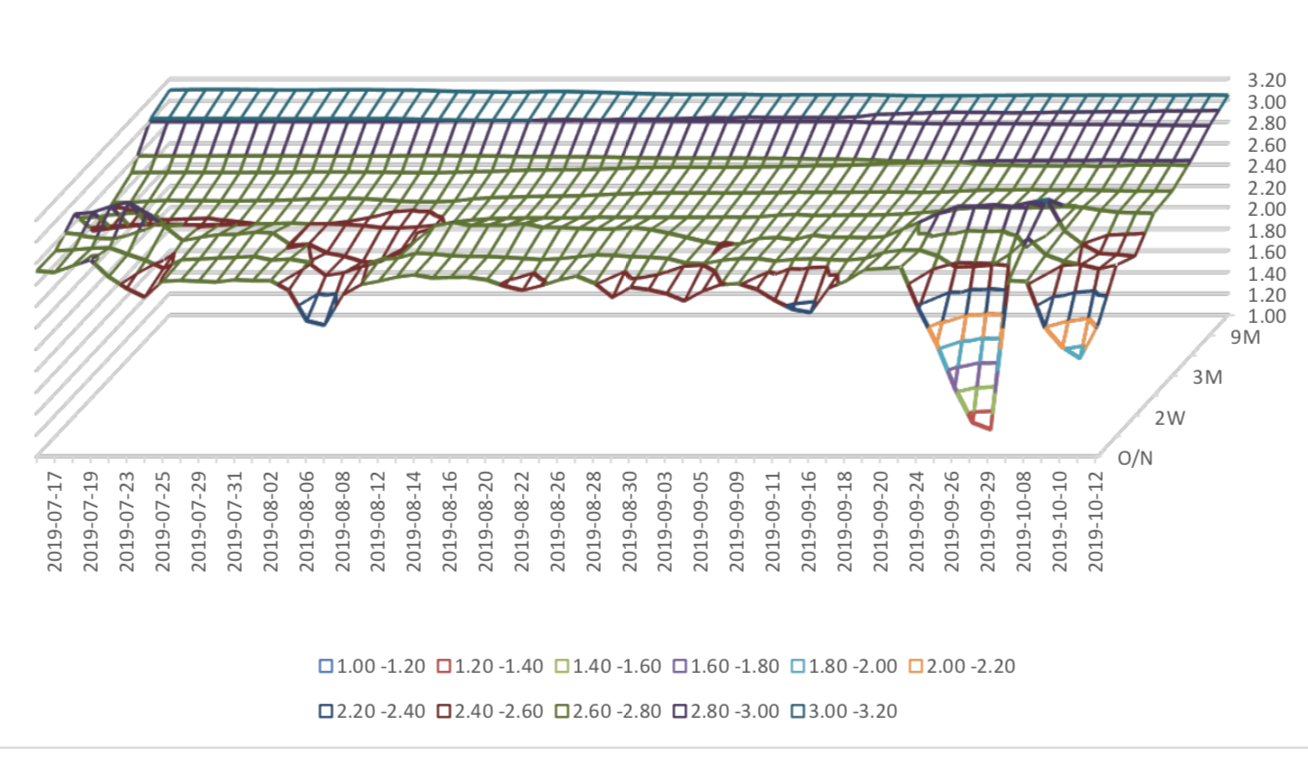
As for Shibor rates, short-term rates experienced significant fluctuation. Specifically, O/N rate experienced obvious fluctuation to 1.2%-1.4% level.
Graph 36: Term Structure Evolvement of Shibor Rates During Recent 3 Months (%)
(2) ExchangeRates
During last week, CNY/USD changed -0.534% to 7.1000 and offshore rate, CNH/USD, changed - 0.74% to 7.0883 and USD index changed -1.07%.
Graph 37: USD/CNY, USD/CNH and USD Index

Macroeconomic Topic:
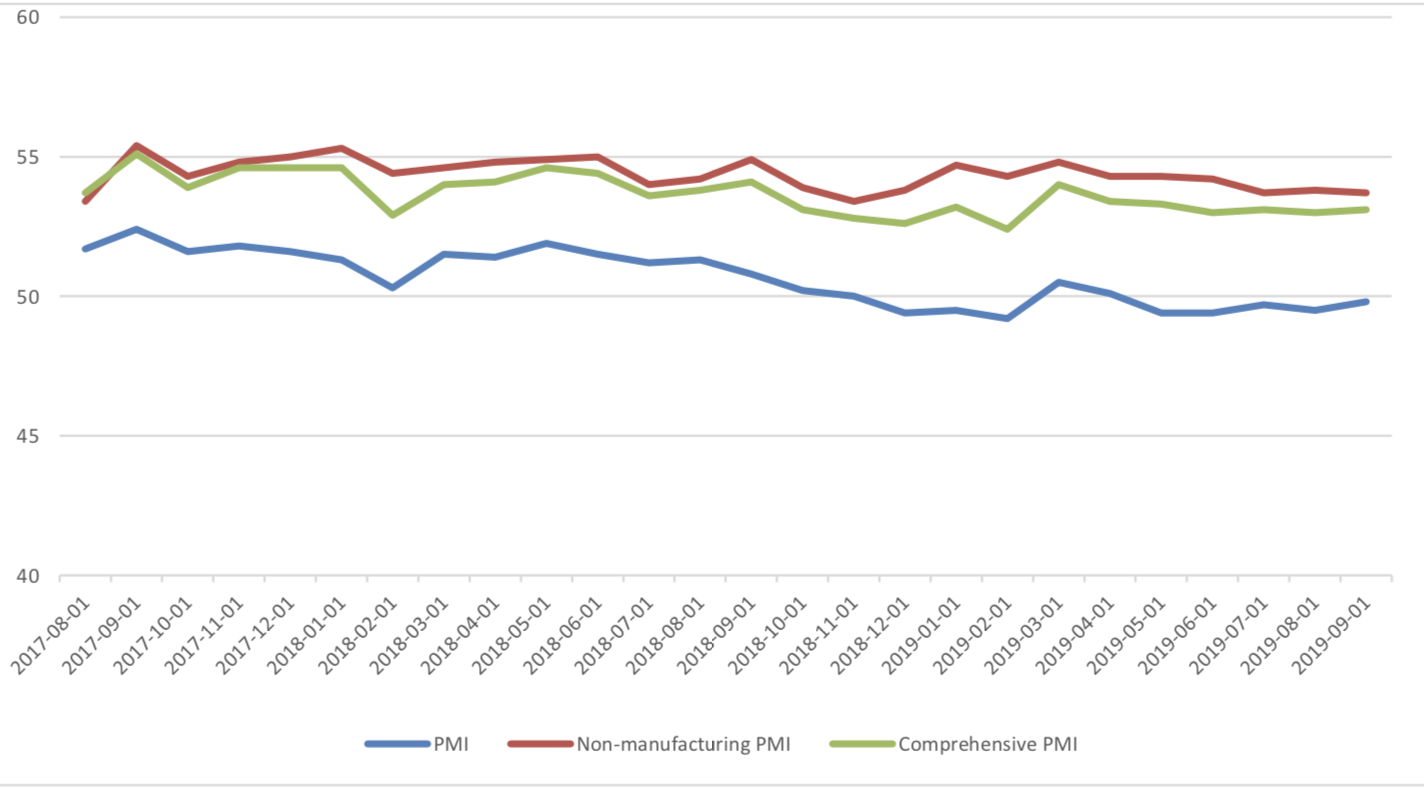
On 2019/09/30, the September PMI data was released. The data showed increasing PMI in September after a drop. The manufacturing PMI was 49.8 percent, with pre-value of 49.5 percent. The non- manufacturing PMI was at 53.7 percent, with pre-value of 53.8 percent, while the composite PMI was at 53.1 percent, with pre-value of 53.0 percent.
September PMI DataGraph A: PMI Data
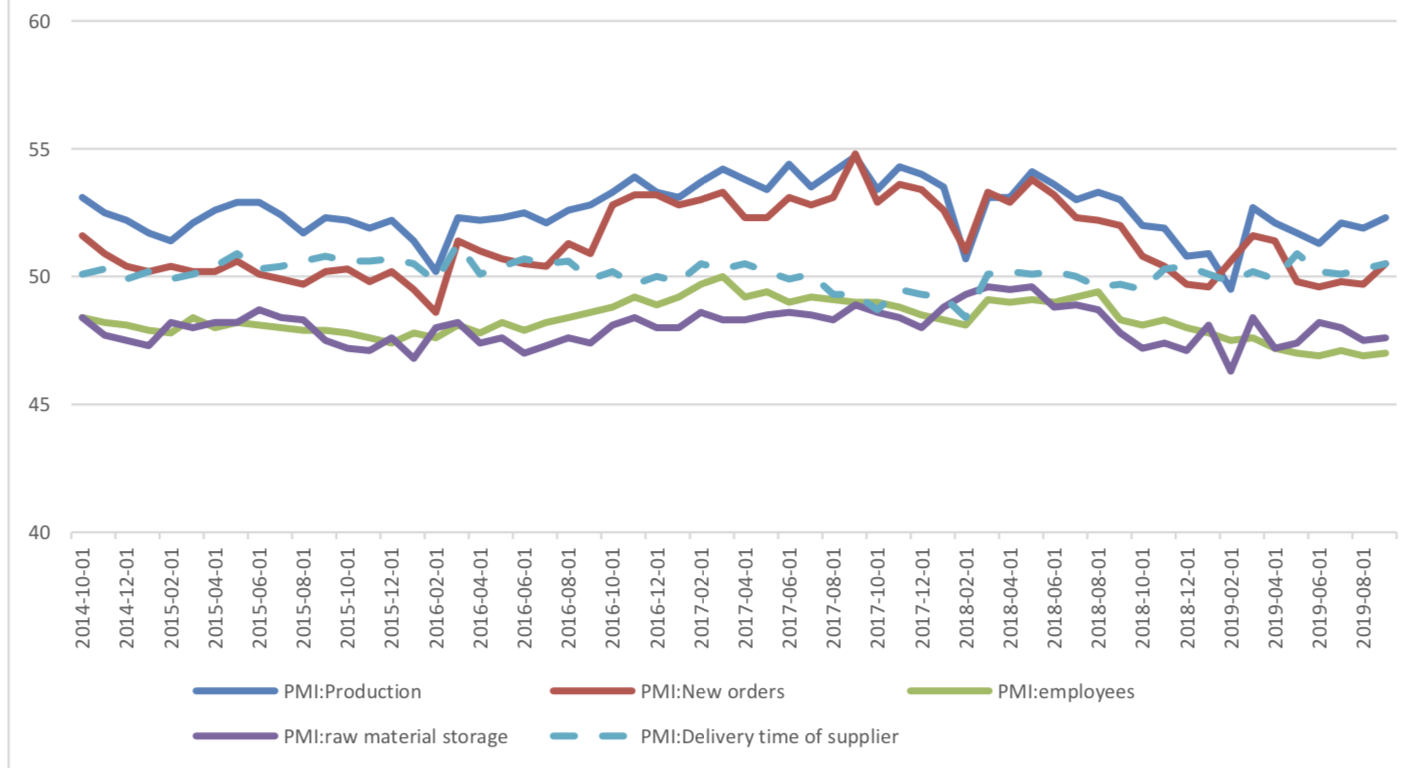
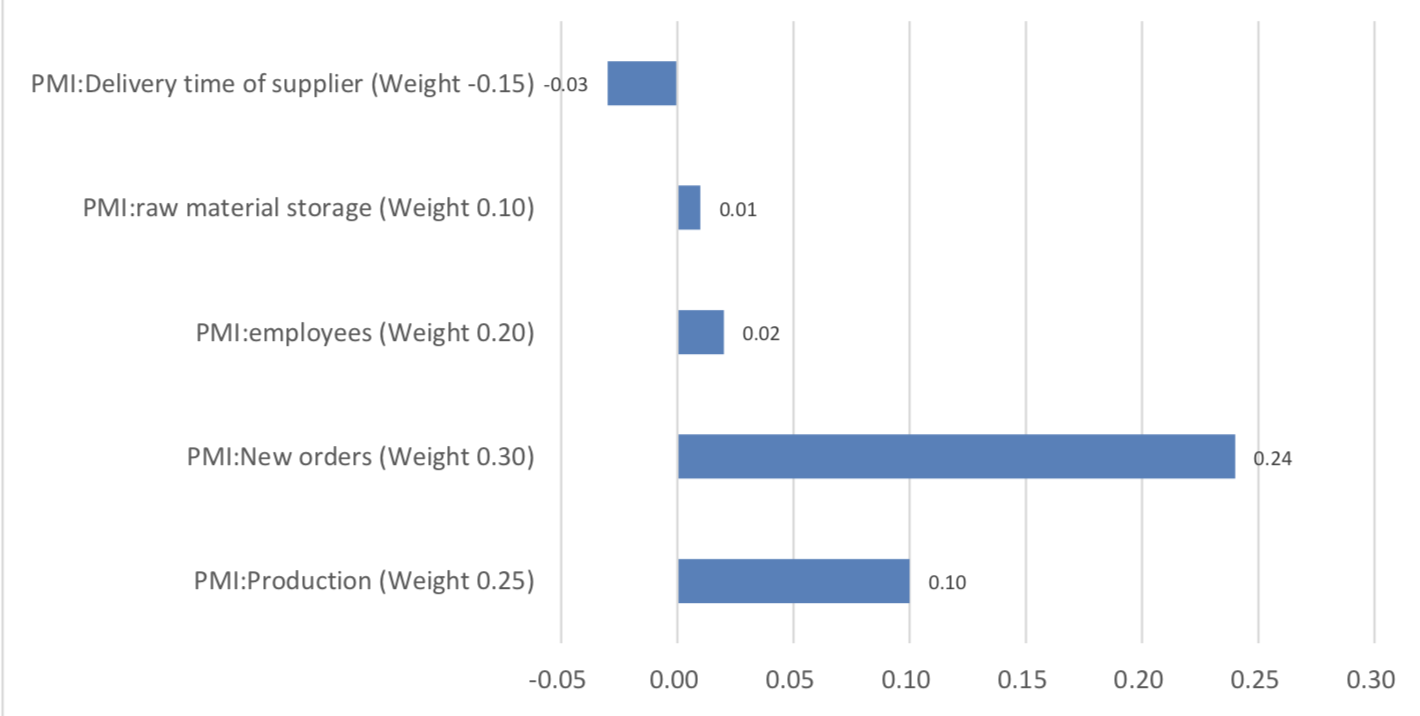
(1) About 5 Sub-indexes for manufacturing PMI calculation
From the point of view of 5 sub-indexes: (1) the increase of PMI: new orders is a main force to promote manufacturing PMI. It was reported at 50.5%, back to expansion zone, with preceding value of 49.7% and it promotes PMI for 0.24 percentage points. (2) The increase of PMI: production is another major force to promote manufacturing PMI. It was reported at 52.3%, still in expansion zone, with preceding value of 51.9% and it promotes PMI for 0.10 percentage points. (3)The increase of PMI: employees is one relatively minor force to promote manufacturing PMI. It was reported at 46.9%, still in contraction zone, with preceding value of 47.0% and it promotes PMI for 0.02 percentage points. (4) The increase of PMI: raw material storage, gave another minor force for improving manufacturing PMI. It was reported at 47.6%, still in contraction zone, with preceding value of 47.5% and it promotes PMI for 0.01 percentage points. (5)The rising of PMI: delivery time of supplier, is the minor force to drag manufacturing PMI. It was reported at 50.5%, still in contraction zone, with preceding value of 50.3% and it drags PMI for 0.03 percentage points.
Graph B: PMI 5 sub-indexes
Graph C: PMI Change Contribution by 5 Sub-indexes
(2) About 8 Sub-indexes not for manufacturing PMI calculation
3 of 8 sub-indexes are above 50, in expansion zone and the remaining indexes are in contraction zone. Several points need to mention: The rebound of new export orders is mainly due to the anticipated export rush of enterprises under the new tariff imposition, but it is lower than the prosperity and decline line due to the slowdown of global economic growth and the high uncertainty of trade frictions. However, China-US trade negotiation has make some breakthrough, the further rebound of new export can be expected. Influenced by rising oil prices, raw materials and ex-factory price index rebounded.
Graph D: PMI for 8 Sub-indexes not for manufacturing PMI calculation

(3) PMI by enterprises size
From the perspective of PMI of large and medium-sized enterprises, large enterprises have a slight increase and still expansion area, while small and medium-sized enterprises are still in the contraction area. Both mid and small size enterprises had some increase.
Graph E: PMI by enterprises size

(4) Summary
The PMI of manufacturing industry has rebounded slightly, but it is still below the boom and bust line for five consecutive months. The downward pressure of the economy is high. The index of manufacturing employees is still at a low level in the past decade and the employm.
Copyright by fangquant.com
Currently no Comments.
Hot Topics
The 13rd China International Future Forum
The Shanghai Derivatives Energy Forum has received extensive attention from relevant industries both within and outside the borders.
Financial institutions deep explore commodity market opportunities, commodity index financial products show full-scale trend
R-Code for analysis: getKDJ
R-Code@June 06, 2016
New indicator to analyze the arbitrage opportunities between sse50 and csi500
Market review: January 11, 2017
The Great China Bubble: Anniversary Lessons and Outlook
Quant Investment in China A-share market
The hedge strategy between SSE50 and A50--Jan 13,2017
The arbitraging strategy between CSI300 and SSE50
Market review: June 17, 2016
Sleepless in London--Enda Homan(Allied Irish Banks Plc)
MSCI Rebuffs Chinese Equities for Third Time in Blow to Xi
Soros, Druckenmiller among hedgies profiting in market plunge