Market Summary:
Last week, there was generally increase over the market. SSE Composite Index (000001.SH) changed 0.20 % to 2964.18. Specifically, small cap shares perform slightly better than large cap shares and we can observe that CSI500 did better than SSE50 (0.52% vs 0.33%). The average daily turnover of the whole market during past 5 trading days is 450.37 billion CNY, it decreased 6.66% compared with the previous 5-trading day period.
Last week, northbound funds continuously flow in. It was 13.55 during last week and totally 881 billon, still creating new high.
Price situation is getting serious. China's October CPI rose 3.8% year-on-year, with an expected 3.4% rise from the previous 3%. From January to October, the average CPI rose 2.6% year on year. China's PPI in October fell 1.6% year-on-year, expected to fall 1.6% and the previous value fell 1.2%. From January to October, the average PPI decreased by 0.2% year on year. According to the Bureau of statistics, pork prices rose by 20.1% month on month in October, affecting CPI growth by about 0.79 percentage points; and rose by 101.3% year on year, affecting CPI growth by about 2.43 percentage points. In October, CPI rose the same as that of last month, with an increase year-on-year. Driven by the rise of pork price and the impact of consumer substitution demand, the prices of beef, mutton, chicken and duck all rose, with an increase of 1.0% - 3.1%, and the total of four factors affected CPI to rise by about 0.06%; PPI rose slightly, and continued to decline year-on-year.
As for arbitrage opportunity, all futures current-month contracts show some room for arbitrage opportunities. No price spread for next-month/current month contracts show room for arbitrage.
News:
(1) Securities Times: no matter how volatile the A-share market is, MSCI, FTSE Russell, standard & Poor's Dow Jones and other international well-known index companies are included and expanded on schedule, showing that foreign investment is "true love" for the A-share market.
(2) Wind: CSRC solicits public opinions on the revision of refinancing rules such as Administrative measures for securities issuance of listed companies and Interim Measures for securities issuance of GEM listed companies. Analysts pointed out that the continuous improvement of gem refinancing rules will broaden the coverage of gem refinancing services, facilitate the financing of high-tech enterprises, and boost China's economic transformation.
(3) Securities Daily: the State-owned Assets Supervision and Administration Commission (SASAC) officially announced the operation guidelines for the reform of mixed ownership of central enterprises on November 8. The state owned assets supervision and Administration Commission of the State Council said that the introduction of the operation guidelines provided a systematic operation guide for the central enterprises to carry out the reform of mixed ownership, which was conducive to the central enterprises to standardize the work process of the reform of mixed ownership, deepen the connotation of the reform of mixed ownership, promote the "reform mechanism" with "mixed capital", and effectively improve the competitiveness, innovation and control power of the central enterprises Influence and anti-risk ability, consolidate the micro foundation of the basic socialist economic system:
(4) China Securities Journal: in the first 10 months, China's total import and export value of goods trade was 25.63 trillion yuan, up 2.4% year on year. Experts believe that the global economy is expected to pick up and form a positive pulling effect on China's exports; China continues to expand its opening-up and import may significantly improve. Zhang Jun, chief economist of Morgan Stanley Huaxin securities, believes that with the improvement of external factors, new orders of global PMI show signs of improvement, and China's export growth is expected to boost.
(5) Wind: the Party committee of SASAC held a spiritual meeting to convey and learn from the Fourth Plenary Session of the 19th CPC Central Committee, to implement the new requirements of the plenary session on enhancing the competitiveness, innovation, control, influence and anti risk ability of the state- owned economy, the new expression on the modern enterprise system with Chinese characteristics, the new deployment of the state-owned assets supervision system, further improve the system of the state-owned assets and state-owned enterprises, and implement it We will implement the deployment requirements for supporting the development of the non-public sector of the economy and for upholding and improving the distribution system.
(6)First finance: MSCI: Science and technology innovation board is not included in the inclusion plan in November. The premise of inclusion is that NORTHCOM, the connectivity mechanism, will first include science and technology innovation board, and NORTHCOM will be included as early as December this year.
(7) China Securities Network: Zhu Guangyao, former Vice Minister of the Ministry of finance, said that in 2019, the growth of global economy and trade faced great downward pressure. IMF predicted that the growth of global economy in 2019 would be 3%, and WTO predicted that the growth of Global trade would be 1.2%. Facing the downward pressure of global economy and trade, we should strengthen the policy coordination under the multilateral framework.
1. StockMarket
(1) Indices Performance
During last week, SSE Composite Index (000001.SH) changed 0.20 % to 2964.18, SHENZHEN COMPONENT INDEX (399001.SZ) changed 0.95 % to 9895.34, ChiNext Price Index (399006.SZ) changed 1.44 % to 1711.22, CSI 300 INDEX (000300.SH) changed 0.52 % to 3973.01, CSI SmallCap 500 index (000905.SH) changed 0.52 % to 4988.29, SSE 50 Index (000016.SH) changed 0.33 % to 3012.46.
Graph 1: Indices Performance over past 3 months

The average daily turnover of the whole market during past 5 trading days is 450.37 billion CNY, it decreased 6.66% compared with the previous 5-trading day period.
Graph 2: Market turnover

(2) Sectors Performance
In the view of sectors, during last week (from 2019-11-01 to 2019-11-08), 21 of 24 Wind Level- 2 sector(s) increased while 3 sector(s) dropped. Specifically, Consumer Durables & Apparel(5.61%), Health Care Equipment & Services(4.89%) and Technology Hardware & Equipment(2.90%) did the best
performance while Telecommunication Services (-2.21%), Professional Services(-0.14%) did the worst performance.
Graph 3: Sectors performance under Wind Level-2 classification (%)

(3) Indices Valuation (TTM)
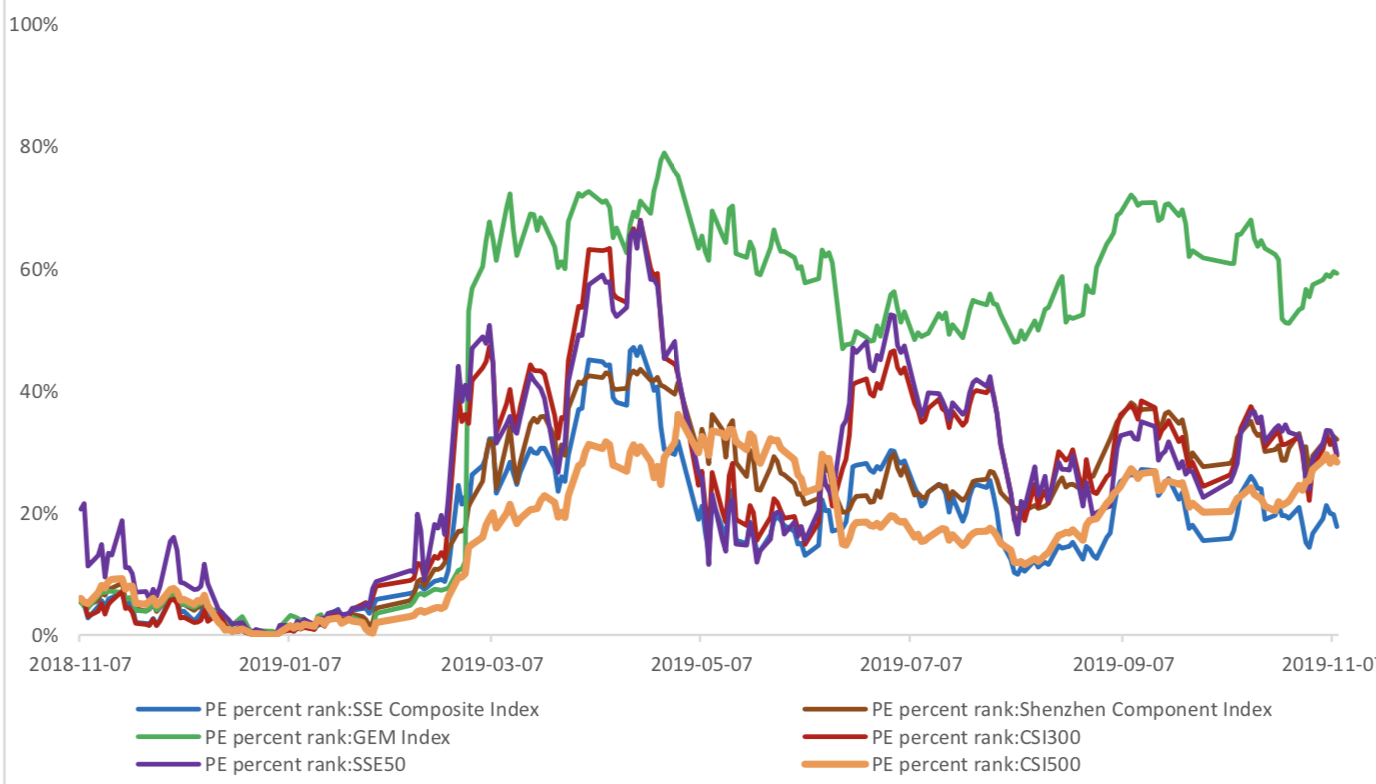
The current PE for SSE Composite Index, Shenzhen Component Index, GEM Index, CSI300, SSE50, CSI500 are 12.9273, 23.9934, 51.9611, 12.0391, 9.6899, 26.0265respectively; and these indices are at 17.70%, 32.00%, 59.20%, 29.30%, 29.70%, 28.30% percent rank level of their historic data, respectively
Graph 4: PE of 6 indices

Graph 5: PE percent rank of 6 indices (calculated by data of past 1200 trading days, only 1Y data is presented on the graph)
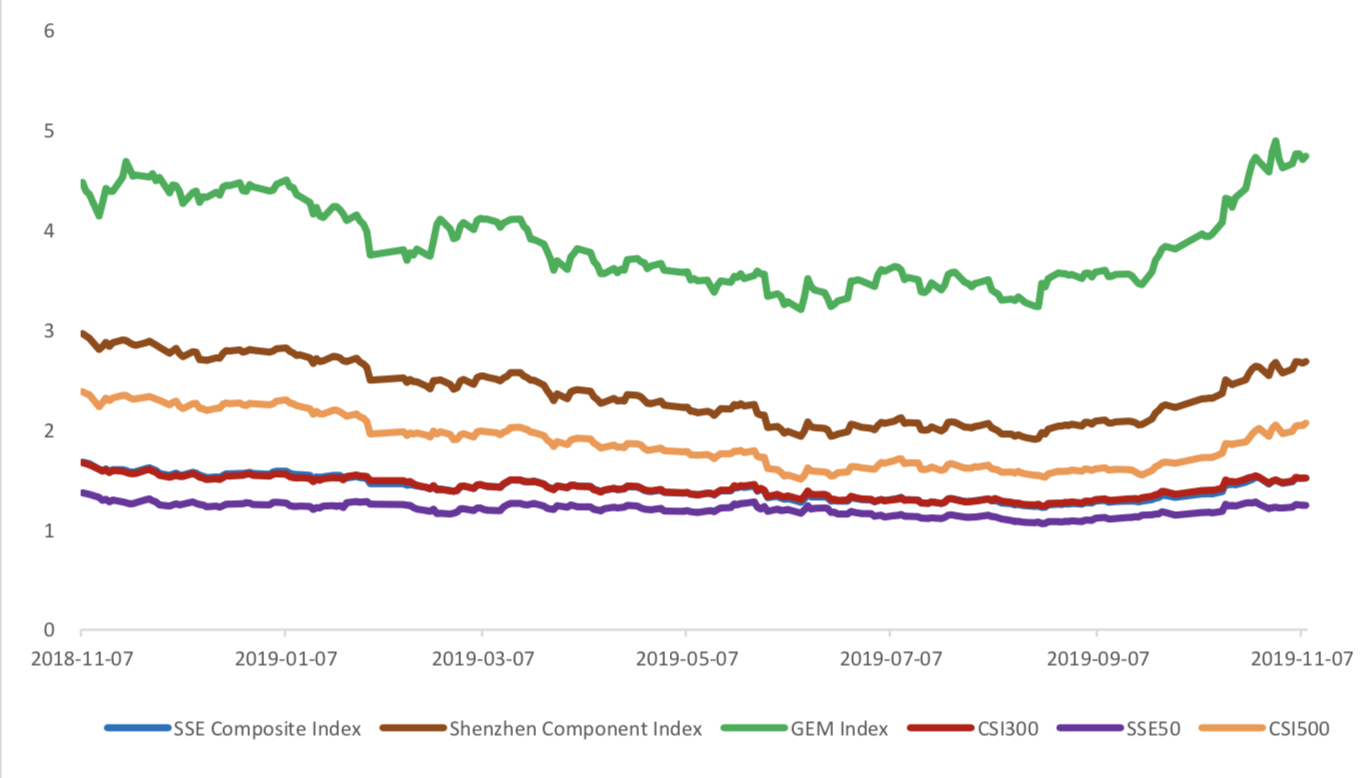
The current PB for SSE Composite Index, Shenzhen Component Index, GEM Index, CSI300, SSE50, CSI500 are 1.5185,2.6827,4.7397,1.5190,1.2443, 2.0682respectively, and these indices are at 32.10%, 30.10%, 38.60%, 52.20%, 55.70%, 15.30% percent rank level of their historic data, respectively.
Graph 6: PB of 6 indices
Graph 7: PB percent rank of 6 indices (calculated by data of past 1200 trading days, only 1Y data is presented on the graph)

(4) Foreign Fund Flow
Last week, there were 5 trading days for northward channel open for stock connect programs. During last week the total foreign fund flow via Stock Connect is 13.55 billion RMB, and the cumulative inflows was 881.05 billion RMB. Specifically, the fund flow via Shanghai-Hong Kong Stock Connect is 6.28 billion RMB and the fund flow via Shenzhen-Hong Kong Stock Connect is 7.27 billion RMB.
Graph 8: Fund flow via both Shanghai and Shenzhen-Hong Kong Stock Connect in past 1M (100 million CNY)

Graph 9: Fund flow via Shenzhen-Hong Kong Stock Connect in past 1M (100 million CNY)

Graph 10: Fund flow via both Shanghai-Hong Kong Stock Connect in past 1M (100 million CNY)

2. Index Futures
(1) Trading Volume and Open Interests
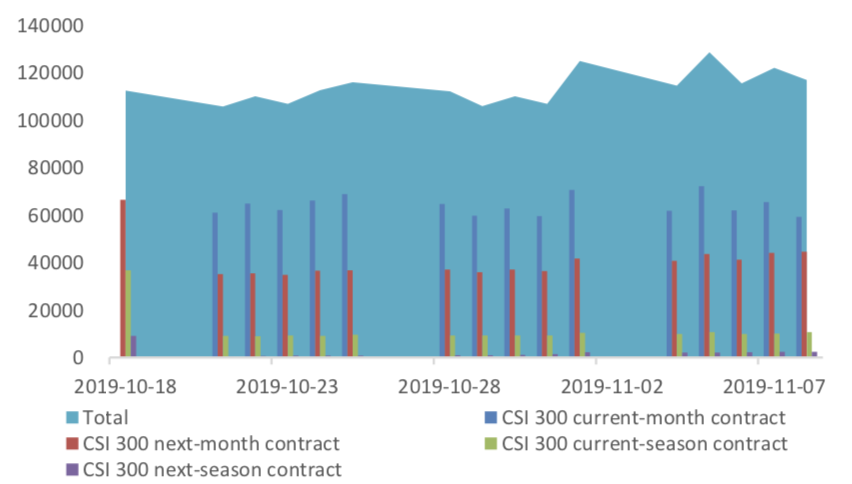
During past 5 trading days the average trading volume for CSI300(IF), SSE50(IH), CSI500(IC) contracts
are 87838 (11.79%, the previous 5-trading day period),33804 (13.54%),90409 (15.29%) lots, respectively. On the last trading day, the total open interests for them are 116878 (-6.34%),58783 (-6.19%),161641 (0.47%) lots respectively.
Graph 11: CSI300 Index futures’ trading volume

Graph 12: CSI300 Index futures’ open interests
Graph 13:SSE50 Index futures’ trading volume
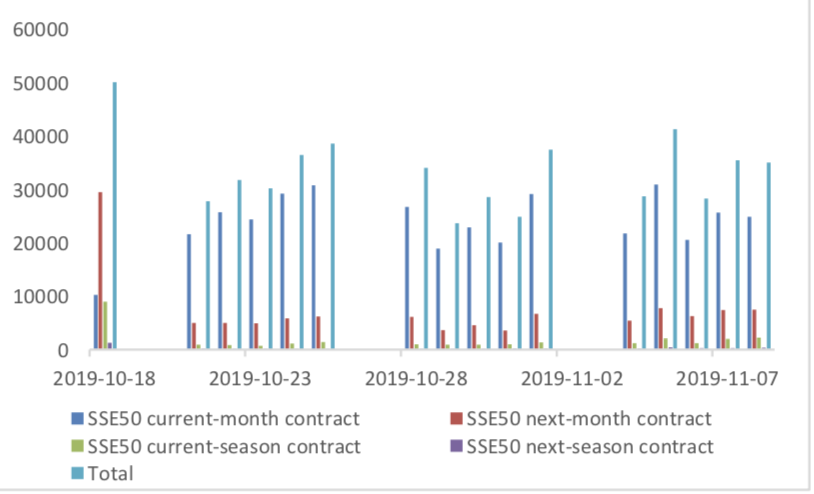
Graph 14: SSE50 Index futures’ open interests

Graph 15: CSI500 Index futures’ trading volume

Graph 16: CSI500 Index futures’ open interests

(2) Roll Level Bid-Ask Distribution
There are 5 trading days during last week, so the distribution is worked out with 36005 data points for each contract pair.
Graph 17: CSI300 Current/Next Month Contract Roll Spread Distribution (2s frequency)

Graph 18: SSE50 Current/Next Month Contract Roll Spread Distribution (2s frequency)

Graph 19: CSI500 Current/Next Month Contract Roll Spread Distribution (2s frequency)

Assumption: risk-free rate: 3%; security borrowing cost: 8%; trading expense for spot: 0.025%; trading expense for futures: 0.005%; margin rates for futures contracts: 0.11 for CSI300 and SSE50, 0.13 for CSI500; margin rate for security borrowing: 0.3 (or 130% maintain rate).
When real price spread is out of theoretical range (calculated by our assumption), there exists absolute future-spot arbitrage opportunity.
Graph 20: Future (Current Month)-Spot Arbitrage Opportunity for CSI300 contract (in the view of price difference)

Graph 21: Future (Current Month)-Spot Arbitrage Opportunity for SSE50 contract (in the view of price difference)

Graph 22: Future (Current Month)-Spot Arbitrage Opportunity for CSI500 contract (in the view of price difference)

Graph 23: Future (Next Month-Current Month) Arbitrage Opportunity for CSI300 contract (in the view of price difference)

Graph 24: Future (Next Month-Current Month) Arbitrage Opportunity for SSE50 contract (in the view of price difference)

Graph 25: Future (Next Month-Current Month) Arbitrage Opportunity for CSI500 contract (in the view of price
difference)

(4) Roll Spread of Stock Index Futures Tracking
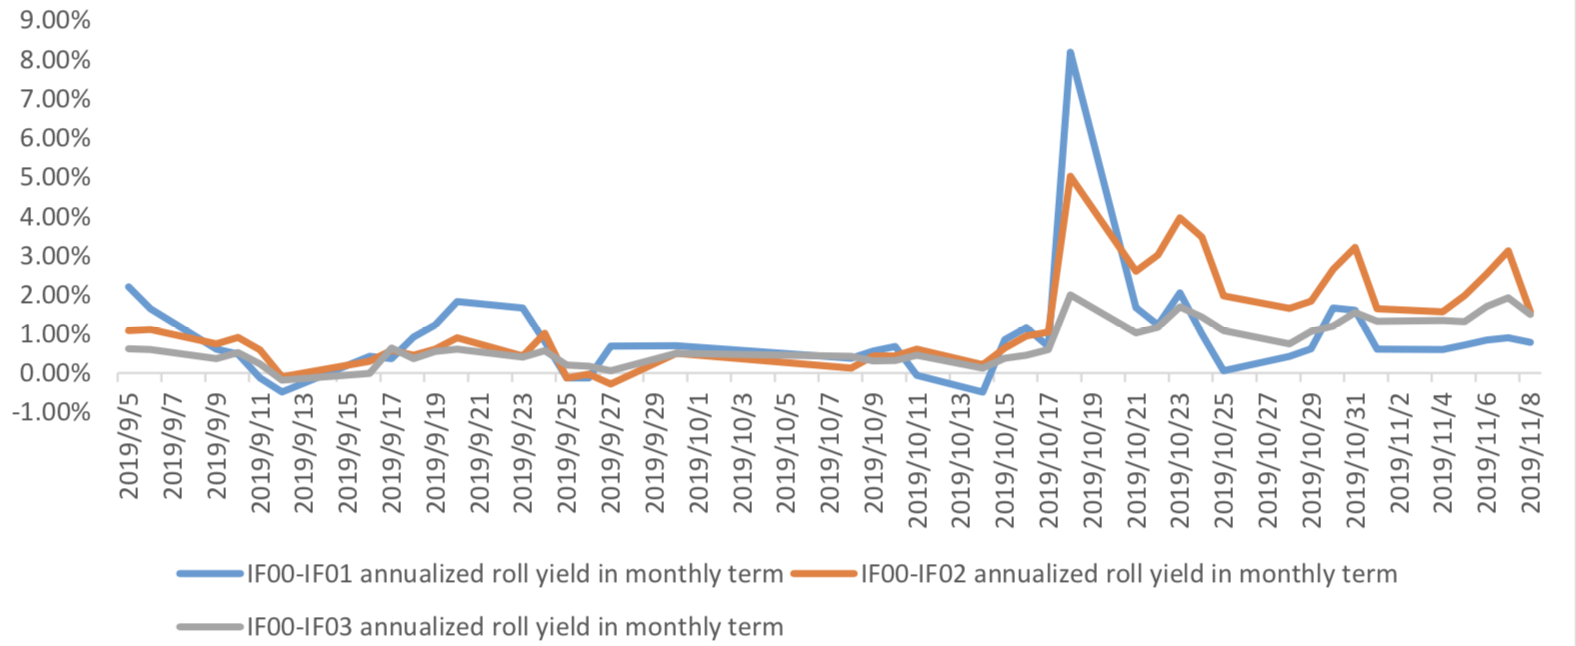
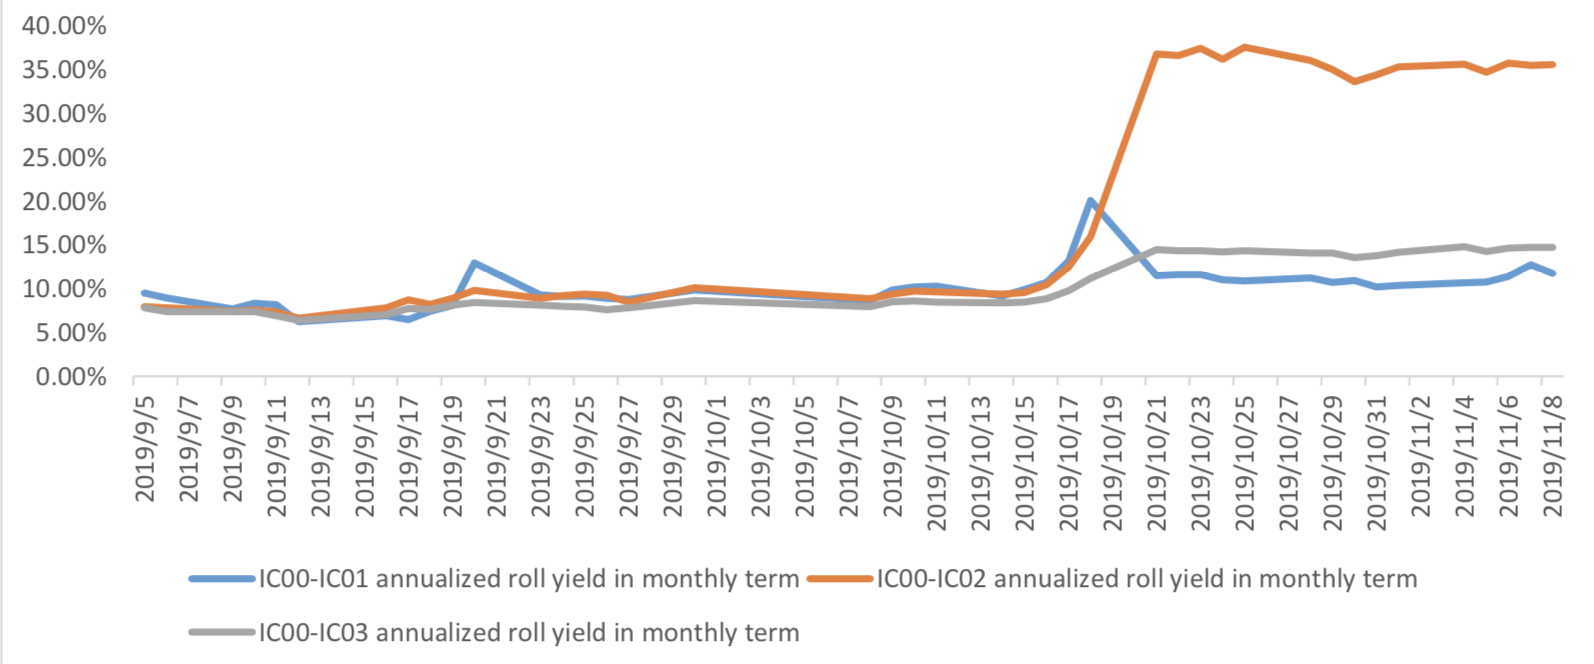
Calculated as the contract price of the current month minus the contract price of the following month, for the long roll, the positive calculation results are gains, the negative calculation results are losses. Code 00 in the figure represents the current month contract, 01 the next month contract, 02 the current quarter contract, 03 the next quarter contract.
(a)IF
Up to2019/11/8,the best roll plan is IF00-IF01,annualized roll yield in monthly term is1.57%。
Graph 26: IF Current month contract roll yield comparison (index point)

Graph 27: IF Current month contract roll yield comparison (annualized return)
(b)IH
Up to 2019/11/8,the best roll plan is IH00-IH01,annualized roll yield in monthly term is1.27%。
Graph 28: IH Current month contract roll yield comparison (index point)

Graph 29: IH Current month contract roll yield comparison (annualized return)

(c)IC
Up to2019/11/8,the best roll plan isIC00-IC01,annualized roll yield in monthly term is35.56%。
Graph 30: IC Current month contract roll yield comparison (index point)

Graph 31: IC Current month contract roll yield comparison (annualized return)
(5) Basis Tracking of Stock Index Futures
For long side, if the base difference is positive, the change of the base difference brings losses, and if the base difference is negative, the change of the base difference brings profits.
(a)IF
For long side hedge, up to 2019/11/8,all IF contracts in discount. Here IF next month contract basis return annualized yield is 1.67%。
Graph 32: IF contracts basis

Table 1: IF basis return calculation

(b)IH
For long side hedge, up to 2019/11/8,all IH contracts were in discount. Here IH next month contract
basis return annualized yield is 0.79%。
Graph 33: IH contracts basis
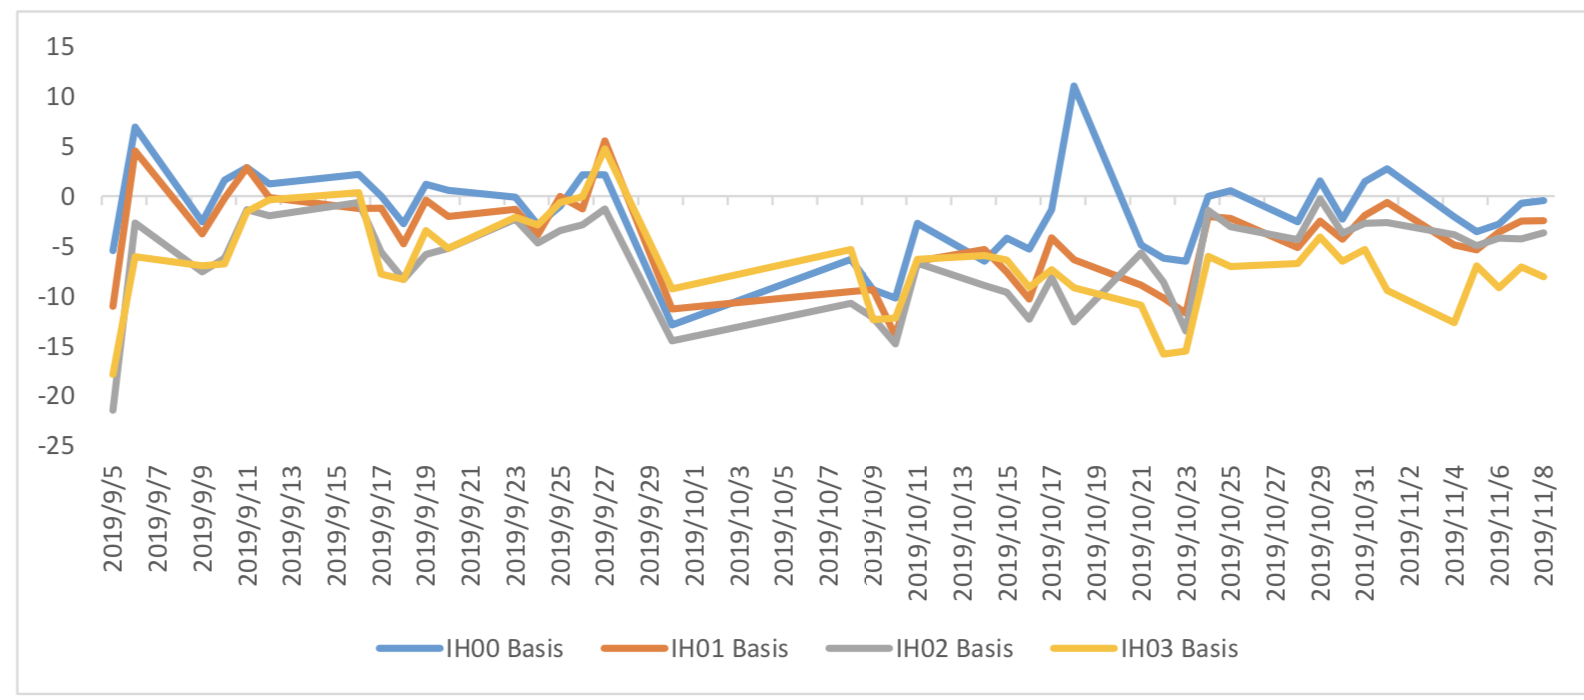
Table 2: IH basis return calculation

(c)IC
For long side hedge, up to 2019/11/8,all IC were in discount. Here IC next month contract basis
return annualized yield is 12.93%。
Graph 34: IC contracts basis

Table 3: IC basis return calculation

3. Financial Markets
(1) Interest Rates
The term structure of treasury bonds’ yields is currently upward sloping in concave shape.
Specifically, last week, short-term yields short term yield of Treasury bond experienced some fluctuation and 3M yield now at 2.2%-2.4% level. Furthermore, as for long-term yield, there is a small drop. 10Y yield is about 3.0%-3.2%.
Graph 35: Term Structure Evolvement of Treasury Bonds Yields During Recent 3 Months (%)

As for Shibor rates, short-term rates experienced significant fluctuation. Specifically, O/N rate experienced obvious fluctuation to 1.2%-1.4% level.
Graph 36: Term Structure Evolvement of Shibor Rates During Recent 3 Months (%)

(2) ExchangeRates
During last week, CNY/USD changed -0.699% to 6.9884 and offshore rate, CNH/USD, changed - 0.76% to 6.9883 and USD index changed 1.21%.
Graph 37: USD/CNY, USD/CNH and USD Index

Macroeconomic Topic:
According to the released price data by the national bureau of statistics. The data showed that year-on- year CPI kept in high position. PPI is still in deflation region. The data showed that the year-on-year and ring ratio CPI were 3.8 percent and 0.9 percent, respectively, compared with pre value of 3.0 percent and 0.9 percent, respectively. Year-on-year and ring ratio PPI were -1.6 percent and 0.1 percent, respectively, compared with the previous figures of -1.2 percent and 0.1 percent, respectively.
October Price Data
(1) CPI Data
Graph A: CPI Data

CPI is mainly affected by the price of pork, and the core CPI is still stable, and there has been a certain decline for core CPI. According to the Bureau of statistics, in October, the price of food, tobacco and alcohol rose 11.4% year-on-year, affecting CPI (consumer price index) to rise by about 3.37%. In food, the price of animal meat rose by 66.8%, affecting CPI by about 2.92%, of which pork price rose by 101.3%, affecting CPI by about 2.43%; the price of food, tobacco and alcohol rose by 2.7% month on month, affecting CPI by about 0.84%. In food, the price of animal meat rose by 14.7%, affecting CPI by about 0.91%, of which pork price rose by 20.1%, affecting CPI by about 0.79%..
Graph B: year-on-year CPI: by Food, Non-Food, Core, Services, Consumer Goods (%)

Residence, education, culture and entertainment, healthcare, household goods and service prices rose slightly, with growth rates of 0.5%, 1.9%, 2.1% and 0.6% respectively. Transportation and communication dropped 3.5%
Graph C: year-on-year CPI: by Food Alcohol and Tobacco, Clothing, Residence, Household Goods & Services, Transportation & Communications, Education, Culture & Entertainment, Healthcare (%)

(2) PPI Data
Graph D: PPI Data (%)

The means of production PPI was -2.6 percent year-on-year, decreased 0.6 percentage point from the previous month. The means of livelihoods PPI, was 1.4 percent, compared with the previous value of 0.7 percent.
Graph E: PPI Data, by means of production and means of livelihoods

(3) Summary
CPI and PPI kept obvious differentiation. CPI is mainly affected by the price of pork. Without the price of pork, CPI could also show trend of deflation. To deal with the pork price, the government will take measures to support the production chain. Without considering pork, the economy obviously show downward pressure, more counter-cycle measure is necessary.
Copyright by fangquant.com