FangQuant › Financial Futures
Market Summary:
Last week, there was generally decrease over the market. SSE Composite Index (000001.SH) changed -2.46 % to 2891.34. Specifically, large cap shares perform slightly better than small cap shares and we can observe that SSE50 did better than SSE50 (-1.92% vs -2.40%). The average daily turnover of the whole market during past 5 trading days is 387.34 billion CNY, it decreased 13.99% compared with the previous 5-trading day period.
The central bank issued monetary implementing report. According to the central bank, China's economic operation is generally stable, the total supply and demand is generally balanced, and there is no basis for sustained inflation or deflation; it is expected that after entering the second half of 2020, the impact of tail raising factors on PPI will be less than 2019 and more stable, CPI will gradually fade under the impact of rising food prices, and the gap between the two is expected to narrow. It will continue to maintain the focus on grasping the strength and pace of policies, strengthening counter cyclical adjustment, strengthening structural adjustment, properly coping with the short-term downward pressure on the economy, resolutely refraining from "flooding", and keeping the growth rate of M2 and social financing scale matching the growth rate of the nominal GDP.
As for arbitrage opportunity, all futures current-month contracts show some room for arbitrage opportunities. Price spread for CSI500 next-month/current month contracts show room for arbitrage.
News:
(1) wind: the people's Bank of China issued the implementation report of China's monetary policy in the third quarter of 2019, emphasizing the implementation of sound monetary policy, strengthening counter cyclical regulation, maintaining reasonable and sufficient liquidity and reasonable growth of social financing scale, giving play to the role of monetary and credit policies in promoting economic restructuring and better serving the real economy. In the next step, we will continue to do a good job in the quotation and application of LPR, guide and urge financial institutions to make reasonable pricing, further break the implicit lower limit of loan interest rate, dredge the transmission channel from market interest rate to loan interest rate, and promptly study and issue the conversion scheme of stock loan interest rate benchmark. Although the growth of the central bank's asset scale slows down or even may decline, the reduction of the central bank's liquidity constraint has been relaxed and the ability of money creation has been increased, which is essentially different from the "table reduction" once conducted by foreign central banks after the end of quantitative easing. Next, the people's Bank of China will continue to improve the normalization mechanism for the issuance of RMB central bank bills in Hong Kong, reasonably arrange the issuance scale and term varieties according to the market demand, drive other issuers to issue RMB bonds in the offshore market, and promote the sustainable and healthy development of the offshore RMB market. We will improve the market environment and supporting policies for banks to replenish capital, promote banks to replenish capital through multiple channels, such as issuing perpetual bonds, and focus on supporting small and medium- sized banks to replenish capital and optimize their capital structure.
(2) Economic Observer: after five years, ETF options will be expanded. There may be a large number of option strategy investors in the future. When talking about arbitrage strategy, based on the arrangement of exchange system, market makers and option management institutions strictly implement the investor's hierarchical management system and other factors, the industry expects that the operating space may not be too large, and the time of significant existence of arbitrage space will be shorter than the opportunity in history.
(3) Securities Daily: the rule of law is one of the main characteristics of system optimization in the comprehensive deepening reform of capital market in this round. From the top-level design - system first - effectively improve the cost of illegal activities - case demonstration and deterrence of those who intend to violate the rules - improve the governance of listed companies - improve the quality of listed companies. This "quality improvement ecological chain" has clear logic and clear objectives, and will also strengthen the "institutional cornerstone" of capital market reform, and promote the formation of standardized, transparent, open, dynamic and resilient capital This market.
(4) according to CME's "Federal Reserve observation": the probability of maintaining the current interest rate in the range of 1.50% - 1.75% in December is 99.3%, and the probability of reducing the interest rate by 25 basis points to 1.25% - 1.50% is 0.7%; the probability of maintaining the current interest rate in the range of 1.50% - 1.75% in January next year is 86.1%, the probability of reducing the interest rate by 25 basis points to 1.25% - 1.50% is 13.8%, and the probability of reducing the interest rate by 50 basis points to 1.00% - 1.25% is 0.1%.
(5) China Securities News: the 50ETF option market has attracted a lot of fund attention recently. At present, many institutional investors actively use 50ETF options to hedge, trade volatility, develop new products, etc., and the option market is becoming more and more mature.
(6) wind: on the morning of November 16, Liu He, member of the Political Bureau of the CPC Central Committee, vice premier of the State Council and China's leader of the China US comprehensive economic dialogue, held a conversation with us trade representative and finance minister. The two sides held constructive discussions on their respective core concerns of the first phase agreement and will continue to maintain close exchanges..
1. StockMarket
(1) Indices Performance
During last week, Shanghai SE Composite Index (000001.SH) changed -2.46 % to 2891.34, Shenzhen Component Index (399001.SZ) changed -2.50 % to 9647.99, ChiNext Price Index (399006.SZ) changed - 2.13 % to 1674.78, CSI 300 INDEX (000300.SH) changed -2.41 % to 3877.09, CSI SmallCap 500 index (000905.SH) changed -2.40 % to 4868.44, SSE 50 Index (000016.SH) changed -1.92 % to 2954.70.
Graph 1: Indices Performance over past 3 months

The average daily turnover of the whole market during past 5 trading days is 387.34 billion CNY, it decreased 13.99% compared with the previous 5-trading day period.
Graph 2: Market turnover

In the view of sectors, during last week (from 2019-11-08 to 2019-11-15), 1 of 24 Wind Level-2 sector(s) increased while 23 sector(s) dropped. Specifically, Semiconductors & Semiconductor Equipment (2.06%), Health Care Equipment & Services(-0.78%) and Pharmaceuticals & Biotechnology(-
1.43%) did the best performance while Consumer Durables & Apparel(-4.99%), Financials(-4.94%) and Retailing(-4.84%) did the worst performance.
Graph 3: Sectors performance under Wind Level-2 classification (%)

(3) Indices Valuation (TTM)
The current PE for SSE Composite Index, Shenzhen Component Index, GEM Index, CSI300, SSE50, CSI500 are 12.5924, 23.3610, 51.1779, 11.7498, 9.4787, 25.4607respectively; and these indices are at 12.00%, 25.30%, 58.10%, 18.60%, 19.80%, 24.90% percent rank level of their historic data, respectively
Graph 4: PE of 6 indices

Graph 5: PE percent rank of 6 indices (calculated by data of past 1200 trading days, only 1Y data is presented on the graph)

The current PB for SSE Composite Index, Shenzhen Component Index, GEM Index, CSI300, SSE50, CSI500 are 1.5185,2.6827,4.7397,1.5190,1.2443, 2.0682respectively, and these indices are at 32.10%, 30.10%, 38.60%, 52.20%, 55.70%, 15.30% percent rank level of their historic data, respectively.
Graph 6: PB of 6 indices

Graph 7: PB percent rank of 6 indices (calculated by data of past 1200 trading days, only 1Y data is presented on the graph)

(4) Foreign Fund Flow
Last week, there were 5 trading days for northward channel open for stock connect programs. During last week the total foreign fund flow via Stock Connect is 1.79 billion RMB, and the cumulative inflows was 882.84 billion RMB. Specifically, the fund flow via Shanghai-Hong Kong Stock Connect is -1.09 billion RMB and the fund flow via Shenzhen-Hong Kong Stock Connect is 2.88 billion RMB.
Graph 8: Fund flow via both Shanghai and Shenzhen-Hong Kong Stock Connect in past 1M (100 million CNY)

Graph 9: Fund flow via Shenzhen-Hong Kong Stock Connect in past 1M (100 million CNY)

Graph 10: Fund flow via both Shanghai-Hong Kong Stock Connect in past 1M (100 million CNY)

2. Index Futures
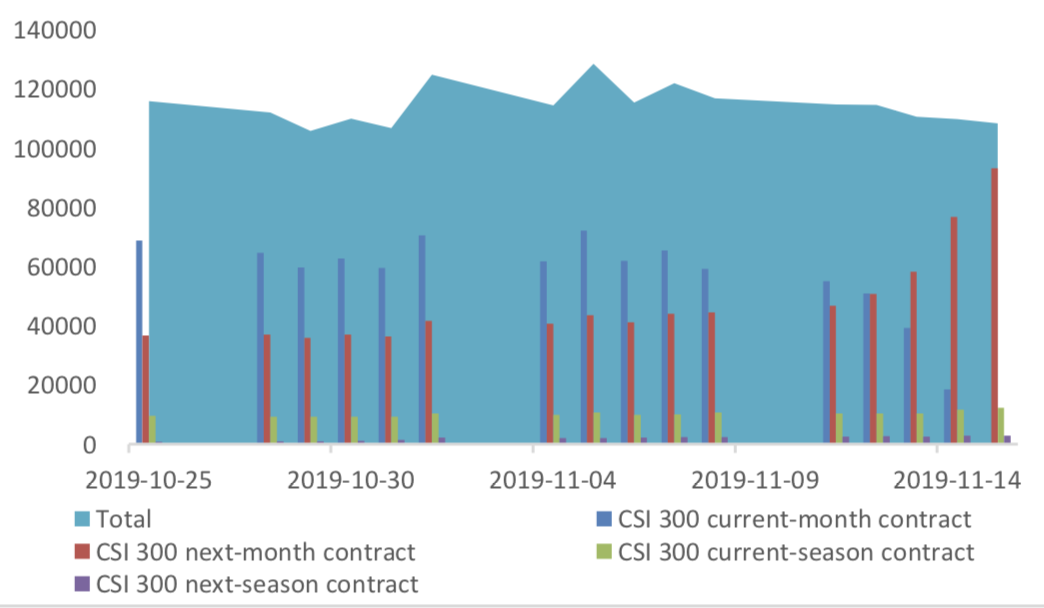
(1) Trading Volume and Open Interests
During past 5 trading days the average trading volume for CSI300(IF), SSE50(IH), CSI500(IC) contracts
are 88552 (0.81%, the previous 5-trading day period),34186 (1.13%),93085 (2.96%) lots, respectively. On the last trading day, the total open interests for them are 108404 (-7.25%),56506 (-3.87%),157666 (-2.46%) lots respectively.
Graph 11: CSI300 Index futures’ trading volume

Graph 12: CSI300 Index futures’ open interests
Graph 13:SSE50 Index futures’ trading volume

Graph 14: SSE50 Index futures’ open interests

Graph 15: CSI500 Index futures’ trading volume

Graph 16: CSI500 Index futures’ open interests

(2) Roll Level Bid-Ask Distribution
There are 5 trading days during last week, so the distribution is worked out with 36005 data points for each contract pair.
Graph 17: CSI300 Current/Next Month Contract Roll Spread Distribution (2s frequency)

Graph 18: SSE50 Current/Next Month Contract Roll Spread Distribution (2s frequency)

Graph 19: CSI500 Current/Next Month Contract Roll Spread Distribution (2s frequency)

(3) Weekly Review of Future/Spot Arbitrage Opportunity
Assumption: risk-free rate: 3%; security borrowing cost: 8%; trading expense for spot: 0.025%; trading expense for futures: 0.005%; margin rates for futures contracts: 0.11 for CSI300 and SSE50, 0.13 for CSI500; margin rate for security borrowing: 0.3 (or 130% maintain rate).
When real price spread is out of theoretical range (calculated by our assumption), there exists absolute future-spot arbitrage opportunity.
Graph 20: Future (Current Month)-Spot Arbitrage Opportunity for CSI300 contract (in the view of price difference)
Graph 21: Future (Current Month)-Spot Arbitrage Opportunity for SSE50 contract (in the view of price difference)

Graph 22: Future (Current Month)-Spot Arbitrage Opportunity for CSI500 contract (in the view of price difference)

Graph 23: Future (Next Month-Current Month) Arbitrage Opportunity for CSI300 contract (in the view of price difference)

Graph 24: Future (Next Month-Current Month) Arbitrage Opportunity for SSE50 contract (in the view of price difference)

Graph 25: Future (Next Month-Current Month) Arbitrage Opportunity for CSI500 contract (in the view of price
difference)

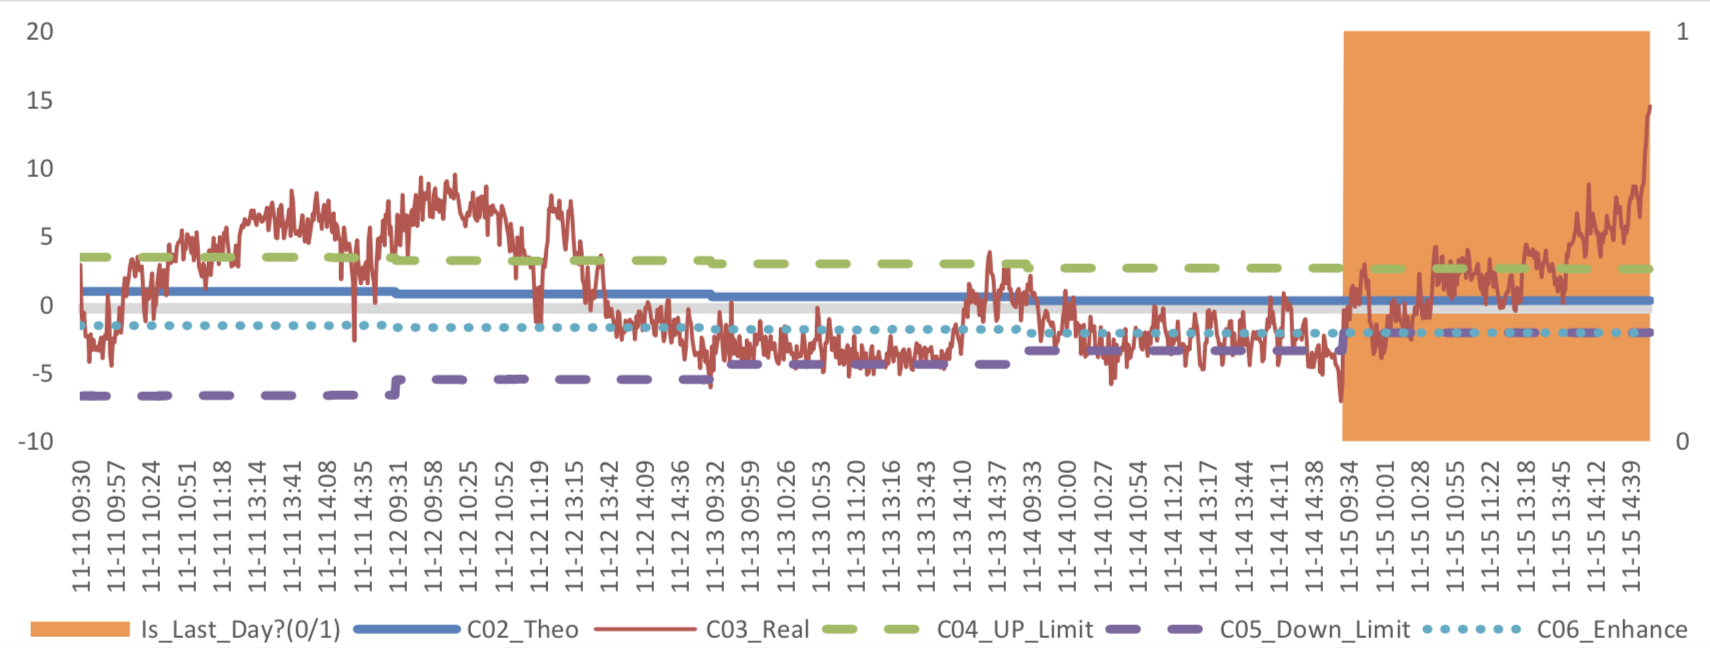
(4) Roll Spread of Stock Index Futures Tracking
Calculated as the contract price of the current month minus the contract price of the following month, for the long roll, the positive calculation results are gains, the negative calculation results are losses. Code 00 in the figure represents the current month contract, 01 the next month contract, 02 the current quarter contract, 03 the next quarter contract.
(a)IF
Up to2019/11/15,the best roll plan is IF00-IF01,annualized roll yield in monthly term is6.99%。
Graph 26: IF Current month contract roll yield comparison (index point)

Graph 27: IF Current month contract roll yield comparison (annualized return)

(b)IH
Up to 2019/11/15,the best roll plan is IH00-IH01,annualized roll yield in monthly term is4.31%。
Graph 28: IH Current month contract roll yield comparison (index point)

Graph 29: IH Current month contract roll yield comparison (annualized return)

(c)IC
Up to2019/11/15,the best roll plan isIC00-IC01,annualized roll yield in monthly term is47.92%。
Graph 30: IC Current month contract roll yield comparison (index point)

Graph 31: IC Current month contract roll yield comparison (annualized return)

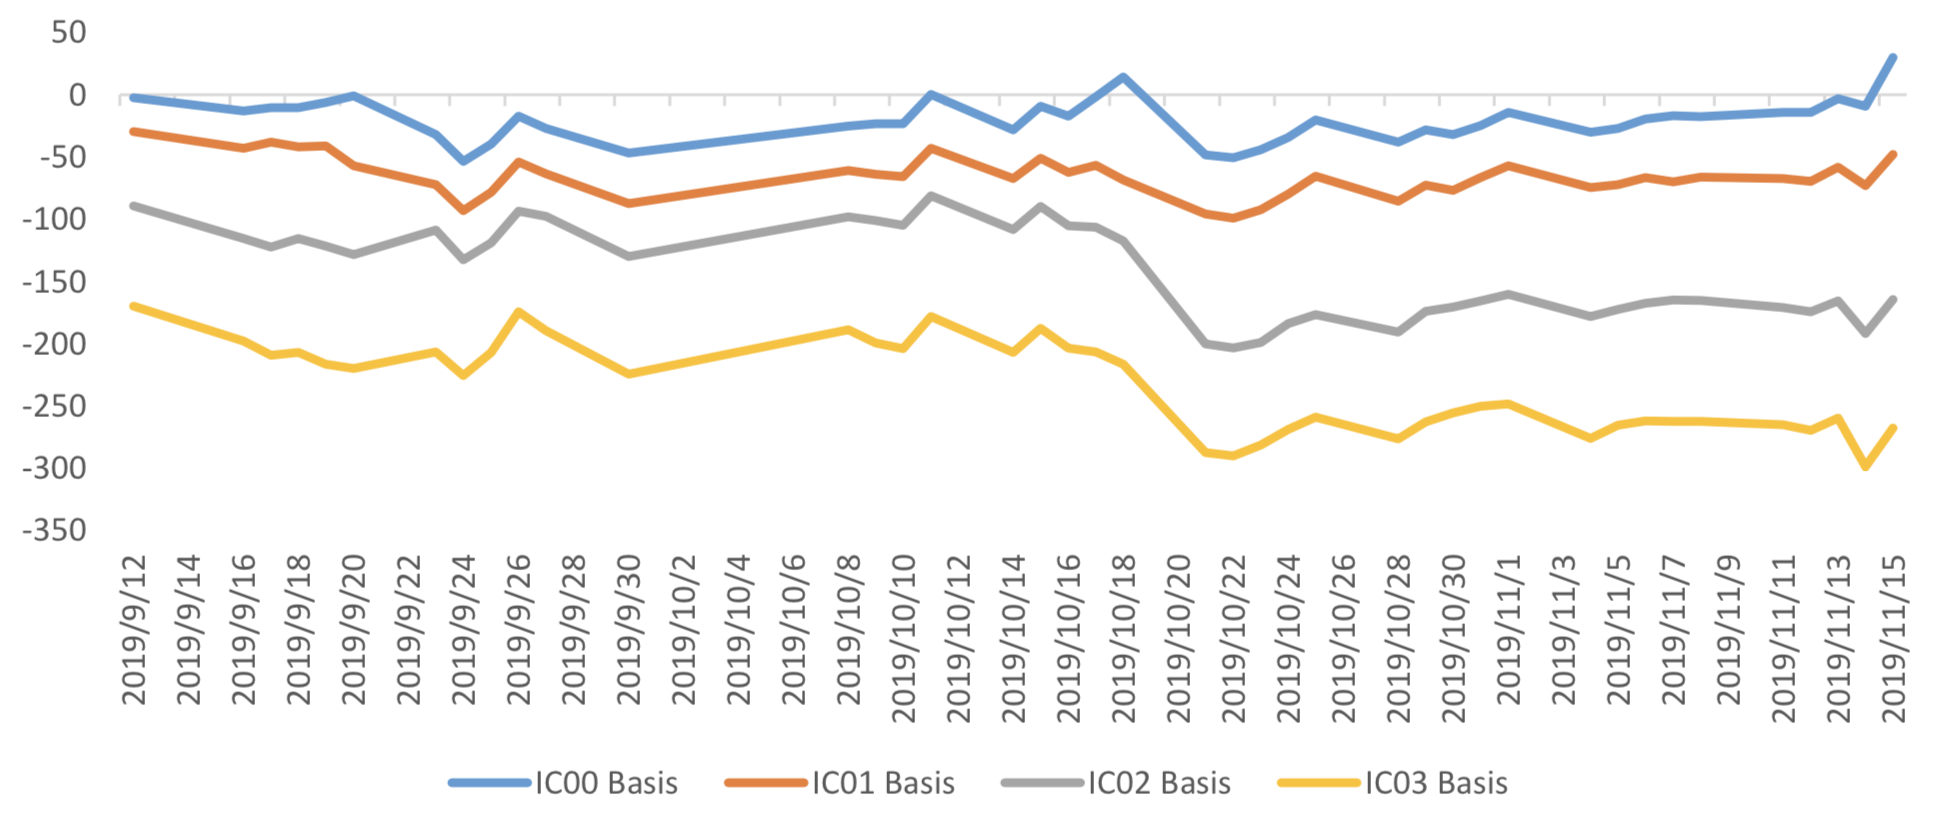
(5) Basis Tracking of Stock Index Futures
For long side, if the base difference is positive, the change of the base difference brings losses, and if the base difference is negative, the change of the base difference brings profits.
(a)IF
For long side hedge, up to 2019/11/15,IF00 and IF01 were in premium, other IF contracts were in discount. Here IF next month contract basis return annualized yield is -0.59%。
Graph 32: IF contracts basis


(b)IH
For long side hedge, up to 2019/11/15,IH00 and IH01 were in premium, other IH contracts were in
discount. Here IH next month contract basis return annualized yield is -1.01%。
Graph 33: IH contracts basis
Table 2: IH basis return calculation
(c)IC
For long side hedge, up to 2019/11/15,IC00 was in premium, other IC contracts were in discount..
Here IC next month contract basis return annualized yield is 11.84%。
Graph 34: IC contracts basis
Table 3: IC basis return calculation
3. Financial Markets
(1) Interest Rates
The term structure of treasury bonds’ yields is currently upward sloping in concave shape.
Specifically, last week, short-term yields short term yield of Treasury bond experienced some fluctuation and 3M yield now at 2.4%-2.6% level. Furthermore, as for long-term yield, there is a small drop. 10Y yield is about 3.2%-3.4%.
Graph 35: Term Structure Evolvement of Treasury Bonds Yields During Recent 3 Months (%)
As for Shibor rates, short-term rates experienced significant fluctuation. Specifically, O/N rate experienced obvious fluctuation to 2.6%-2.8% level.
Graph 36: Term Structure Evolvement of Shibor Rates During Recent 3 Months (%)
(2) ExchangeRates
During last week, CNY/USD changed 0.339% to 7.0121 and offshore rate, CNH/USD, changed 0.24% to 7.0053 and USD index changed -0.39%.
Graph 37: USD/CNY, USD/CNH and USD Index
Macroeconomic Topic:
The data show that, in October, the scale of new social financing dropped, showing a significant decrease, only 618.9 billion yuan, compared with the previous value of 737.3 billion yuan. And the month on month decrease was also obvious, from 2331.5 billion yuan to 618.9 billion, a drop of 73.4%
October Finance Data
(1) Social Financing Data
Graph A: Total Social Financing Data(100m RMB)
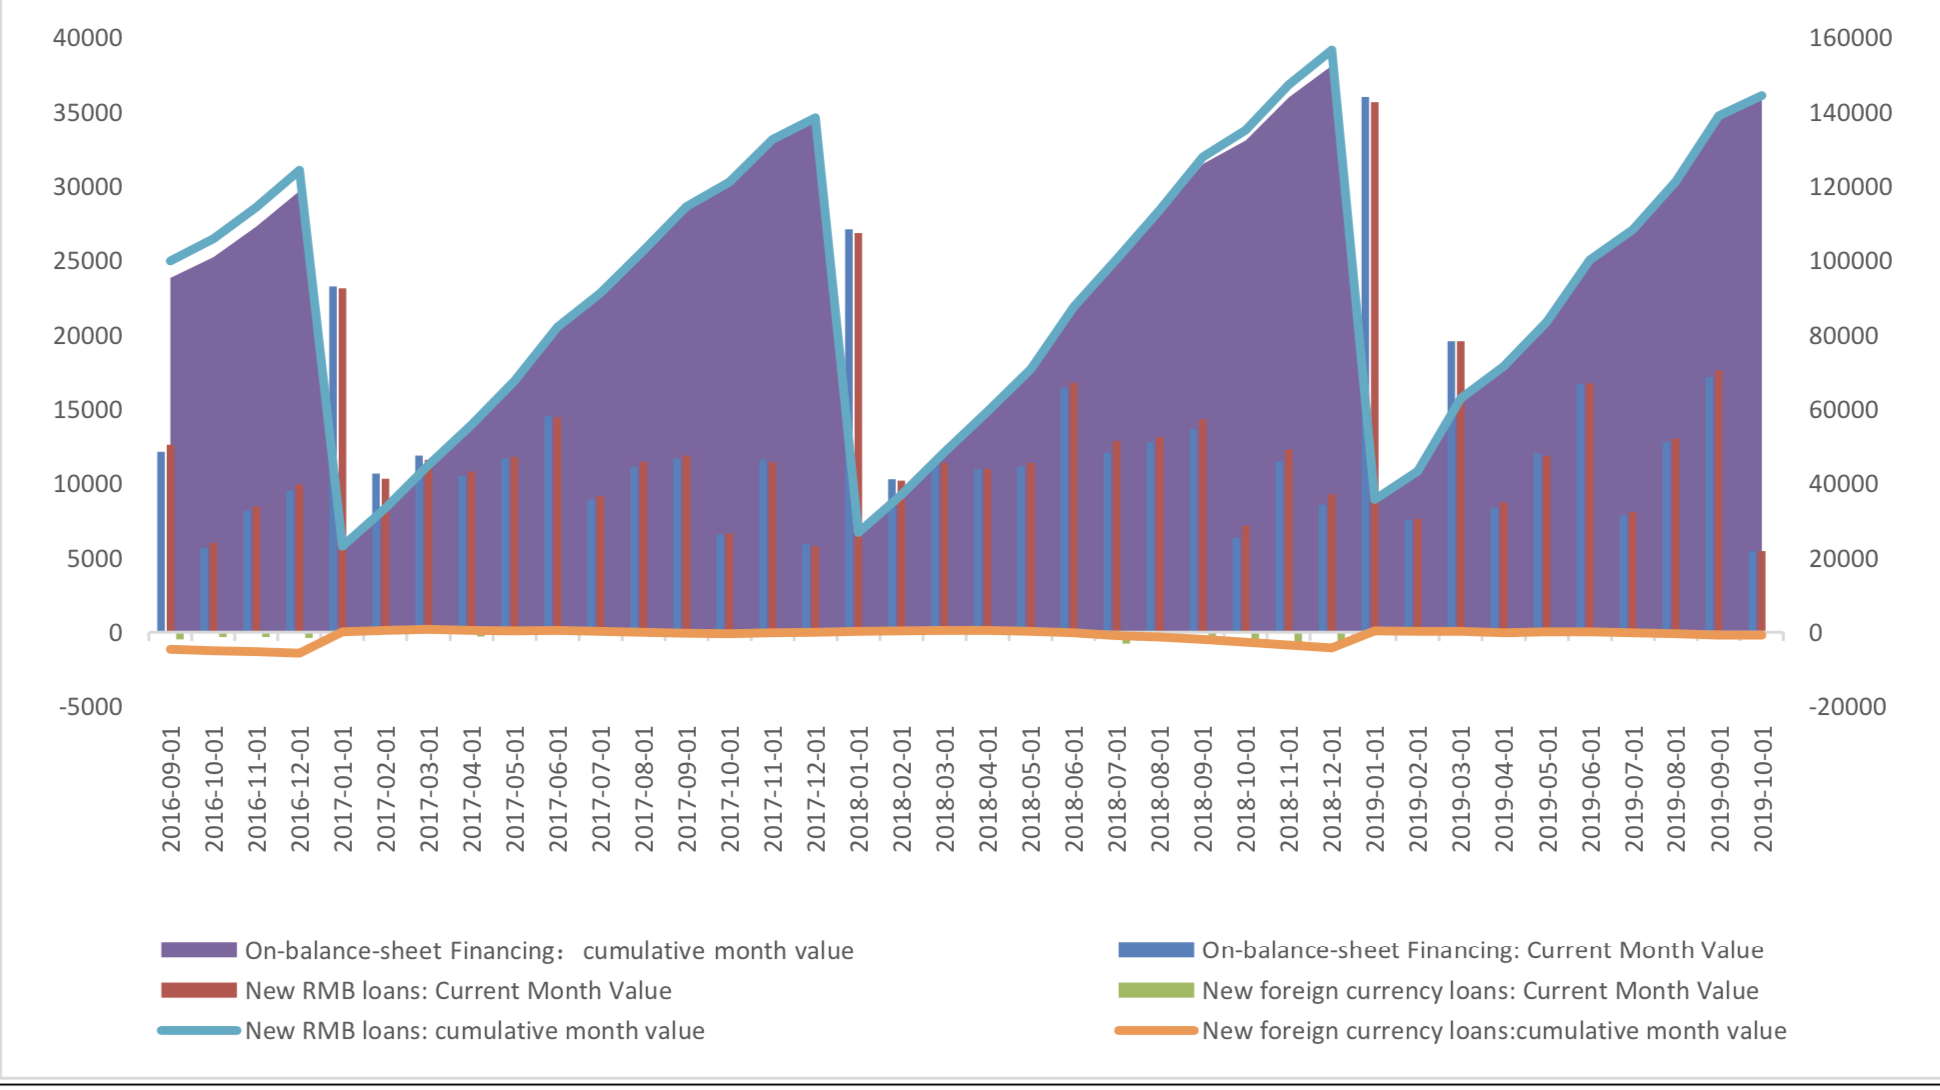
In on-balance-sheet financing, in terms of RMB loans, 546 billion yuan was added in October, dropped from 1717 billion yuan from last month, and also below than value, 634 billion, at the same period of last year. New RMB loans accounted for 88.4% of the new social financing scale.
Graph B: On-balance-sheet Financing Data(100m RMB)
From the perspective of new off-balance sheet financing, it still faced an obvious contraction in October. Contraction speed up. In October it report - 112.472 billion yuan, the previous value is – 234 billion yuan lower than pre-value -112 billion.
Graph C: Off-balance-sheet Financing Data(100m RMB)
In terms of the direct financing, the direct financing of enterprises was 180 billion yuan, obviously higher compared with the same period last year due to low base, but with the ring ratio decreased substantially, mainly because of the decrease in corporate bond financing, only 162 billion yuan, drop 25.8% in ring ratio.
Graph D: Direct Financing Data(100m RMB)
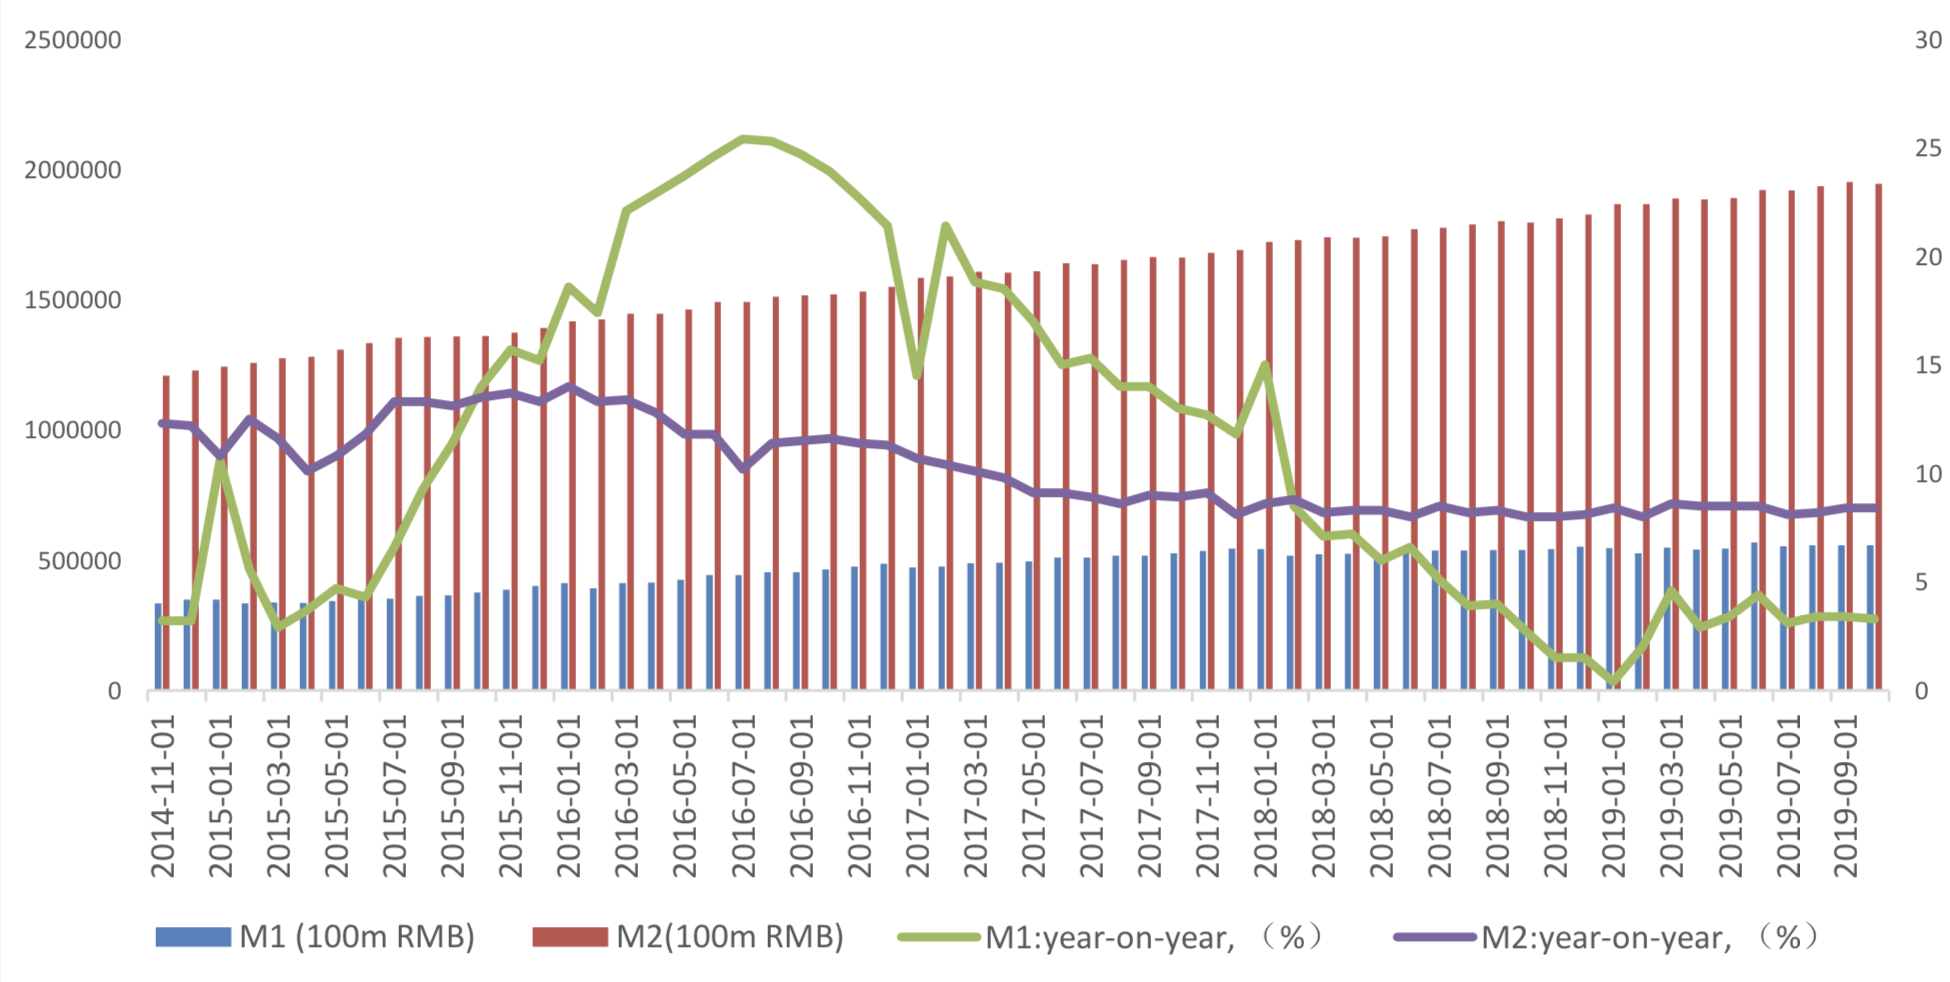
(2) Monetary Data
In October, M2 kept 8.4%, and M1 dropped from 3.4% to 3.3%, and the difference between M2 and M1 increase from 5% to 5.1%.
Graph E: M1 and M2 data
(3) Summary
In October, the scale of social financing fell, and the long holiday was a factor According to historical data, October is a low point due to long holiday. The proportion of new RMB loans increased with the decrease of new local debts and new off balance sheet businesses.


Currently no Comments.
Hot Topics
The 13rd China International Future Forum
The Shanghai Derivatives Energy Forum has received extensive attention from relevant industries both within and outside the borders.
Financial institutions deep explore commodity market opportunities, commodity index financial products show full-scale trend
R-Code for analysis: getKDJ
R-Code@June 06, 2016
New indicator to analyze the arbitrage opportunities between sse50 and csi500
Market review: January 11, 2017
The Great China Bubble: Anniversary Lessons and Outlook
Quant Investment in China A-share market
The hedge strategy between SSE50 and A50--Jan 13,2017
The arbitraging strategy between CSI300 and SSE50
Market review: June 17, 2016
Sleepless in London--Enda Homan(Allied Irish Banks Plc)
MSCI Rebuffs Chinese Equities for Third Time in Blow to Xi
Soros, Druckenmiller among hedgies profiting in market plunge