FangQuant › Financial Futures
Market Summary:
Last week, there was generally decrease over the market. Shanghai SE Composite Index (000001.SH) changed -0.54 % to 3075.50. Specifically, small cap shares perform better than large cap shares and we can observe that CSI500 did better than SSE50 (0.54% vs -0.48%). The average daily turnover of the whole market during past 5 trading days is 732.63 billion CNY, it increased 13.67% compared with the previous 5-trading day period.
With the signing of the first stage trade agreement, the conflict between China and US came to a temporary shutdown. Recently, the exchange rate of RMB has risen significantly. During last week, CNY/USD changed -1.622% to 6.8585 and offshore rate, CNH/USD, changed -0.77% to 6.9138.
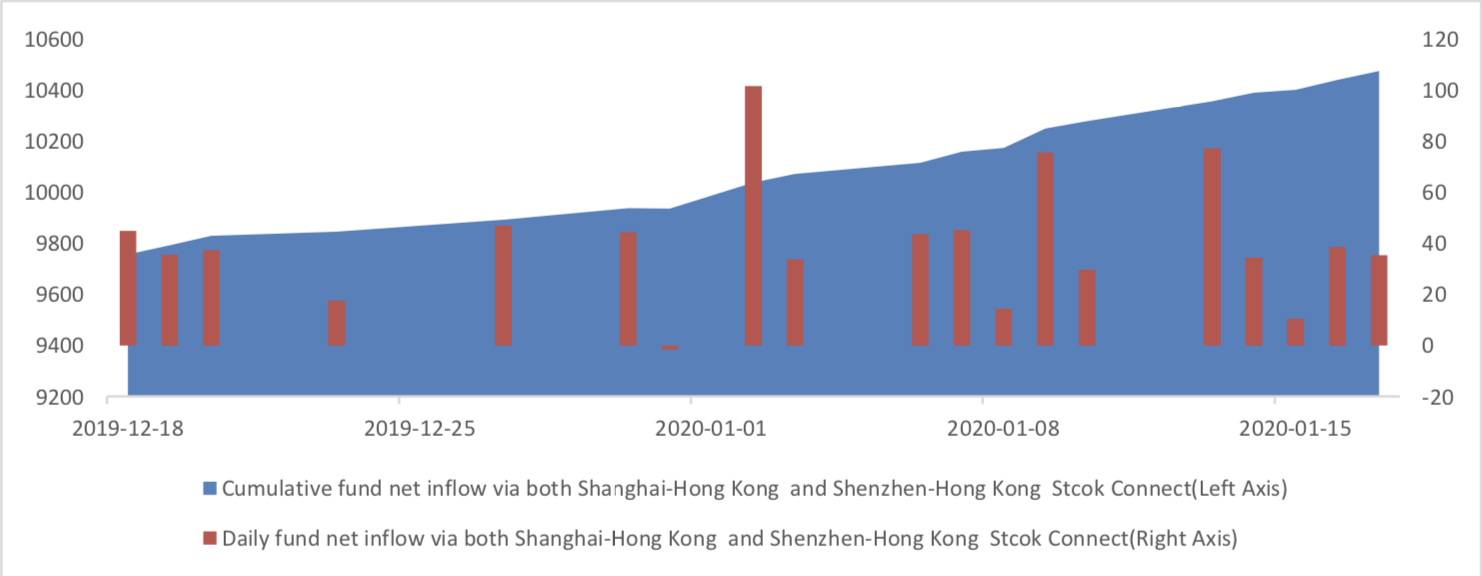
Foreign funds kept flowing in A-shares. During last week the total foreign fund flow via Stock Connect is 19.55 billion RMB, and the cumulative inflows was 1047.33 billion RMB, creating a new high.
As for arbitrage opportunity, all futures current-month contracts show some room for arbitrage opportunities. No price spread for next-month/current month contracts show room for arbitrage.
News:
(1) Shanghai Securities News: in the current wave of digital transformation, many banks and non-bank financial institutions are laying out and preparing to build a "data mid-desk" system, even rising to a strategic height. According to the interviewees, for financial institutions, to build a "data mid-desk " system, on the one hand, it can flexibly and quickly support the changeable business needs of the front-end; on the other hand, it can solve the data governance problems, tap the value of data assets, and better enable the front-line business.
(2) S & P believes that until the 2020 election, it is unlikely that significant changes will occur to the financial regulatory rules of the United States. If trump is re-elected, it is not expected that the financial supervision of institutions such as the consumer financial protection agency will increase. But if the Democratic candidate wins, the party may want to strengthen financial scrutiny. It is expected that stricter supervision of banks will help financial companies to play their advantages.
(3) Broker China: under the global low interest rate environment, the comparative advantage of Chinese assets is further highlighted. Last year, foreign investors continued to increase their holdings of domestic stocks, bonds and other financial assets. This year, the trend of "buy and buy" is expected to continue. By the end of December 2019, overseas institutions and individuals held 2.10 trillion yuan of domestic stocks and 2.26 trillion yuan of domestic bonds.
(4) China News Weekly: statistics show that as of January 14, more than 210 listed companies of A-share have issued the 2019 performance forecast of loss, pre reduction or slight reduction, which is the main culprit of the performance decline or loss, and the huge goodwill impairment occurs frequently.
(5) China News Agency: Cai Fang, vice president of the Academy of Social Sciences: China's middle- income group is between 500 million and 700 million people, the largest middle-income group in the world, laying the foundation for the formation of a large-scale consumer market.
(6) In order to hedge the impact of factors such as the peak of cash delivery and maintain the reasonable and abundant liquidity of the banking system before the Spring Festival, the central bank launched a 14 day reverse repo operation of RMB 200 billion in the form of interest rate bidding on January 19, with the bid winning rate of 2.65%, which was the same as the previous one.
1. StockMarket
(1) Indices Performance
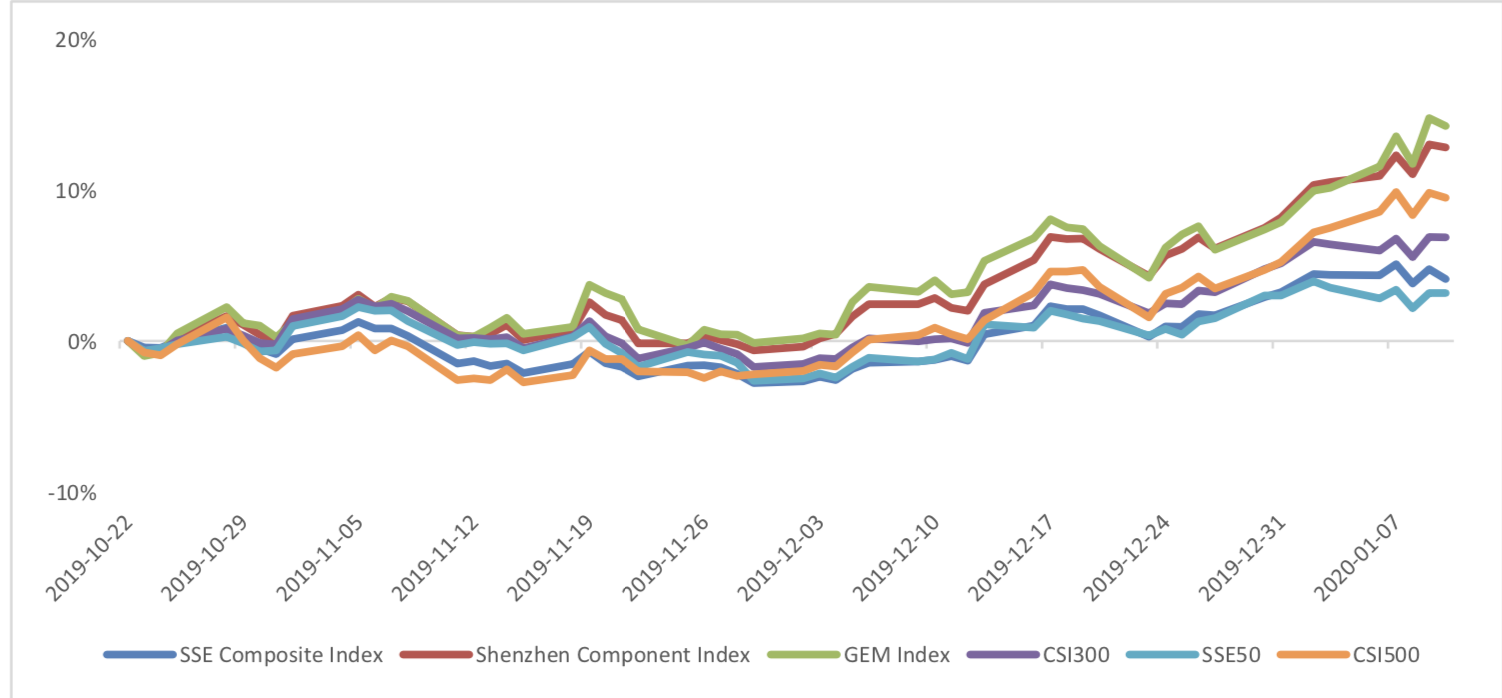
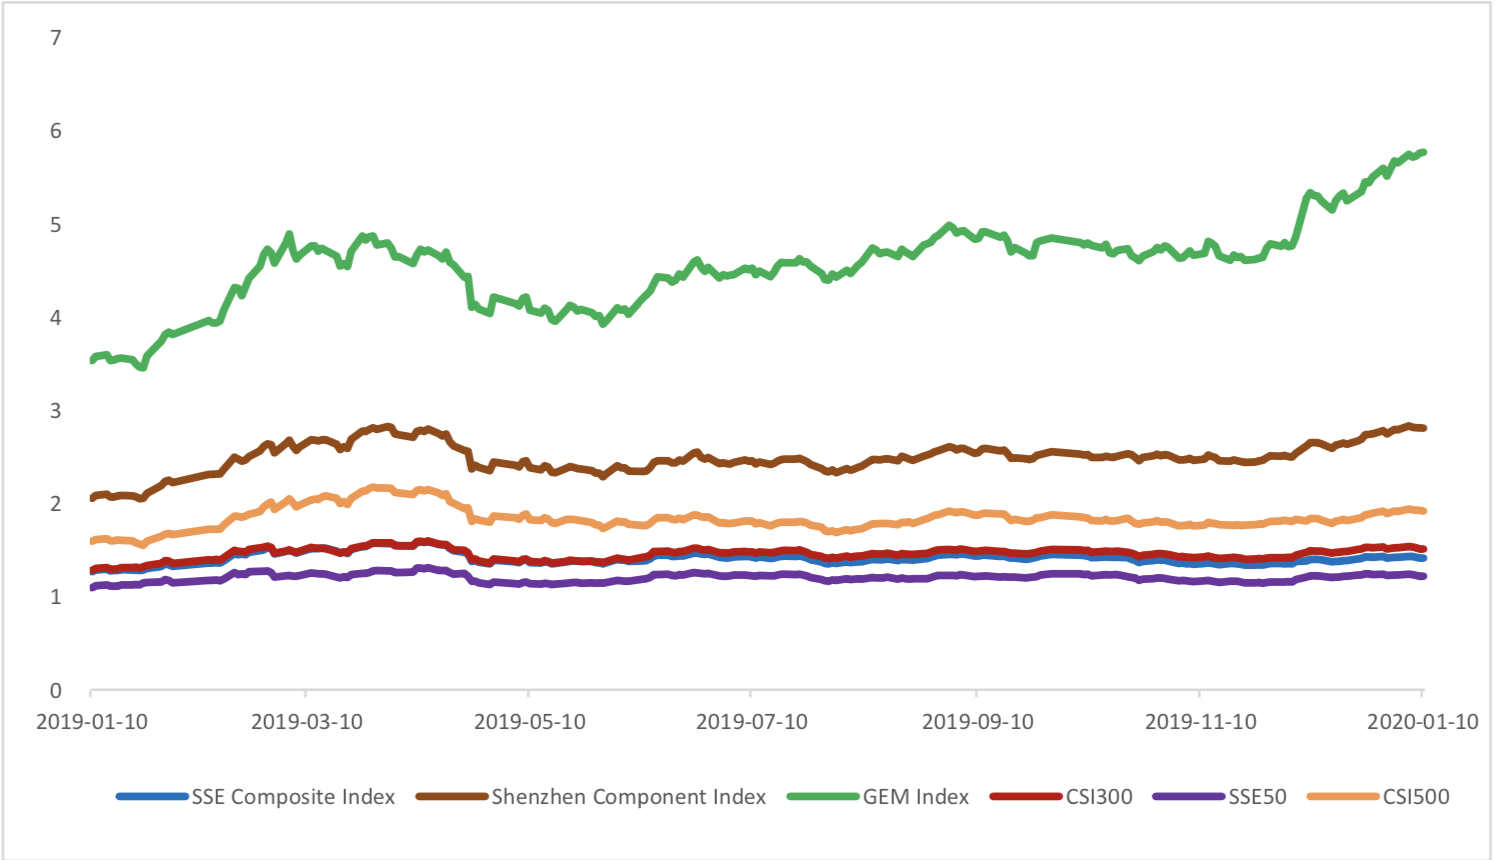
During last week, Shanghai SE Composite Index (000001.SH) changed -0.54 % to 3075.50, Shenzhen Component Index (399001.SZ) changed 0.69 % to 10954.39, ChiNext Price Index (399006.SZ) changed 1.49 % to 1932.51, CSI 300 INDEX (000300.SH) changed -0.20 % to 4154.85, CSI SmallCap 500 index (000905.SH) changed 0.54 % to 5510.05, SSE 50 Index (000016.SH) changed -0.48 % to 3053.17.
Graph 1: Indices Performance over past 3 months
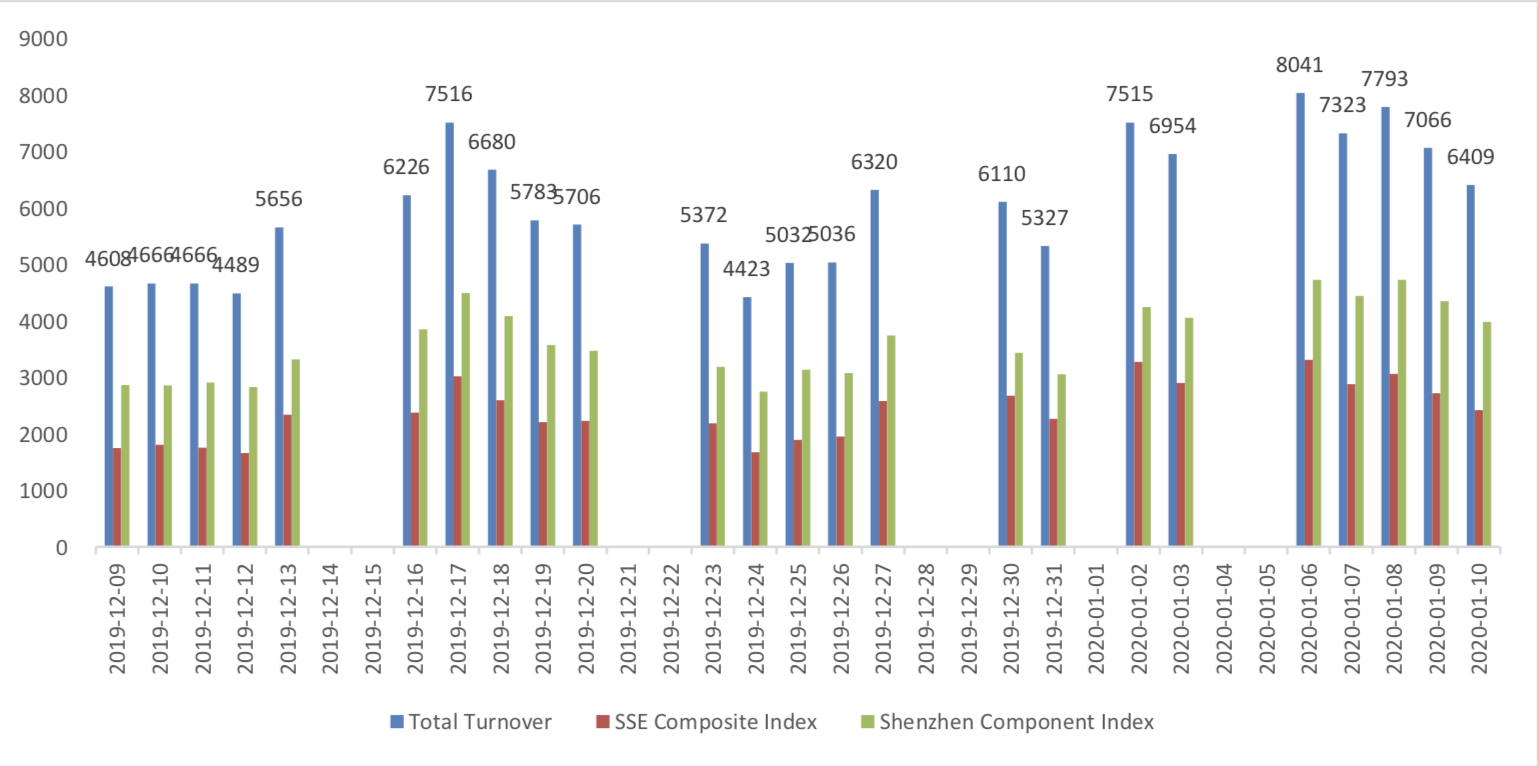
The average daily turnover of the whole market during past 5 trading days is 732.63 billion CNY, it increased 13.67% compared with the previous 5-trading day period.
Graph 2: Market turnover
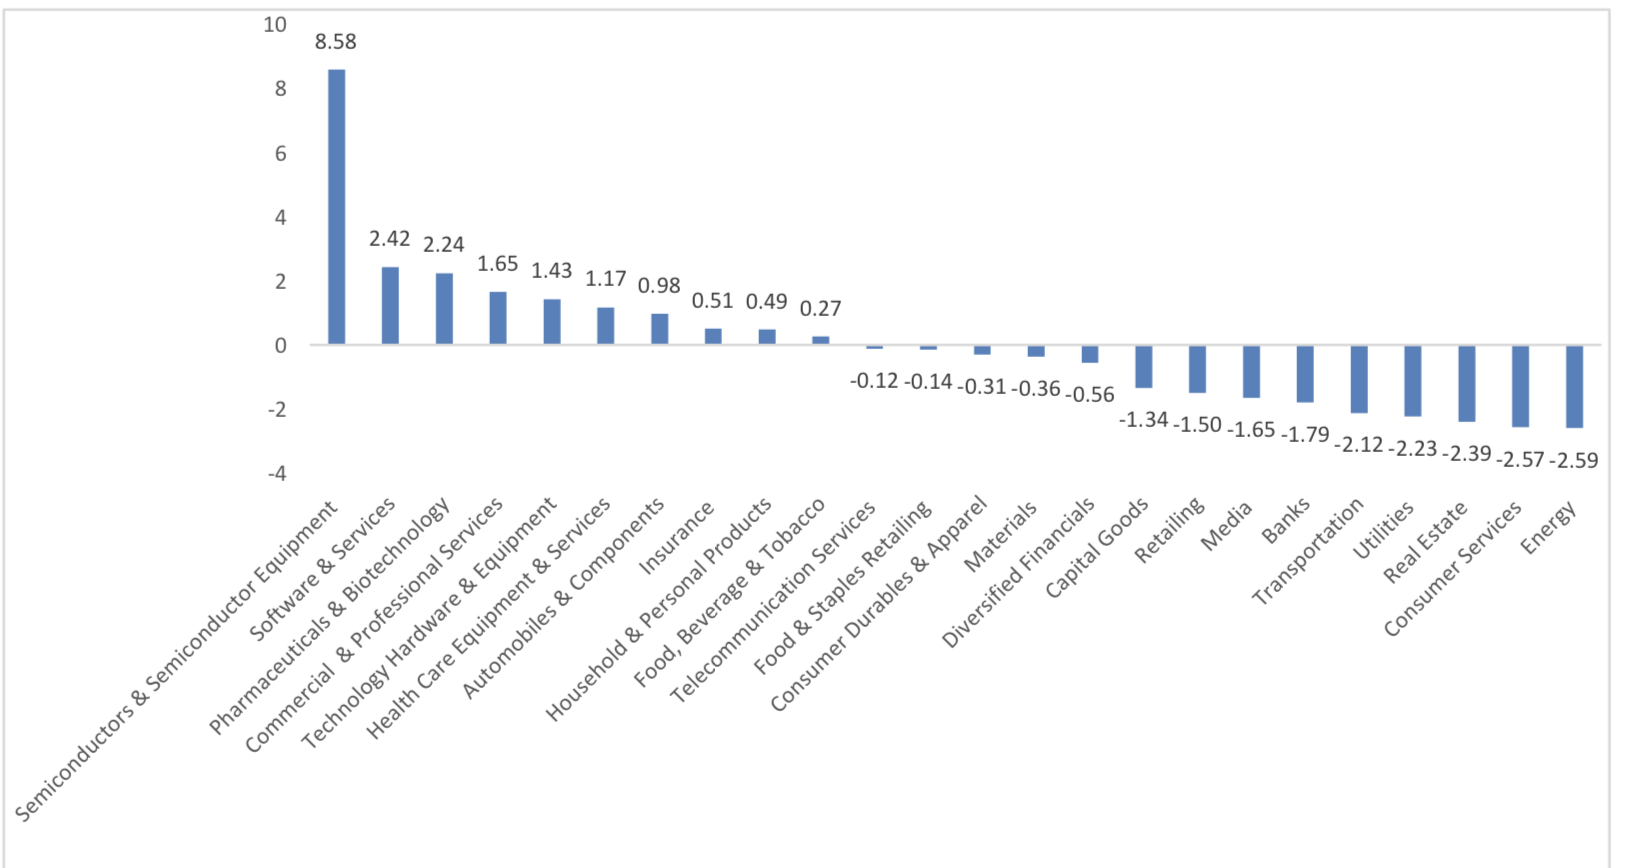
In the view of sectors, during last week (from 2020-01-10 to 2020-01-17), 10 of 24 Wind Level- 2 sector(s) increased while 14 sector(s) dropped. Specifically, Semiconductors & Semiconductor Equipment (8.58%), Software & Services(2.42%) and Pharmaceuticals & Biotechnology(2.24%) did the best performance while Energy (-2.59%), Consumer Services (-2.57%) and Real Estate (-2.39%) did the worst performance.
Graph 3: Sectors performance under Wind Level-2 classification (%)
(3) Indices Valuation (TTM)
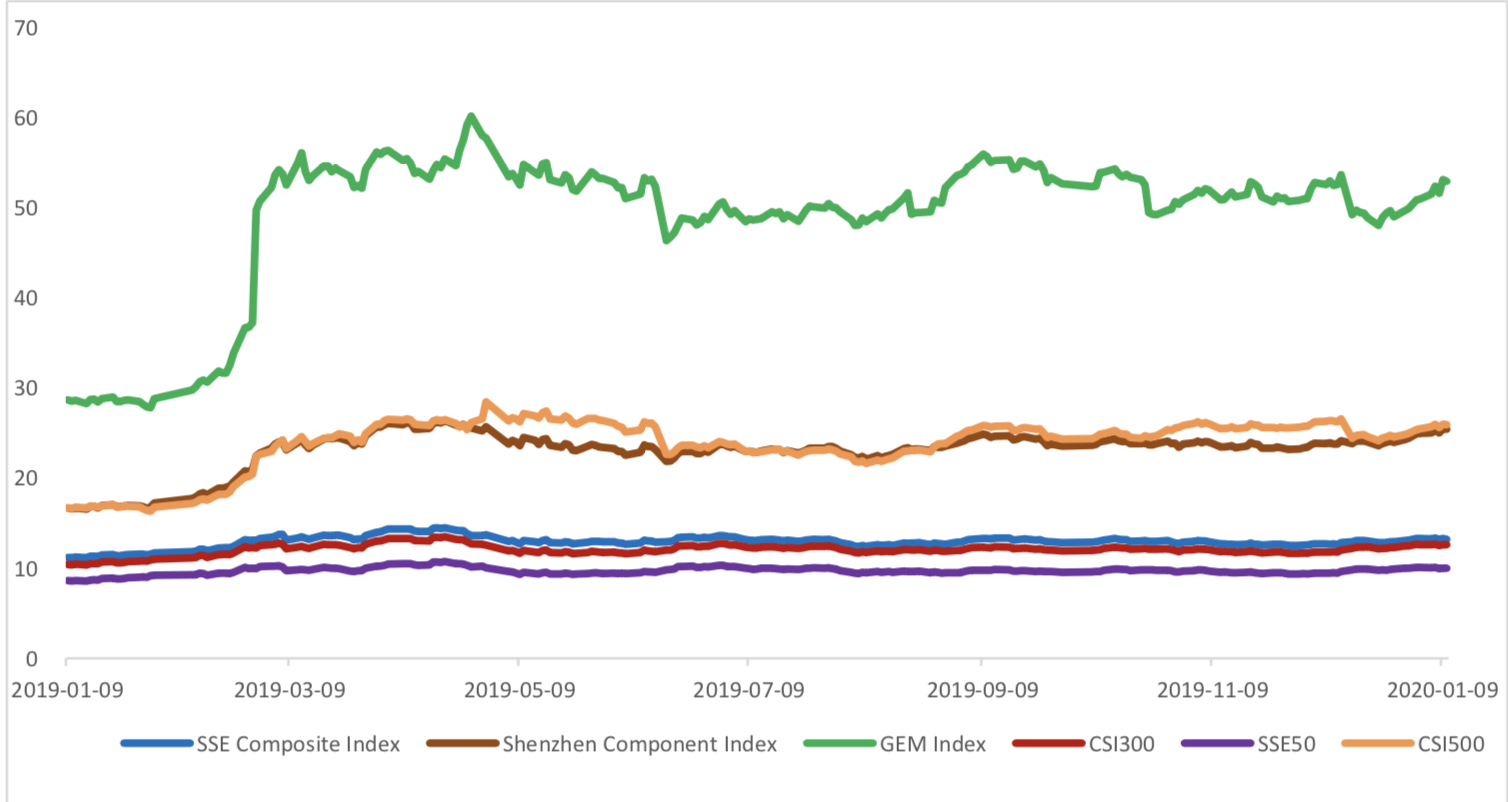
The current PE for SSE Composite Index, Shenzhen Component Index, GEM Index, CSI300, SSE50, CSI500 are 13.1831, 25.4187, 52.9258, 12.6175, 9.9871, 25.9170respectively; and these indices are at 27.30%, 40.20%, 65.30%, 44.90%, 42.50%, 30.30% percent rank level of their historic data, respectively
Graph 4: PE of 6 indices
Graph 5: PE percent rank of 6 indices (calculated by data of past 1200 trading days, only 1Y data is presented on the graph)

The current PB for SSE Composite Index, Shenzhen Component Index, GEM Index, CSI300, SSE50, CSI500 are 1.4116,2.8077,5.7687,1.5125,1.2175, 1.9189respectively, and these indices are at 19.00%, 35.40%, 65.70%, 53.00%, 43.10%, 26.10% percent rank level of their historic data, respectively.
Graph 6: PB of 6 indices
Graph 7: PB percent rank of 6 indices (calculated by data of past 1200 trading days, only 1Y data is presented on the graph)

(4) Foreign Fund Flow
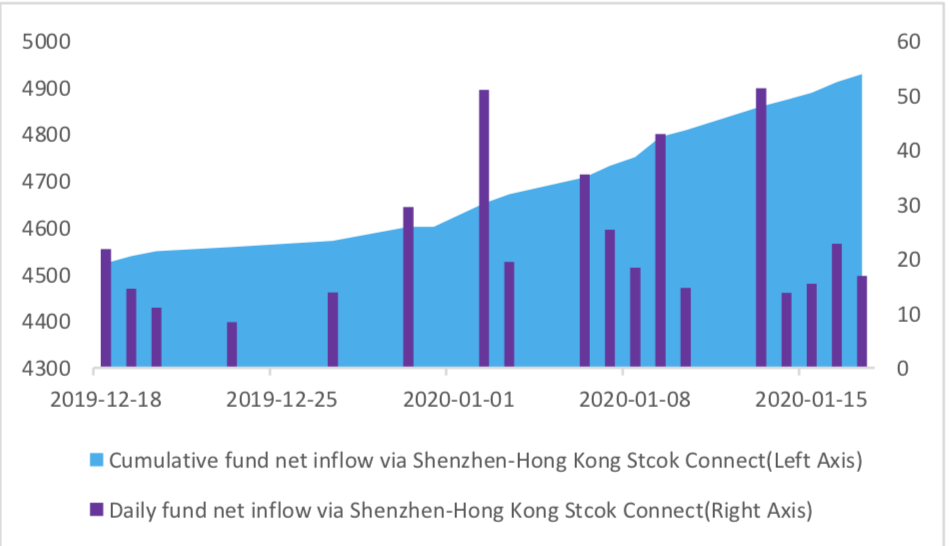
Last week, there were 5 trading days for northward channel open for stock connect programs. During last week the total foreign fund flow via Stock Connect is 19.55 billion RMB, and the cumulative inflows was 1047.33 billion RMB. Specifically, the fund flow via Shanghai-Hong Kong Stock Connect is 7.54 billion RMB and the fund flow via Shenzhen-Hong Kong Stock Connect is 12.01 billion RMB.
Graph 8: Fund flow via both Shanghai and Shenzhen-Hong Kong Stock Connect in past 1M (100 million CNY)
Graph 9: Fund flow via Shenzhen-Hong Kong Stock Connect in past 1M (100 million CNY)
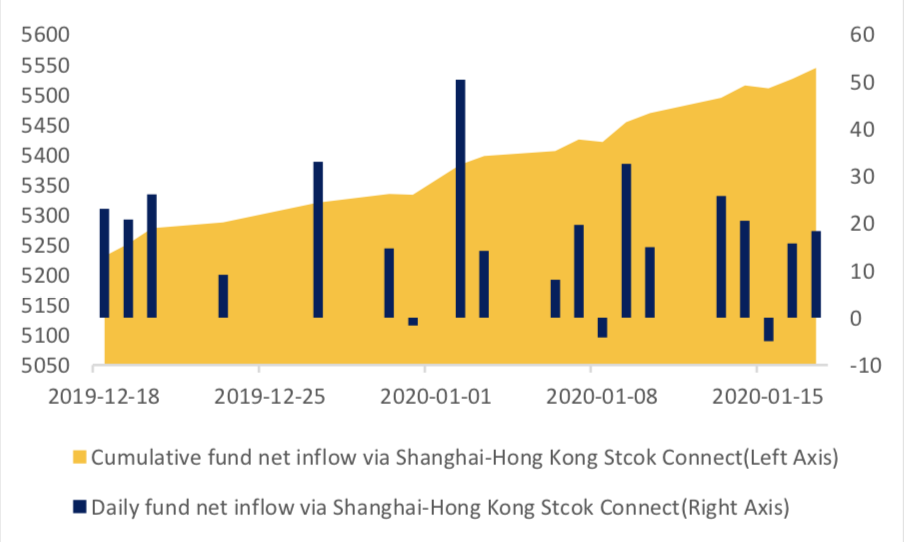
Graph 10: Fund flow via both Shanghai-Hong Kong Stock Connect in past 1M (100 million CNY)
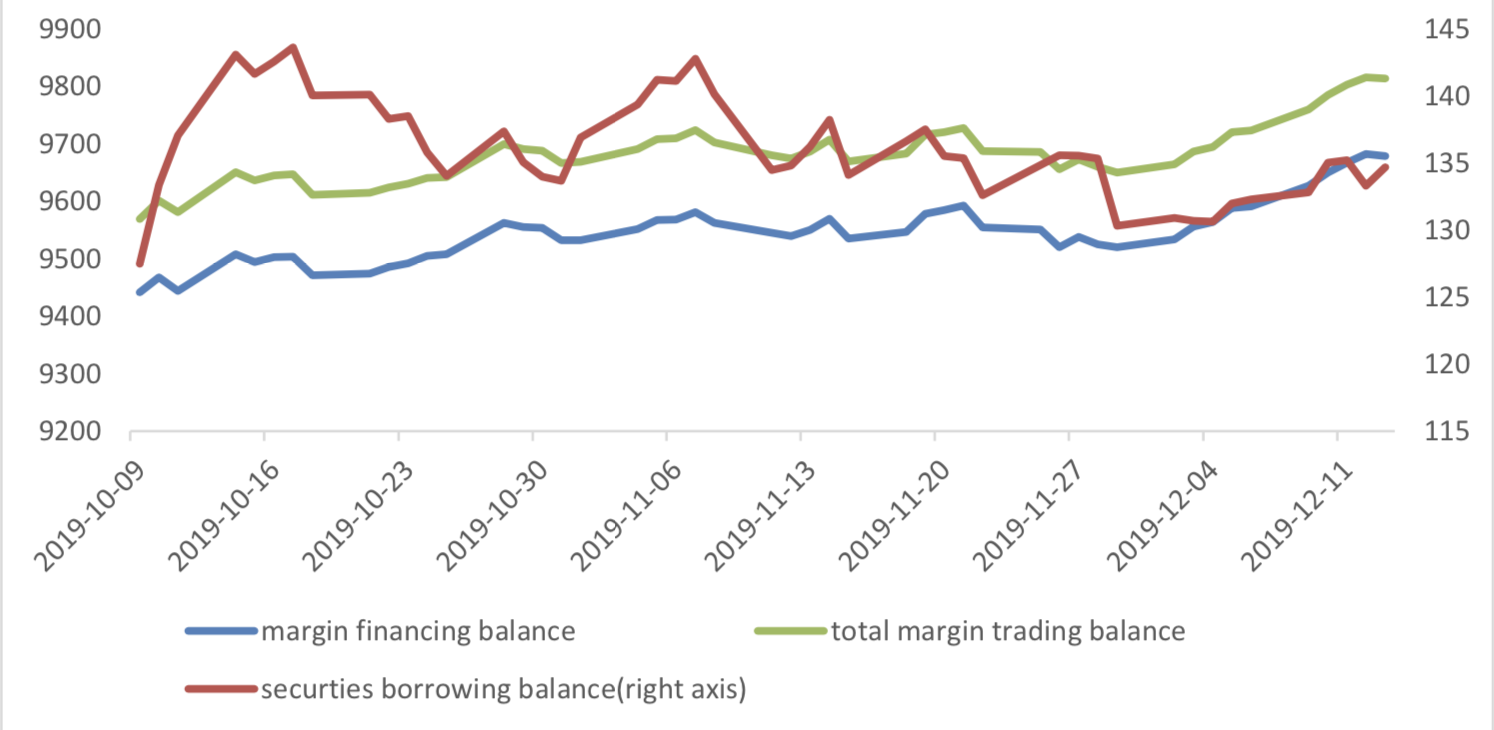
(5) Margin Trading
According to the newest data, the margin financing balance is 967.84 billion, securities borrowing is
13.47 billion, totally 981.31 billion.
Graph 11: Margin Trading(100m RMB)
2. Index Futures
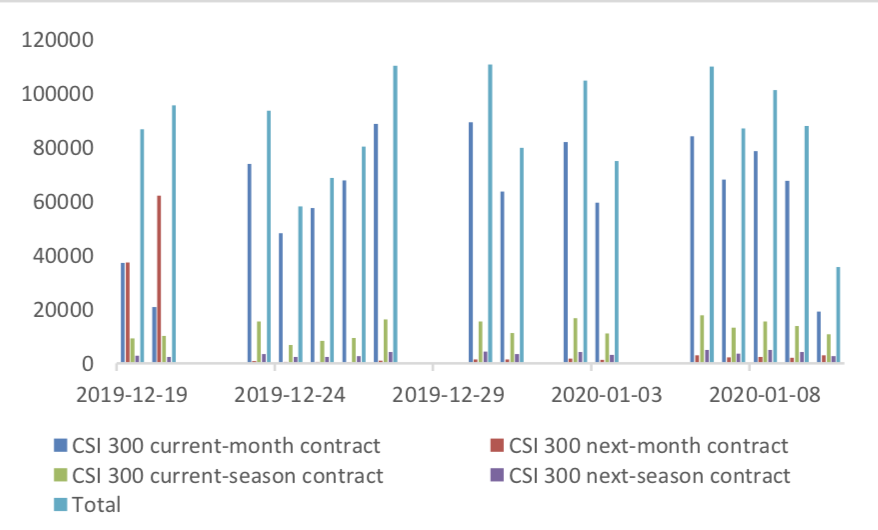
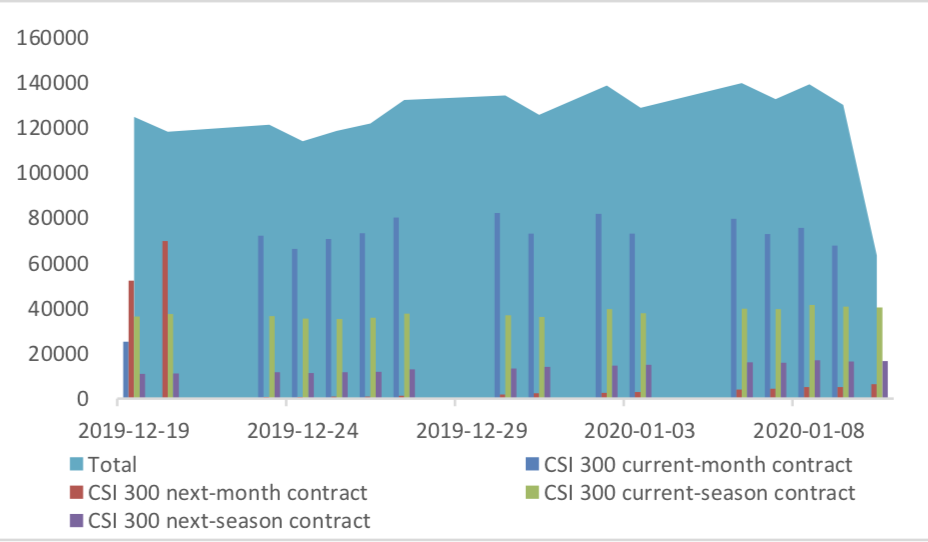
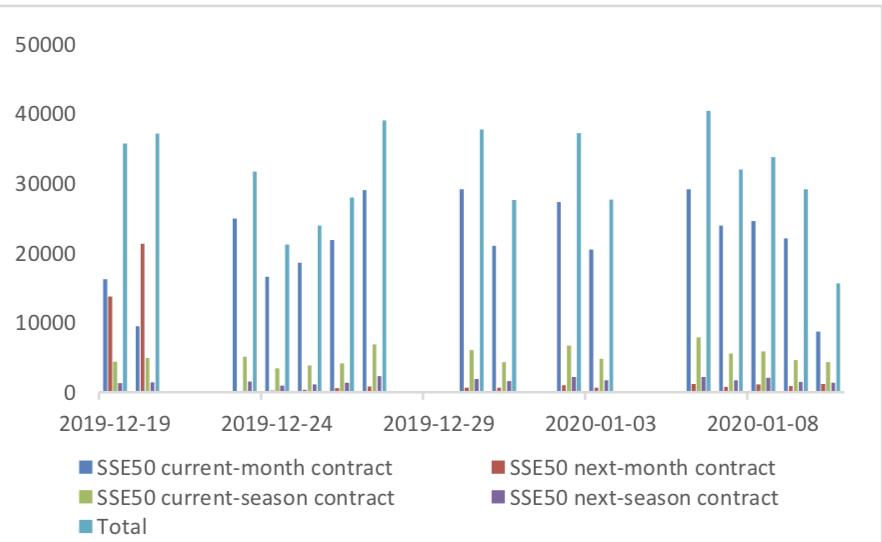
(1) Trading Volume and Open Interests
During past 5 trading days the average trading volume for CSI300(IF), SSE50(IH), CSI500(IC) contracts
are 84259 (-12.18%, the previous 5-trading day period),30154 (-10.82%),96272 (2.85%) lots, respectively. On the last trading day, the total open interests for them are 63297 (-50.80%),32690 (-44.17%),107844 (- 34.67%) lots respectively.
Graph 12: CSI300 Index futures’ trading volume
Graph 13: CSI300 Index futures’ open interests
Graph 14:SSE50 Index futures’ trading volume
Graph 15: SSE50 Index futures’ open interests
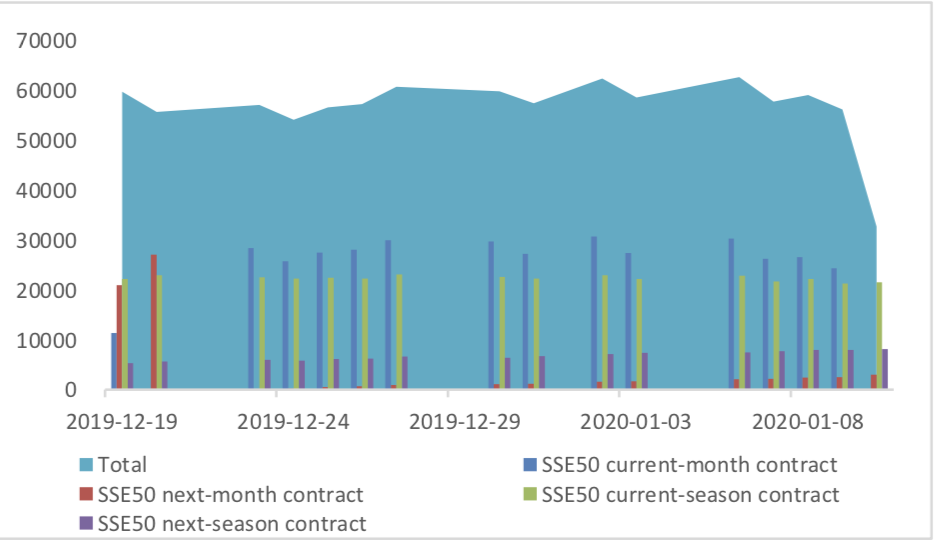
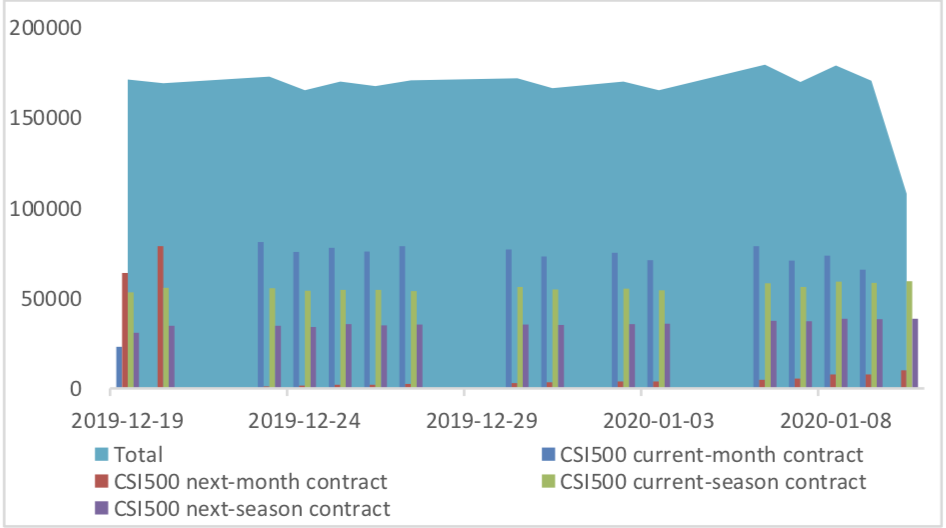
Graph 16: CSI500 Index futures’ trading volume
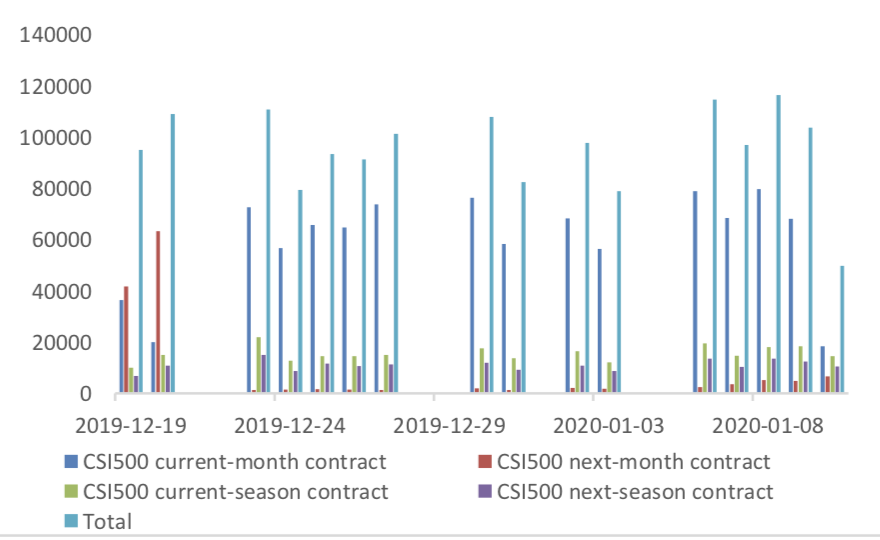
Graph 17: CSI500 Index futures’ open interests
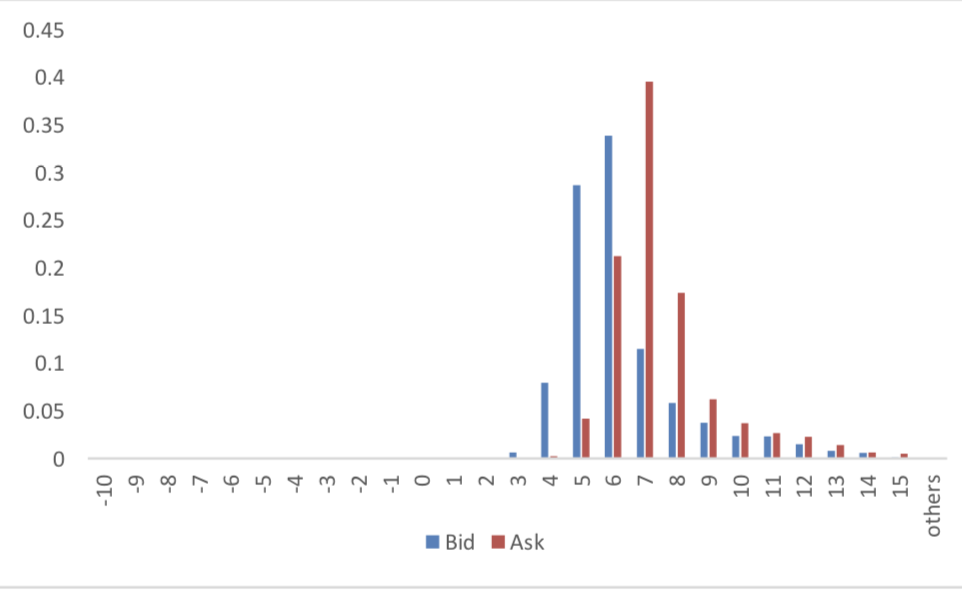
(2) Roll Level Bid-Ask Distribution
There are 5 trading days during last week, so the distribution is worked out with 36005 data points for each contract pair.
Graph 18: CSI300 Current/Next Month Contract Roll Spread Distribution (2s frequency)
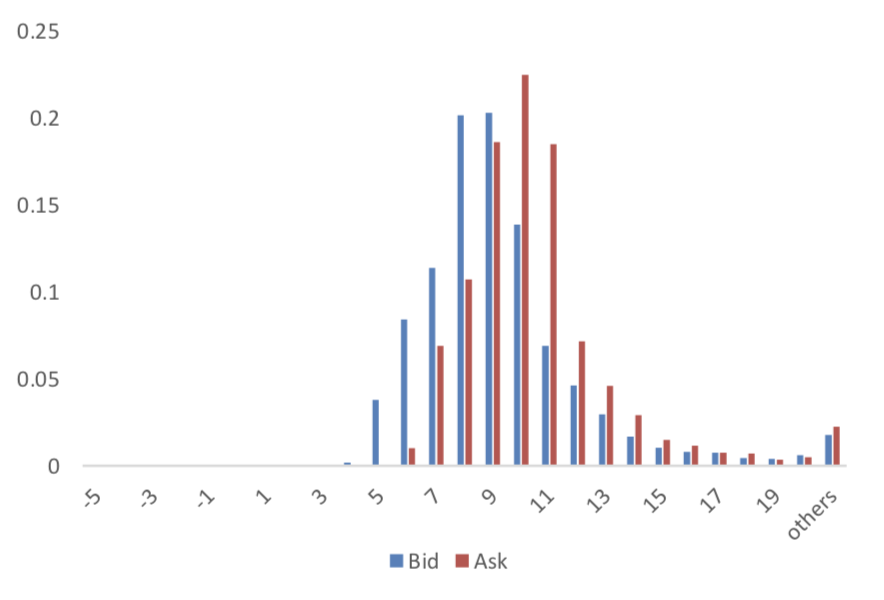
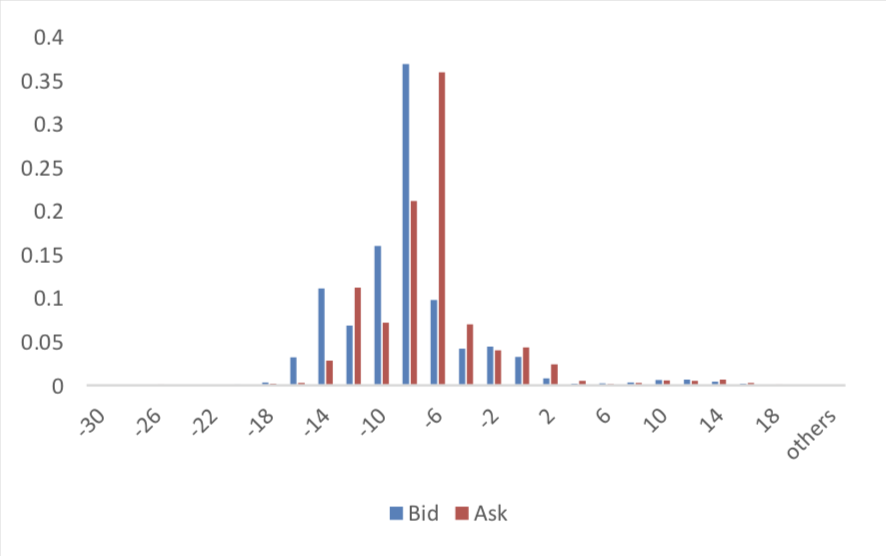
Graph 19: SSE50 Current/Next Month Contract Roll Spread Distribution (2s frequency)
Graph 20: CSI500 Current/Next Month Contract Roll Spread Distribution (2s frequency)
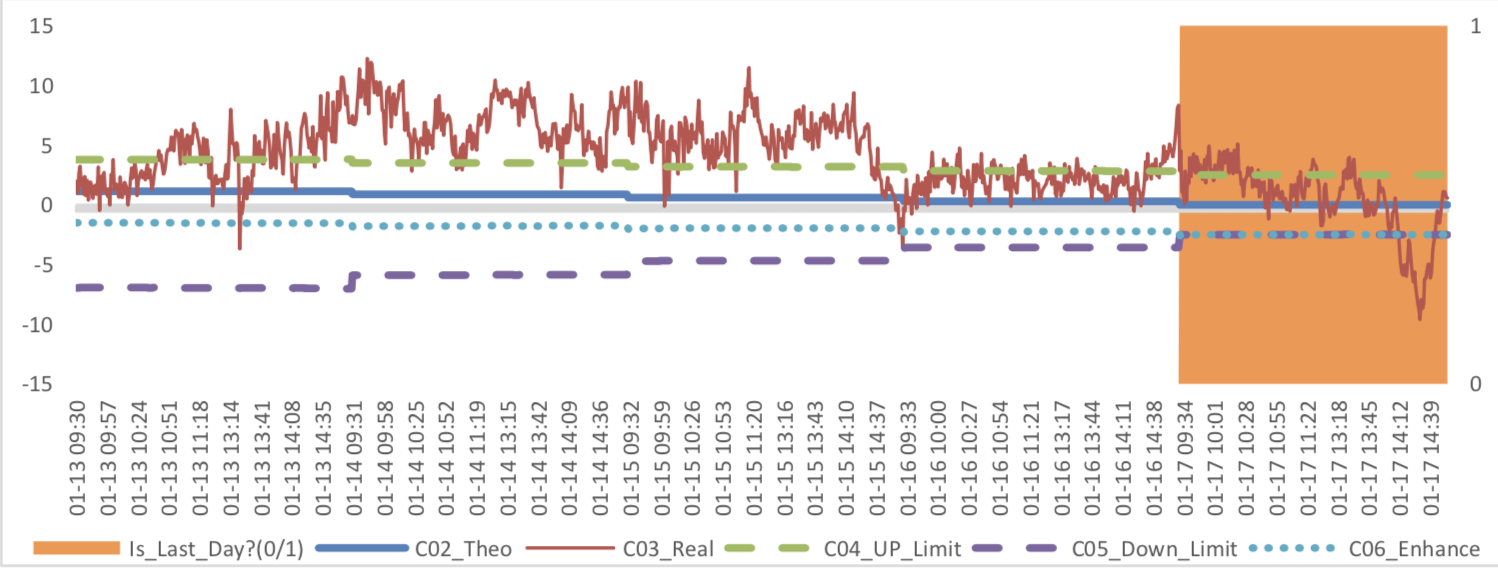
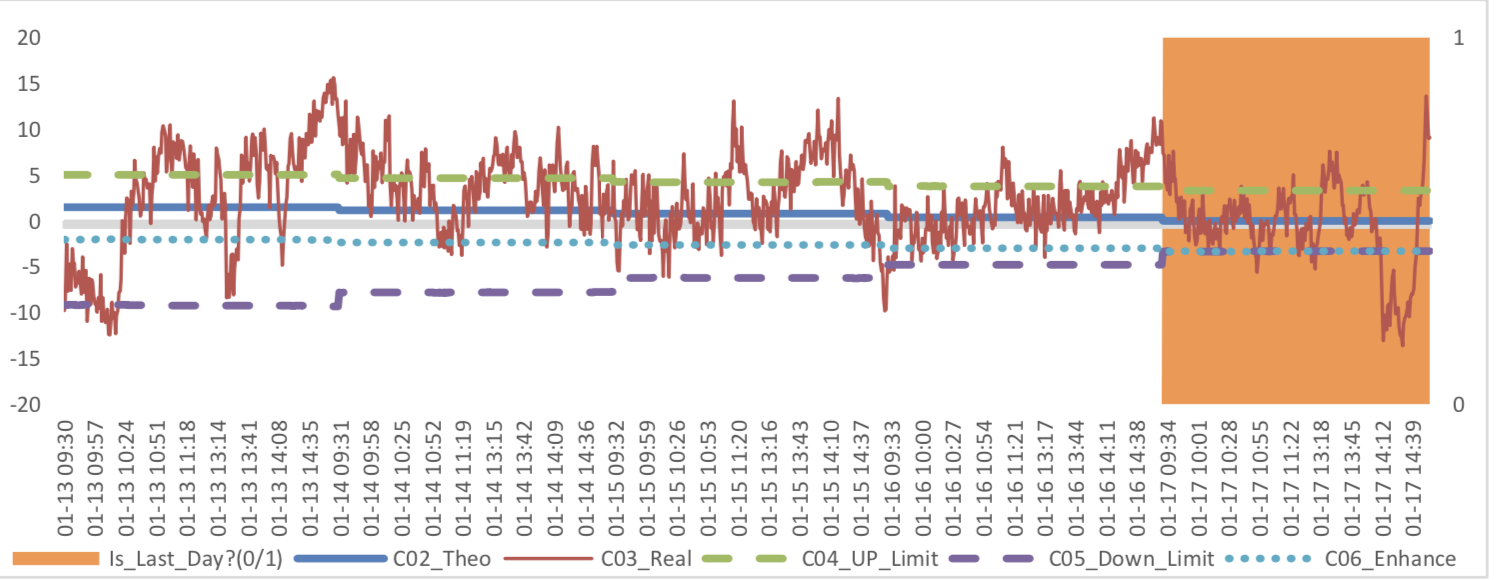
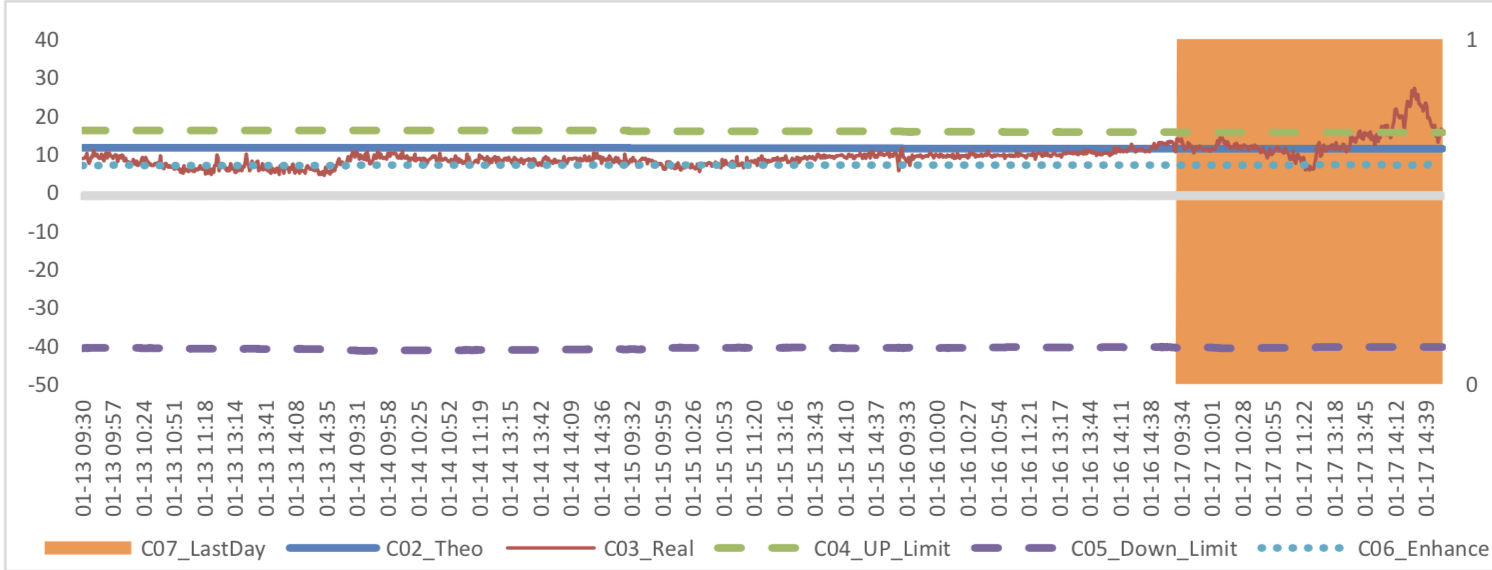
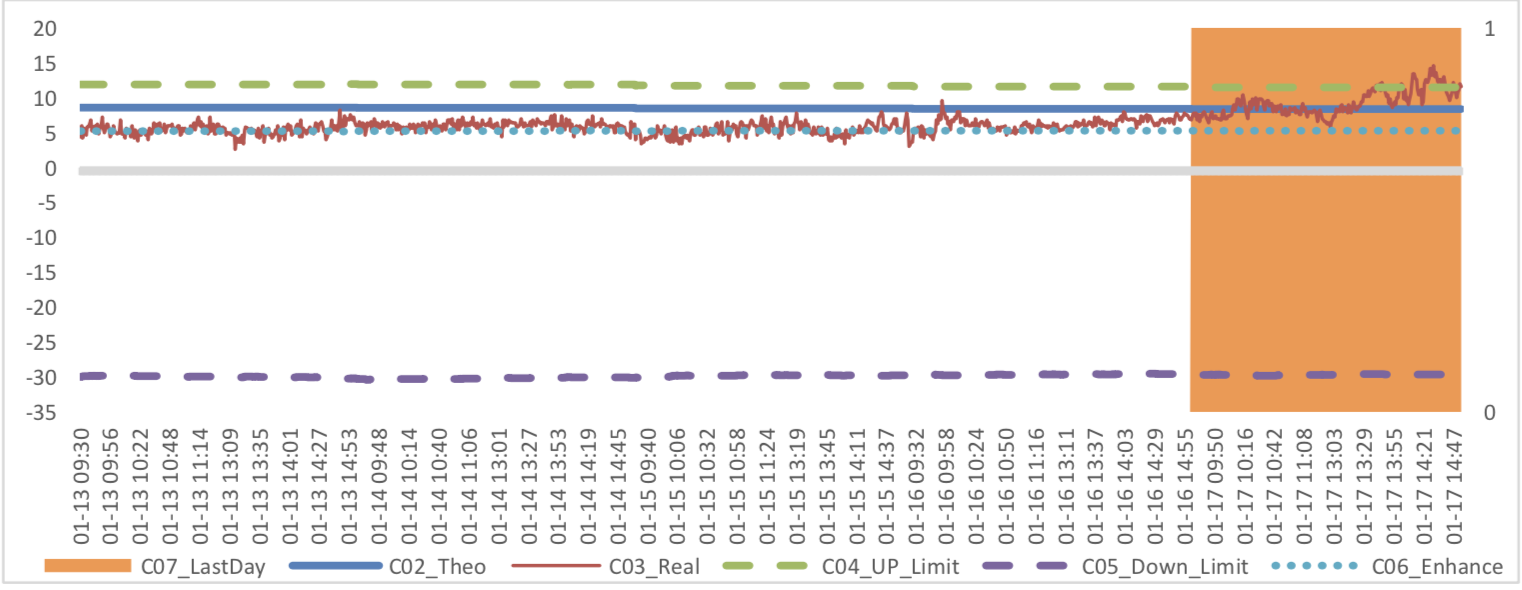
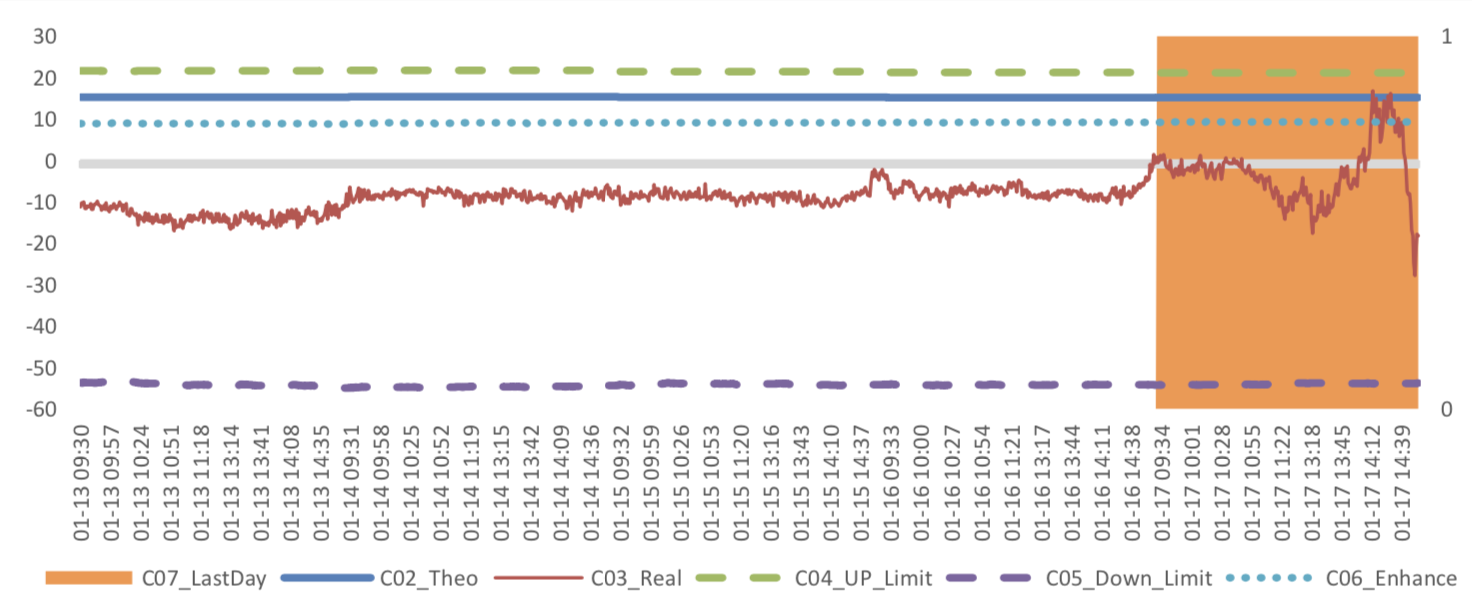
(3) Weekly Review of Future/Spot Arbitrage Opportunity
Assumption: risk-free rate: 3%; security borrowing cost: 8%; trading expense for spot: 0.025%; trading expense for futures: 0.005%; margin rates for futures contracts: 0.11 for CSI300 and SSE50, 0.13 for CSI500; margin rate for security borrowing: 0.3 (or 130% maintain rate).
When real price spread is out of theoretical range (calculated by our assumption), there exists absolute future-spot arbitrage opportunity.
Graph 21: Future (Current Month)-Spot Arbitrage Opportunity for CSI300 contract (in the view of price difference)
Graph 22: Future (Current Month)-Spot Arbitrage Opportunity for SSE50 contract (in the view of price difference)
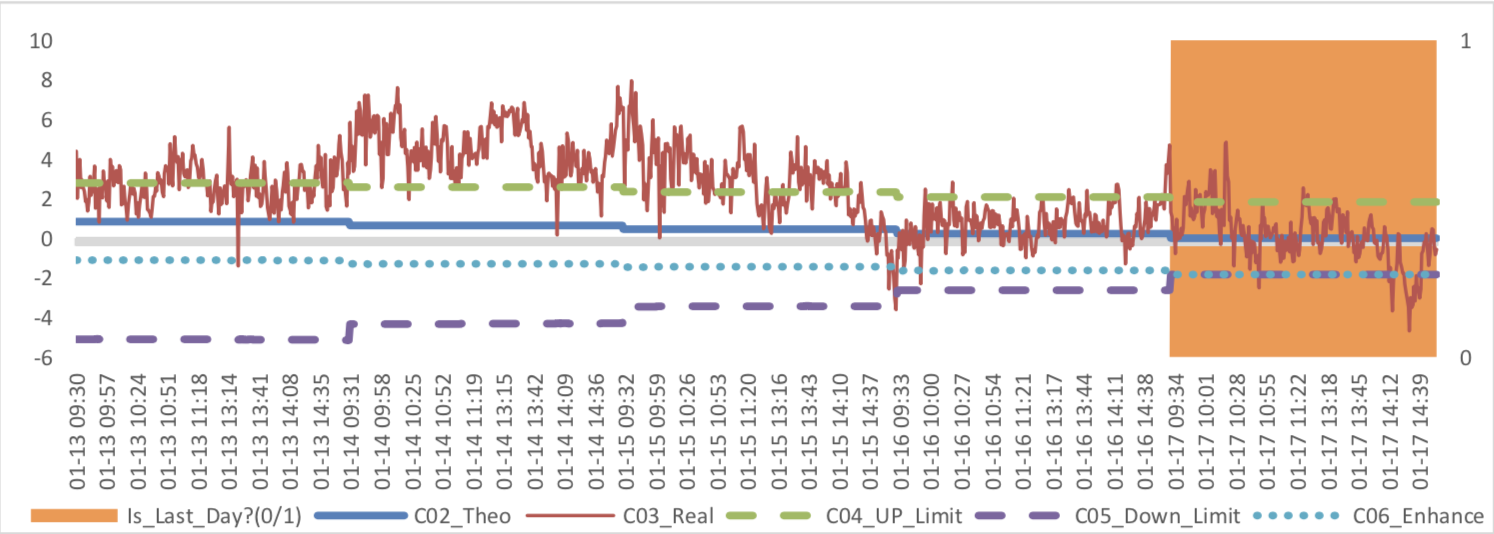
Graph 23: Future (Current Month)-Spot Arbitrage Opportunity for CSI500 contract (in the view of price difference)
Graph 24: Future (Next Month-Current Month) Arbitrage Opportunity for CSI300 contract (in the view of price difference)
Graph 25: Future (Next Month-Current Month) Arbitrage Opportunity for SSE50 contract (in the view of price difference)
Graph 26: Future (Next Month-Current Month) Arbitrage Opportunity for CSI500 contract (in the view of price
difference)
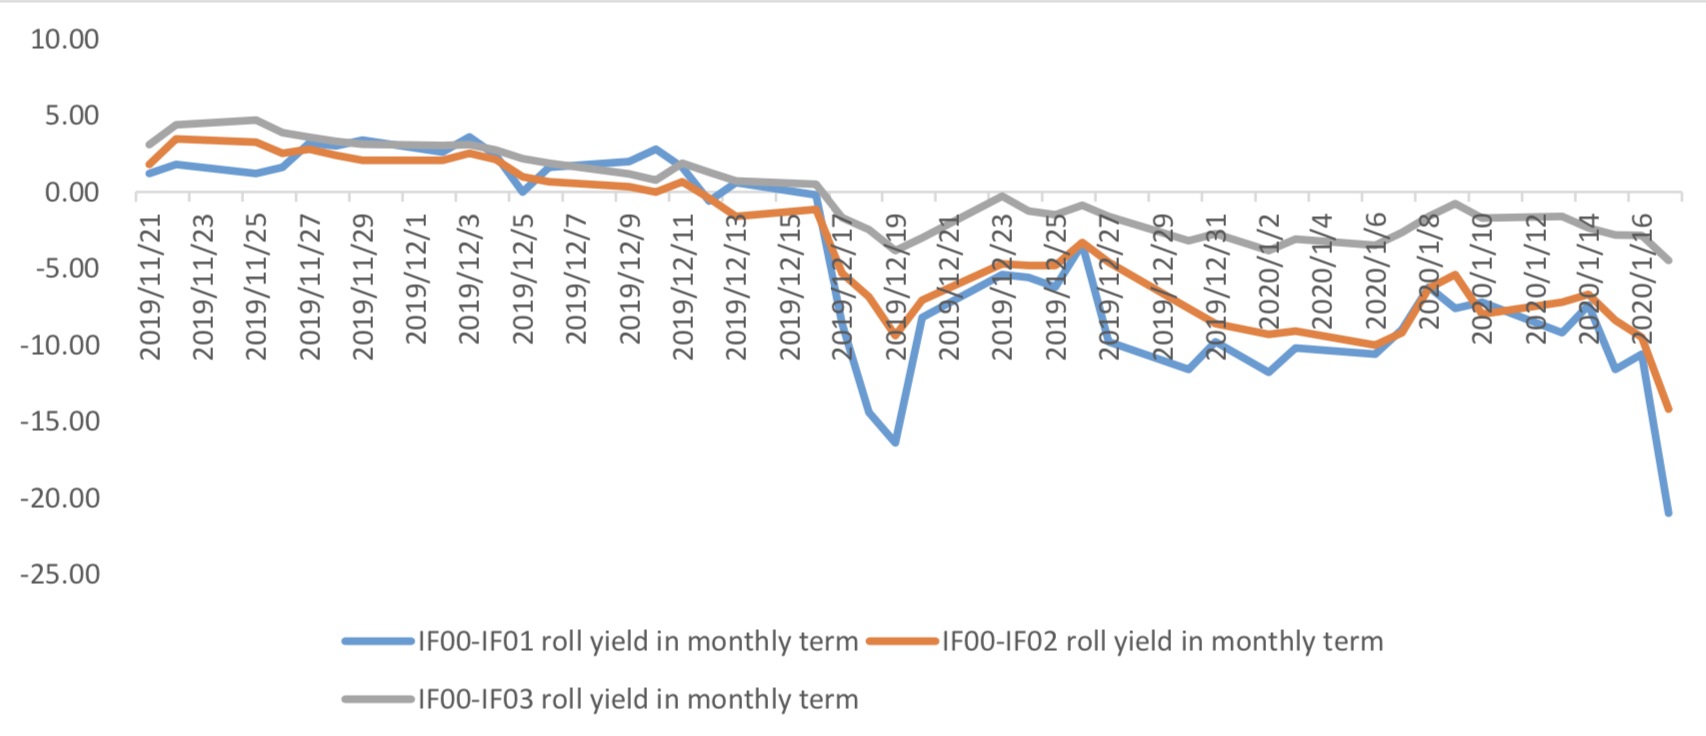
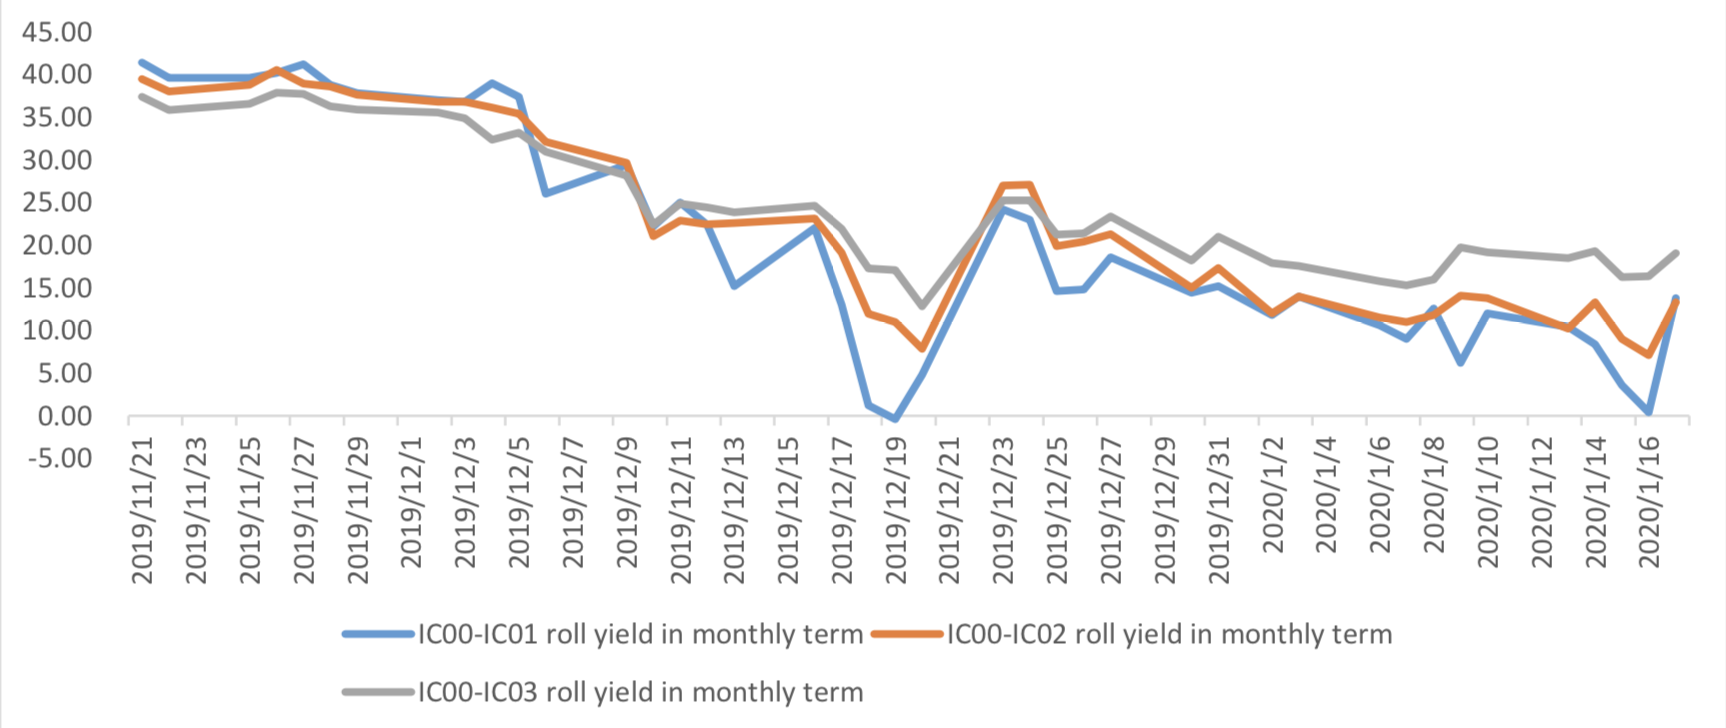
(4) Roll Spread of Stock Index Futures Tracking
Calculated as the contract price of the current month minus the contract price of the following month, for the long roll, the positive calculation results are gains, the negative calculation results are losses. Code 00 in the figure represents the current month contract, 01 the next month contract, 02 the current quarter contract, 03 the next quarter contract.
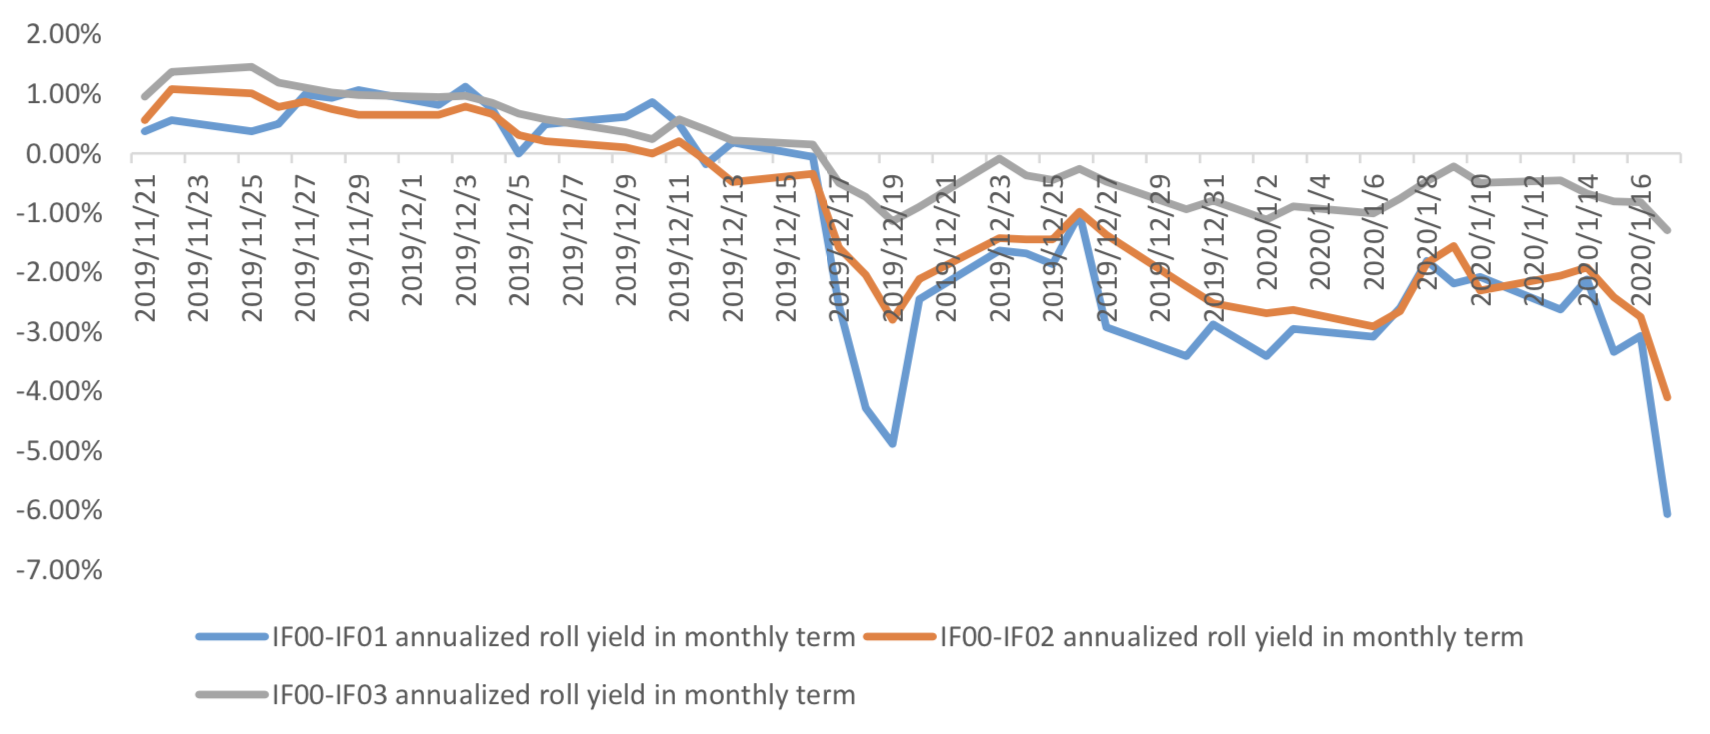
(a)IF
Up to2020/1/17,the best roll plan is IF00-IF03,annualized roll yield in monthly term is-1.29%。
Graph 27: IF Current month contract roll yield comparison (index point)
Graph 28: IF Current month contract roll yield comparison (annualized return)
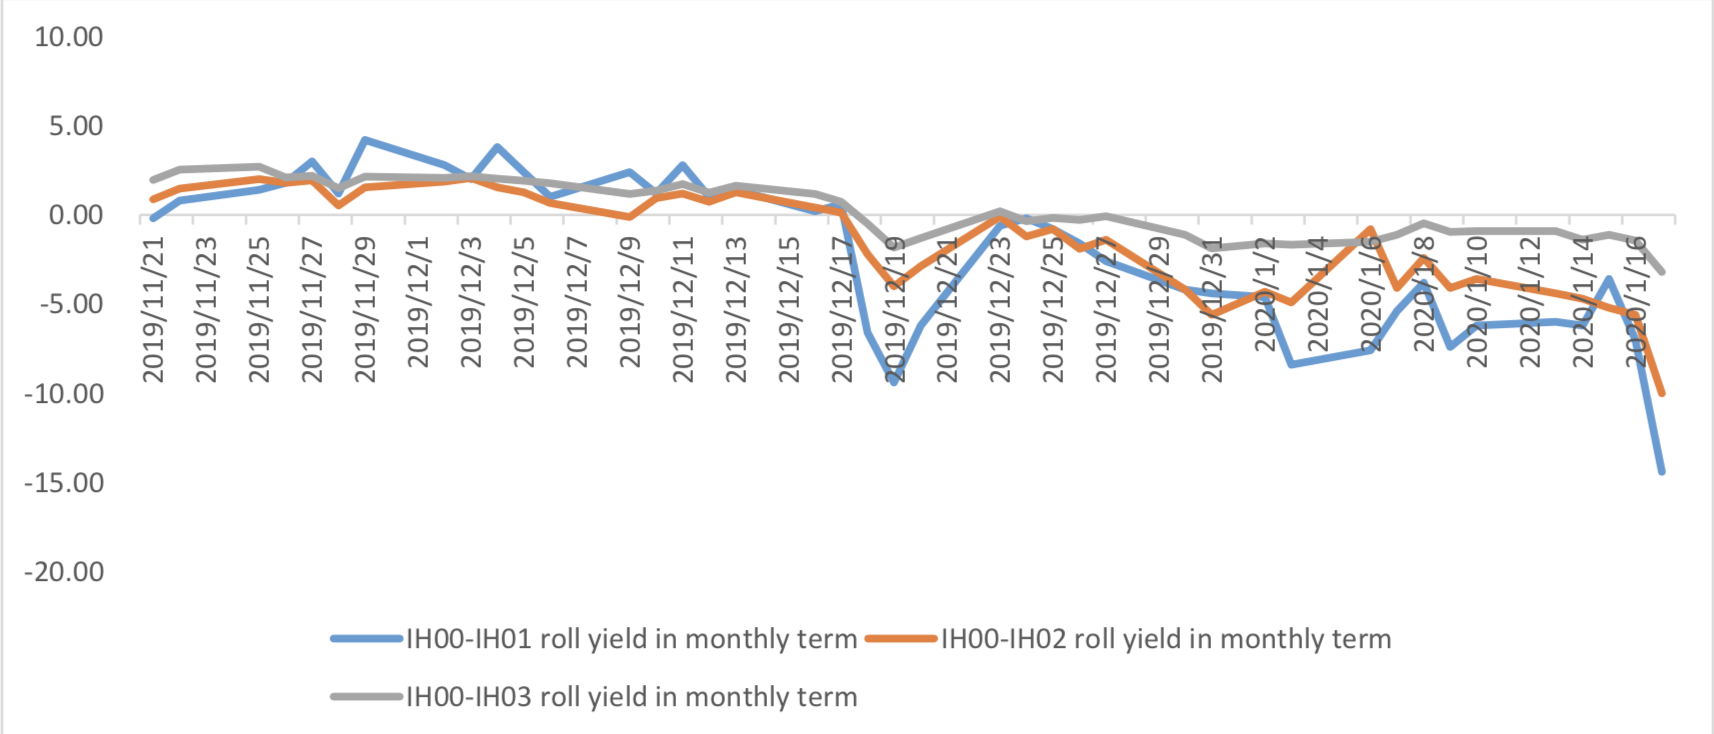
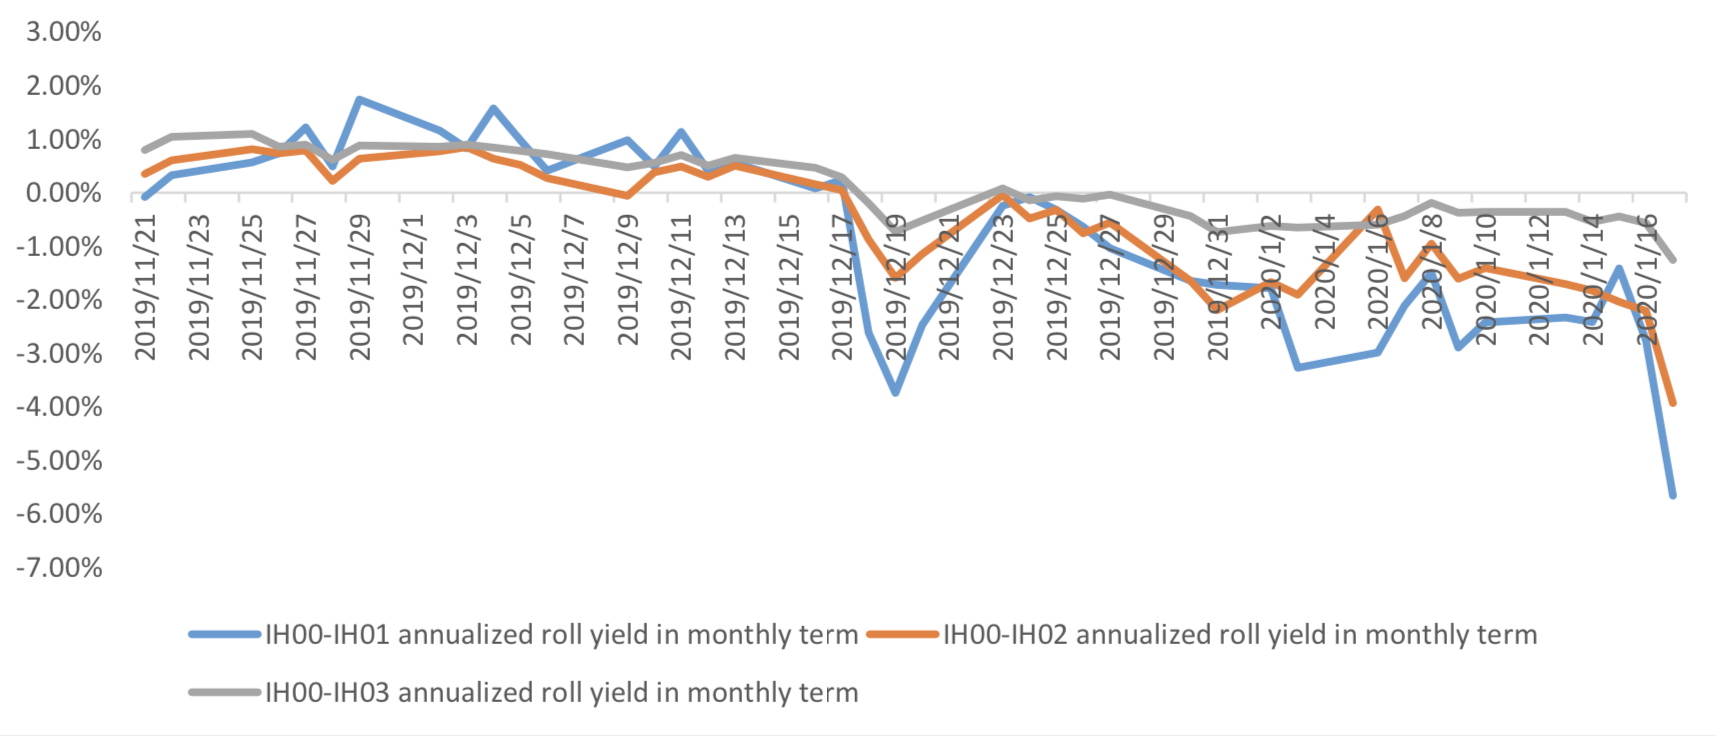
(b)IH
Up to 2020/1/17,the best roll plan is IH00-IH03,annualized roll yield in monthly term is-1.26%。
Graph 29: IH Current month contract roll yield comparison (index point)
Graph 30: IH Current month contract roll yield comparison (annualized return)
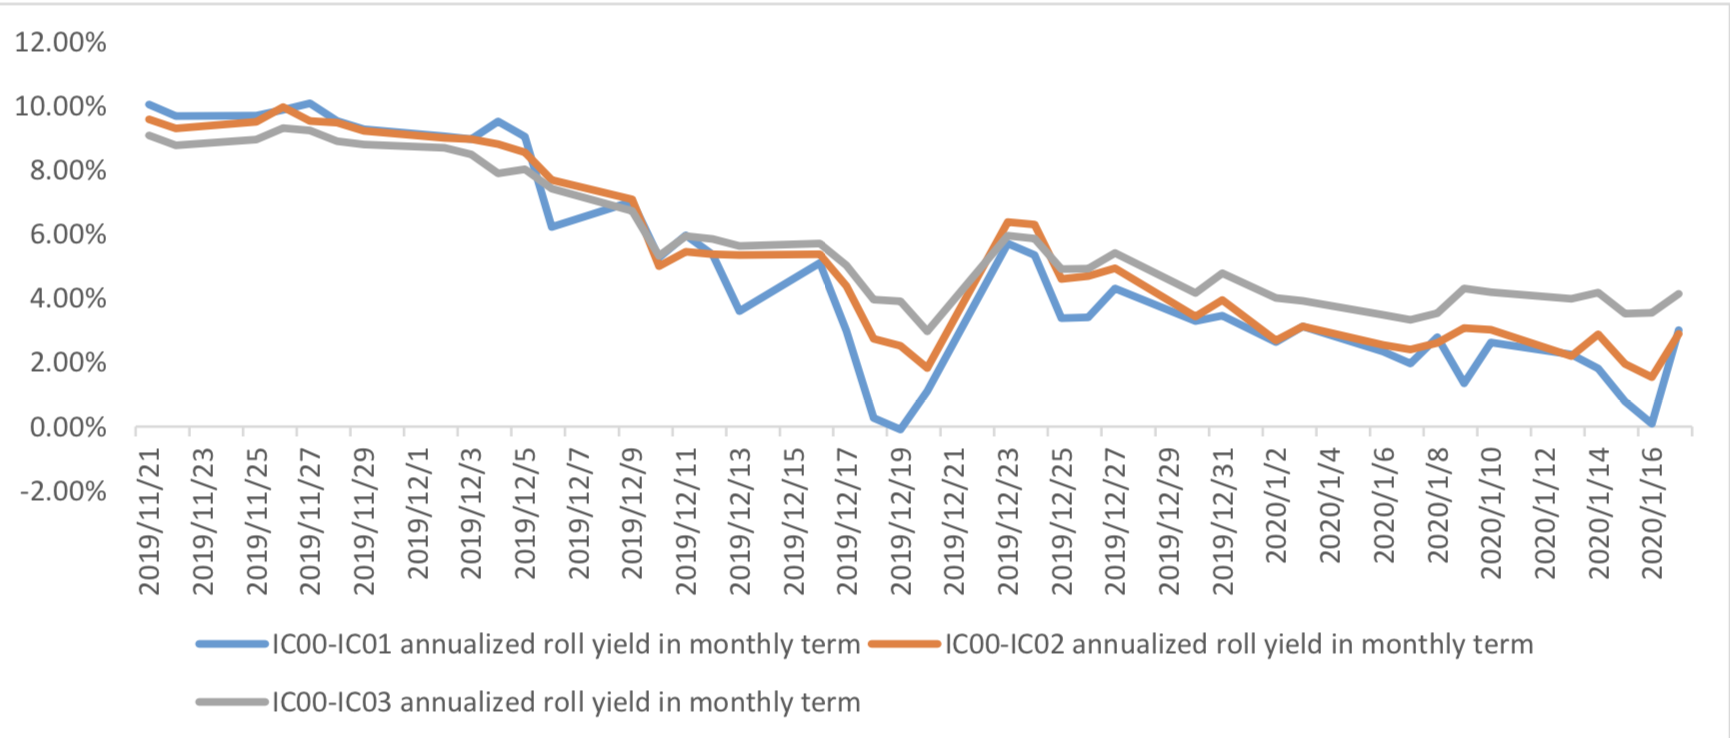
(c)IC
Up to2020/1/17,the best roll plan isIC00-IC03,annualized roll yield in monthly term is4.15%。
Graph 31: IC Current month contract roll yield comparison (index point)
Graph 32: IC Current month contract roll yield comparison (annualized return)
(5) Basis Tracking of Stock Index Futures
For long side, if the base difference is positive, the change of the base difference brings losses, and if the base difference is negative, the change of the base difference brings profits.
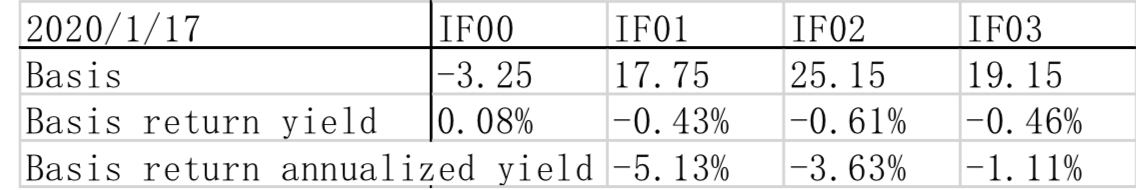
(a)IF
For long side hedge, up to 2020/1/17, IF00 was in discount, other IF contracts were in premium. Here IF next month contract basis return annualized yield is -5.13%。
Graph 33: IF contracts basis
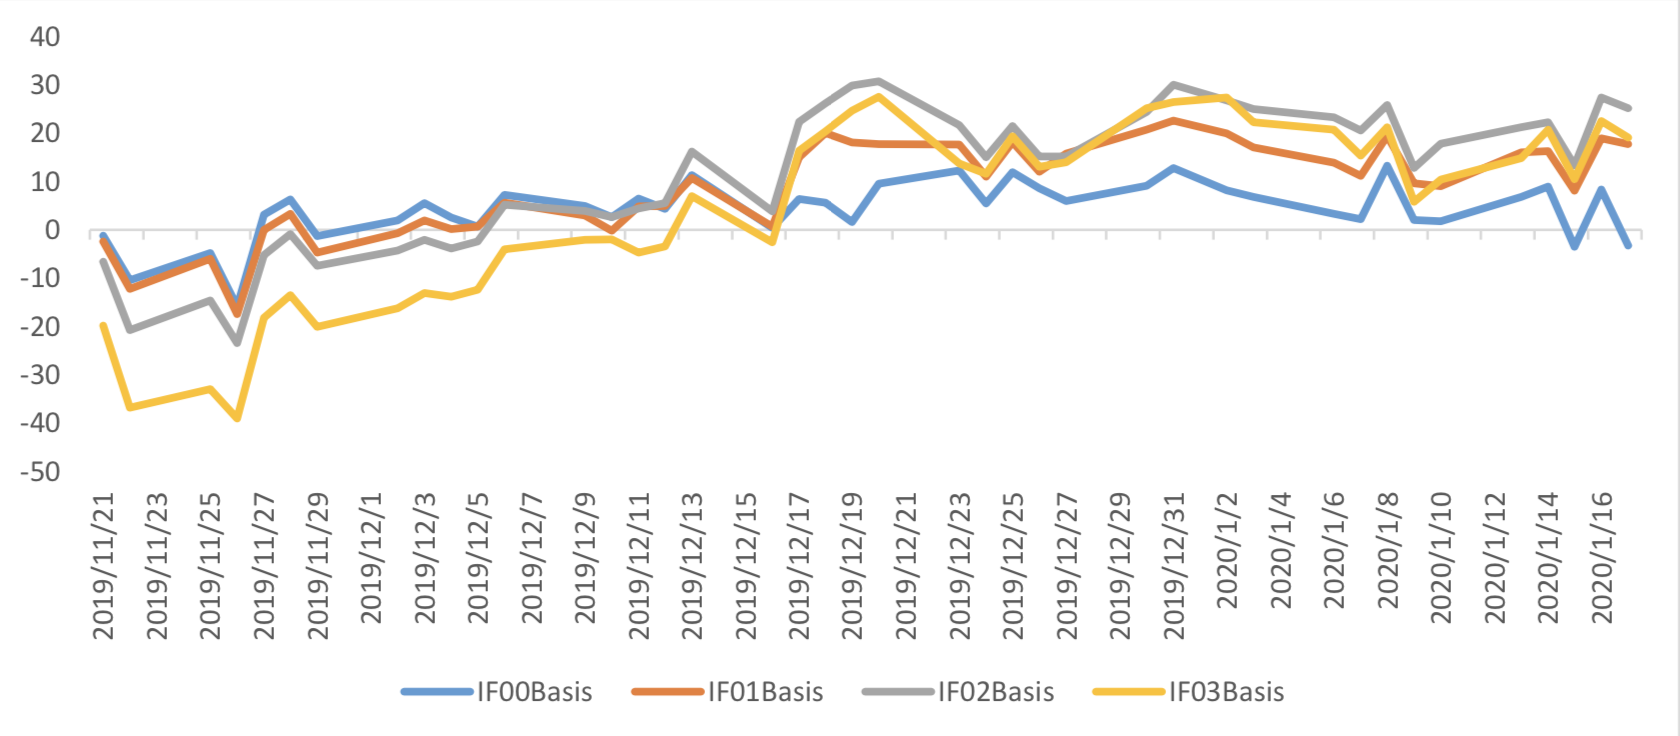
Table 1: IF basis return calculation
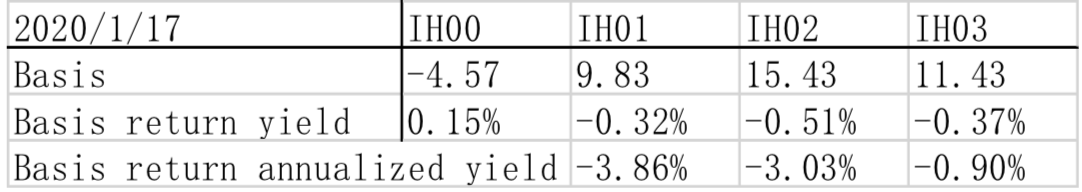
(b)IH
For long side hedge, up to 2020/1/17,IH00 was in discount, other IH contracts were in premium. Here
IH next month contract basis return annualized yield is -3.86%。
Graph 34: IH contracts basis
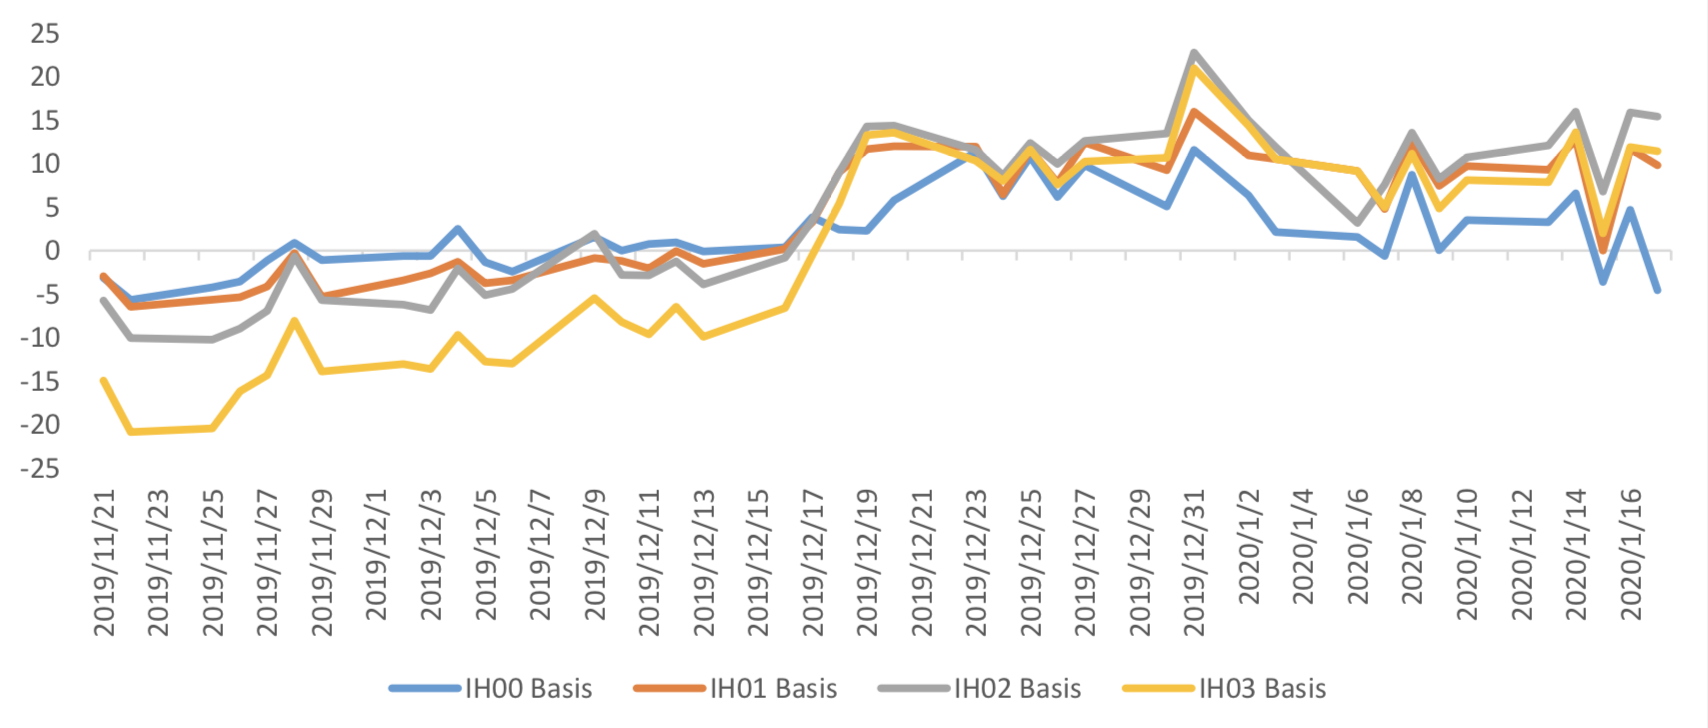
Table 2: IH basis return calculation
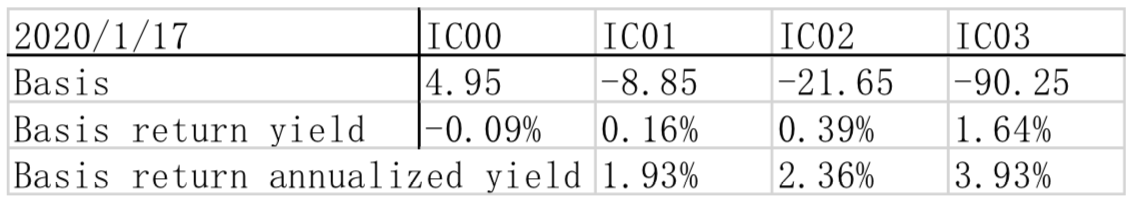
(c)IC
For long side hedge, up to 2020/1/17, IC00 was in premium, other IC contracts were in discount. Here
IC next month contract basis return annualized yield is 1.93%。
Graph 35: IC contracts basis
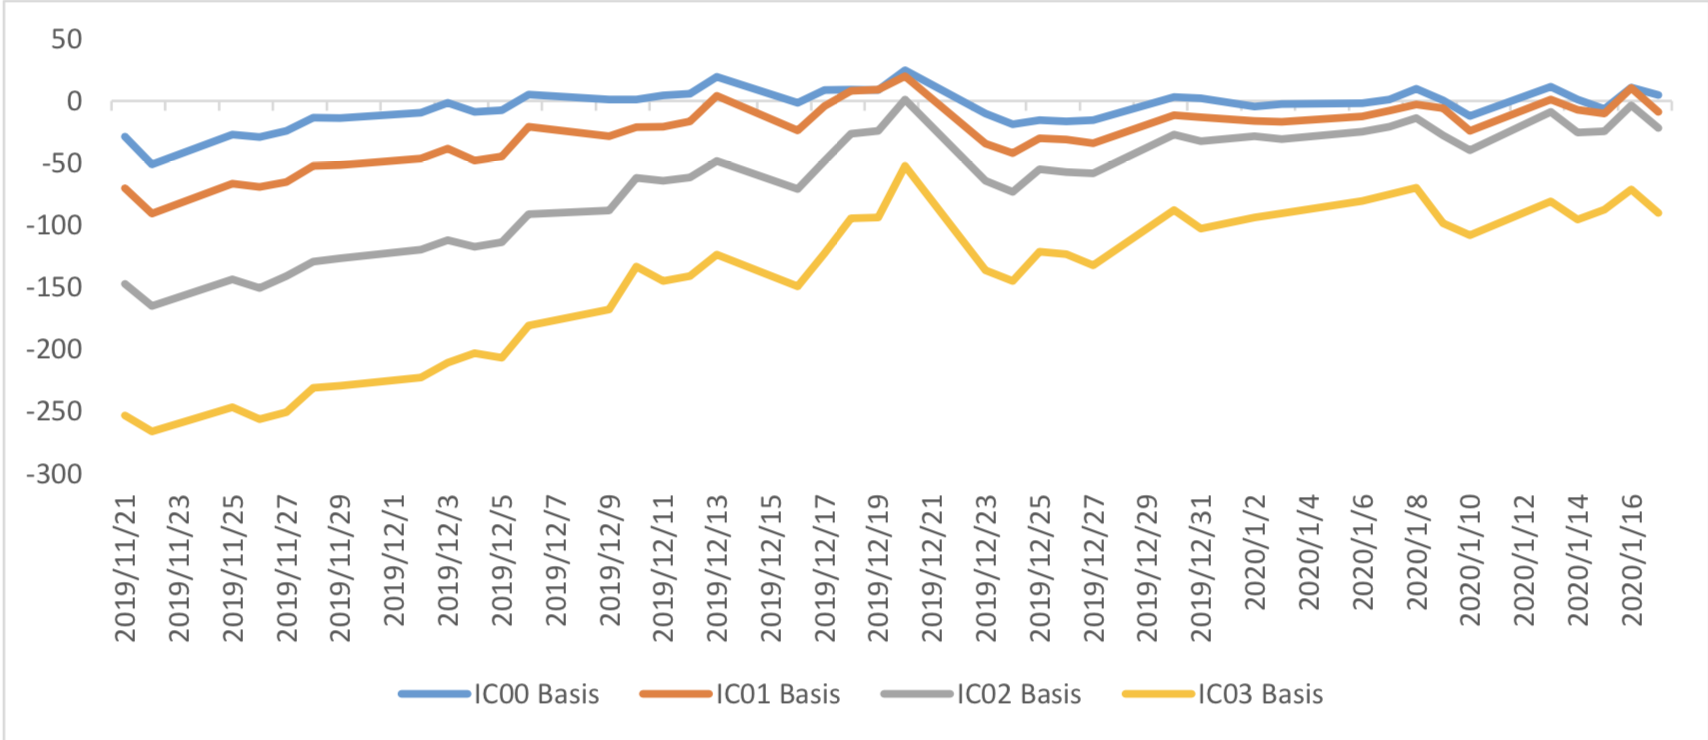
Table 3: IC basis return calculation
3. Financial Markets
(1) Interest Rates
The term structure of treasury bonds’ yields is currently upward sloping in concave shape.
Specifically, last week, short-term yields short term yield of Treasury bond experienced some fluctuation and 3M yield now at 2.0%-2.2% level. Furthermore, as for long-term yield, there is a small drop. 10Y yield is about 3.0%-3.2%.
Graph 36: Term Structure Evolvement of Treasury Bonds Yields During Recent 3 Months (%)

As for Shibor rates, short-term rates experienced significant fluctuation. Specifically, O/N rate experienced obvious fluctuation to 1.0%-1.2% level.
Graph 37: Term Structure Evolvement of Shibor Rates During Recent 3 Months (%)

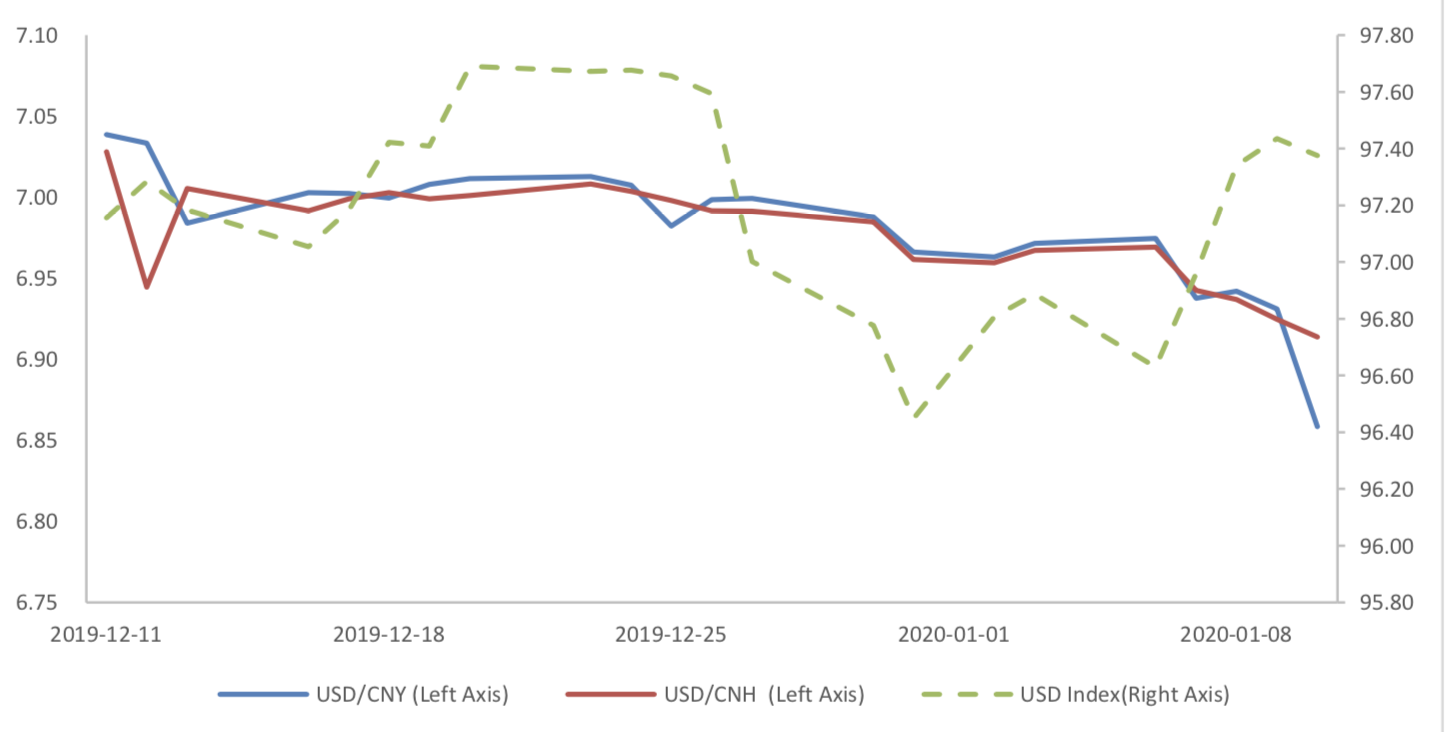
(2) ExchangeRates
During last week, CNY/USD changed -1.622% to 6.8585 and offshore rate, CNH/USD, changed - 0.77% to 6.9138 and USD index changed 0.50%.
Graph 38: USD/CNY, USD/CNH and USD Index
Currently no Comments.
Hot Topics
The 13rd China International Future Forum
The Shanghai Derivatives Energy Forum has received extensive attention from relevant industries both within and outside the borders.
Financial institutions deep explore commodity market opportunities, commodity index financial products show full-scale trend
R-Code for analysis: getKDJ
R-Code@June 06, 2016
New indicator to analyze the arbitrage opportunities between sse50 and csi500
Market review: January 11, 2017
The Great China Bubble: Anniversary Lessons and Outlook
Quant Investment in China A-share market
The hedge strategy between SSE50 and A50--Jan 13,2017
The arbitraging strategy between CSI300 and SSE50
Market review: June 17, 2016
Sleepless in London--Enda Homan(Allied Irish Banks Plc)
MSCI Rebuffs Chinese Equities for Third Time in Blow to Xi
Soros, Druckenmiller among hedgies profiting in market plunge