FangQuant › Option
Why is there some small difference in delta of options before and after dividend adjustment?
Today is the ex-dividend day of 50ETF, and the number of 50ETF options contracts has increased significantly today. Due to the dividend in the original contract, the exercise price and the number of 50ETF shares corresponding to the contract have changed to some extent, and the contract names have been suffixed with "A". At the same time, the standard contracts are newly listed in accordance with the principle of "equal value + four levels up and down".
The formula for calculating the exercise price and the corresponding number of the old option contract has been explained in detail in many famous writers at weekend, such as the option studio of Yu Li’s teacher, the little horse’s vernacular option, and so on. Several key formulas and points for attention are not repeated. Those who are interested can take a look at the recent public articles of the two teachers. From the perspective of transaction practicality, due to the nonstandard exercise price and the number of corresponding targets, the liquidity of the old contracts will gradually weaken in the subsequent transactions compared with the newly listed standard contracts, and those with conditions should wait for the opportunity to gradually change positions to the new contracts. If the turnover rate is a strategy with low turnover, the necessity is not necessarily high (After all, handling fees and sliding points must be paid for every move).In addition, it is worth focusing on and summarizing that there will be small differences in delta of option contracts before and after dividend adjustment. Although it seems that most investors don’t feel or have little impact, they should understand it out of reason. See the following example for specific differences.

In the table, I take part of the contracts in December for comparison before and after dividend, and see the specific parameters in the header position (the price of the underlying of the right of resumption is only for the dividend this time, and other parameters remain unchanged by default). There are several key points in the data: A. all option contracts have small differences in delta before and after dividend, and the percentage of the difference in delta before and after dividend is basically within 1%; B. most call options have absolute delta value after dividend is larger than before dividend, most put options are opposite. It looks like a small deviation, but what if you had 1000 sold 3.1 call last Friday? Why there is delta deviation between dividend and non-dividend? From the BS formula, we can understand that from another point of view, we can observe the last two columns of data in the table: the delta change of dividend or non-dividend of call option is negatively correlated with the percentage change of exercise price / spot price, and the put option is positively correlated. The simple understanding is that the dividend ex right causes the new exercise price based on the price of new and old subject matter to be lower than the non-dividend exercise price, and the subscription is more expensive and the put is cheaper, on the contrary, the subscription is cheaper and the put is more expensive.
Back to the market, the official manufacturing PMI stood on 50 for the first time in a few months over the weekend to add a touch of light to the short-term gloomy economic data. A shares rose with the trend. In the afternoon, they were affected by the weakness of Ping An and other core white horse stocks, which dropped a lot. The SSE50 index’s growth narrowed to 0.16%.The implied volatility of ETF options is stable in the current month, and 12.5% of flat options close in December, including 12.5% of call options and 12.5% of put options. The options market still doesn’t show excessive concern about the decline. In short-term trading execution, under the background of obvious negative trend and negative trend of today’s hidden wave and trend, continue to stick to the principle of selling by buying. If you don’t understand, you can wait for a while, those who have a sense of direction in low wave, please feel free to buy the direction of virtual value gambling, and prepare for investment or loss. Well, I hope the next trading day goes well!
------------------------------------------------------The following is the time-sharing chart of the subject matter and the data part of option volatility trading (it’s boring, can be skipped if no interest):
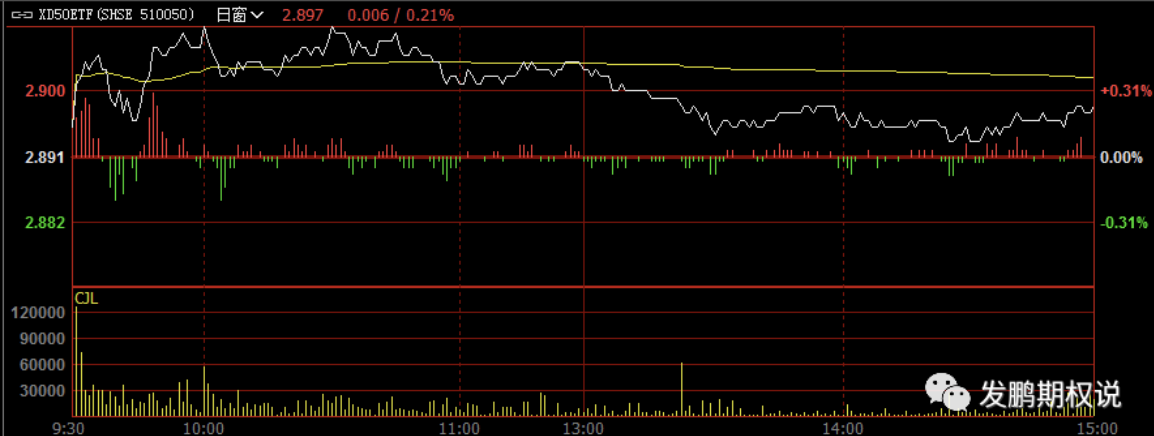
50ETF time chart
50ETF options IV trend chart of current month’s ATM

options
The implied volatility of 50ETF’s flat option in the current month (December) was 12.50% (the volatility of 0.5 delta in November on the previous trading day was 12.69%, and the volatility of ATM directly obtained in the post market article); the historical volatility of 50ETF 17 (the remaining trading day of options in December) was 11.41%, and the difference between the implied and actual volatility was about 1%.In terms of skew of volatility curve, C-skew fell in December compared with yesterday (the volatility of virtual call was lower than that of average call), closing in positive area; P-skew fell in December compared with yesterday (the volatility of virtual put was lower than that of average put), closing in positive area; the overall volatility curve in December was up, the volatility of shallow virtual call was down, and the volatility of shallow virtual put was relative in day. In December, the lowest volatility gear of call / put curve was 3.0, and the implied volatility of the three virtual value gears with the same level up and down showed a neutral smile pattern of virtual sell end and virtual subscription equal up and up. In December, the price difference of call put volatility was lower than that of yesterday, and the volatility of daily call put volatility was higher than that of last trading day. The composite premium of call put volatility in that month was about 0.0045 yuan / share. The model free skew index is 100.87 (last day’s index is revised to 100.83), basically neutral; in December, the model free skew index is 101.7, close to neutral, and the actual average value is equal to three levels, which belongs to neutral pattern.
Data Description: a. the average value hidden wave is taken daily according to the average value (call hidden wave + put hidden wave) / 2; B. the modeless skew is calculated according to the formula of CBOE, and the actual application is often distorted due to the problem of 50ETF gear, so it needs to be combined with C-skew and P-skew (delta absolute value is 0.25 gear hidden wave - average hidden wave). The former means that the virtual purchase part is slightly more expensive than the normal purchase part, and the latter means that the virtual sell part C. the adjustment of C-P hidden wave, i.e. the adjustment of call hidden wave put hidden wave, means that call is relatively more expensive (generally corresponding to the synthetic rising water), and vice versa.
Call / put IV curve and premium / discount curve of 50ETF options

50ETF options main skew curve

50ETF option December option T-type quotation

分红调整前后期权Delta缘何会有小差异?
今天是50ETF一年一度的分红除权日,50ETF期权合约数量今日大幅增加,原合约因为分红导致行权价与合约对应50ETF股数出现一定变化,合约名字纷纷带上“A”后缀,同时标准合约按照平值+上下各4档的原则新挂上市。
从于交易的务实性,老合约因为行权价与对应标的数量的不标准,在后续的交易中流动性会逐步趋弱于新上市标准合约,有条件者当伺机逐步换仓至新合约,如果是换手率本来就低的策略,必要性不一定很高(毕竟动一动就得交手续费和滑点)。
除外值得重点关注和总结的,就是期权合约在分红调整前后的Delta会有小差异,虽然对绝多数投资者来说,似乎没有感觉到,或者说影响也不大,但出于理性也当了解,具体差异见下表示例。
表中,我取了12月的部分合约做前后对比,具体参数见表头部位(复权标的价格仅复权本次分红,其他参数默认不变),数据存在几个要点:
a.所有的期权合约,分红前后的Delta均有小差异,差异占不分红Delta的百分比基本在1%以内;
b.多数认购期权,分红后Delta绝对值比分红前大,多数认沽期权相反。
看起来偏差很小,但设想如果你上周五持有的是1000张卖出3.1Call呢?
为何会出现分红与不分红的Delta偏差?从BS公式入手固然可以理解,换个角度,可以观测表中后两列数据:认购期权的分红or不分红Delta变化与行权价/现货价百分比变化成负相关,认沽期权则呈正相关。简单的理解即是,分红除权造成以新老标的价格为基准的新行权价相较于不分红行权价更低,认购更贵认沽更便宜,反之则是认购更便宜认沽更贵。
说回行情,周末官方制造业PMI的数月内首次站上50为短期偏灰暗的经济数据添一抹亮色,A股顺势高开走高,午后再度受累于平安等核心白马股的走弱回落不少,上证50指数涨幅收窄至0.16%。
50ETF期权当月隐含波动率持稳,12月平值期权隐波收12.5%,其中认购期权12.5%-、认沽期权12.5%+,期权市场依然未有表现出对下跌过分担忧的意思,短期交易执行上,在明显趋势负面与今日隐波与走势负向关背景下,继续持慎卖偏买原则吧,看不懂则可以暂时观望一下,低波下有方向感者,买虚值赌方向请随意,做好投入即亏损的打算就好。
好了,希望下个交易日顺利!
------------------------------------------------------
以下是标的分时图与期权波动率交易数据部分(比较枯燥,无兴趣可以略过):
50ETF分时图
50ETF当月(12月)平值期权隐含波动率收至12.50%(上交易日11月0.5Delta波动率为12.69%,盘后文章直接取的ATM波动率);50ETF17日(12月期权剩余交易日)历史波动率11.41%,隐含与实际波动率差价约1%。
波动率曲线偏斜(Skew)方面,12月CSkew较昨日下跌(虚值Call相对平值Call波动率下跌),收盘正值区域;12月PSkew较昨日下行(虚值Put相对平值Put波动率下行),收在正值区域;12月波动率整体曲线总体上行,浅虚值认购端波动率相对位置下跌,浅虚值认沽端日内相对位置下行;12月Call/Put曲线最低波动率档位3.0,平值上下对等3个虚值档位隐含波动率呈现虚值认沽端、虚值认购对等上翘的中性微笑格局。
12月平值Call-Put波动率差价较昨日下跌,日内平值认沽波动率相对认购波动率较上交易日上行,当月平值期权合成升水约0.0045元/股。无模型Skew指数100.87(上日指数修正为100.83),基本中性;12月无模型Skew指数101.7,接近中性,实际平值对等3档属中性格局。
数据说明:
a.平值隐波每日按照平值(Call隐波+Put隐波)/2取值;
b.无模型Skew按照CBOE的公式计算,实际运用因50ETF档位的问题时常有失真,所以需结合CSkew与PSkew(Delta绝对值为0.25档位隐波-平值隐波)看,前者正意味着虚购部位较平值购稍贵,后者正意味着虚沽部位较平值沽稍贵;
c.平值C-P隐波差即平值Call隐波-Put隐波,正意味着Call相对更贵(一般会对应合成升水),反之则反过来。
50ETF期权跨月Call/Put IV曲线及升贴水曲线图
50ETF期权12月期权T型报价
Currently no Comments.
Hot Topics
The 13rd China International Future Forum
The Shanghai Derivatives Energy Forum has received extensive attention from relevant industries both within and outside the borders.
Financial institutions deep explore commodity market opportunities, commodity index financial products show full-scale trend
R-Code for analysis: getKDJ
New indicator to analyze the arbitrage opportunities between sse50 and csi500
R-Code@June 06, 2016
Market review: January 11, 2017
The Great China Bubble: Anniversary Lessons and Outlook
Quant Investment in China A-share market
The hedge strategy between SSE50 and A50--Jan 13,2017
The arbitraging strategy between CSI300 and SSE50
Market review: June 17, 2016
Sleepless in London--Enda Homan(Allied Irish Banks Plc)
MSCI Rebuffs Chinese Equities for Third Time in Blow to Xi
Soros, Druckenmiller among hedgies profiting in market plunge