FangQuant › Financial Futures
Market Summary:
Last week, there was generally increase over the market. Shanghai SE Composite Index (000001.SH) changed 0.28 % to 3092.29. Specifically, small cap shares perform better than large cap shares and we can observe that CSI500 did better than SSE50 (1.85% vs -0.34%). The average daily turnover of the whole market during past 5 trading days is 732.48 billion CNY, it increased 13.65% compared with the previous 5-trading day period.
Price data released. In December, prices leveled at a high level, mainly due to the fall of pig prices at a high level. However, considering the Spring Festival, the low base of pig prices in the same period last year, and the fluctuation of oil prices, it is difficult to change the situation of price recovery in a short time. However, the core CPI is flat at low level, and the price fluctuation is still disturbed by short-term factors and supply side factors in nature. The basis for the overall level of prices to remain stable should remain.
Foreign funds kept flowing in A-shares. During last week the total foreign fund flow via Stock Connect is 20.79 billion RMB, and the cumulative inflows was 1027.78 billion RMB, creating a new high.
As for arbitrage opportunity, all futures current-month contracts show some room for arbitrage opportunities. No price spread for next-month/current month contracts show room for arbitrage.
News:
(1) Xinhua News Agency: the World Bank recently released the January 2020 global economic outlook report that investment and trade recovered gradually from last year's severe weakness, but the downside risks still exist. It is expected that the overall growth rate of developed economies will decline to 1.4% in 2020, and that of emerging and developing economies will accelerate to 4.1% this year.
(2) Economic Daily: Pan Gongsheng, deputy governor of the people's Bank of China, said that we should continue to implement sound monetary policy to create a good monetary and financial environment for promoting high-quality economic development. We will comprehensively consider economic growth, inflation expectations, macroeconomic leverage and exchange rate stability, maintain flexibility and moderation, strengthen counter cyclical adjustment, dredge the policy transmission mechanism, improve the effectiveness of monetary policy, give full play to the guiding role of structural tools, increase support for key areas and weak links, especially small and micro enterprises, private enterprises and manufacturing industries, and serve high-quality economic development.
(3) In 2020, the National Conference on Banking and insurance industry supervision was held, which emphasized that we should firmly win the battle to prevent and resolve financial risks; we should properly handle high-risk institutions, consolidate the responsibilities of all parties, and do our best to coordinate, cooperate and guide policies; for financial groups built in violation of laws and regulations, we should seriously investigate and deal with violations of laws and regulations, and do our best to make assets under the premise of stabilizing the overall situation Clean up, recover the stolen goods for damage, reform and reorganization.
(4) Securities Times: the National Conference on medical security work was held in Beijing. The conference stressed that the following work will be done in 2020: vigorously promote the reform of centralized purchasing and use of drugs organized by the state, break the barriers of interests, and realize the normal operation, so as to promote the reform of "three medical linkage"; establish a dynamic adjustment mechanism of medical insurance drug catalog, and further promote the DRG pilot, Improve the medical insurance payment system.
(5) Netease: Ning Jizhe said that the goal of China's annual growth of 6% to 6.5% can be achieved. In terms of improving people's livelihood, in the first three quarters, the per capita disposable income of residents increased by 6.1% on a year-on-year basis, basically in line with the growth of GDP, and faster than the growth of per capita GDP. The ratio of per capita disposable income to per capita GDP is more reasonable.
(6) 21st century economic report: with the large-scale construction of 5g infrastructure in 2020, the competition among global communication equipment manufacturers is becoming more and more fierce, with Huawei, Ericsson and Nokia competing against each other. Next, the competition of 5g contract will continue. In the 5g era, the voice of Chinese enterprises has been further enhanced, and they have entered the key standard setting field. With the start of 5g in 2020, the competition of equipment manufacturers tends to be white hot.
1. StockMarket
(1) Indices Performance
During last week, Shanghai SE Composite Index (000001.SH) changed 0.28 % to 3092.29, Shenzhen Component Index (399001.SZ) changed 2.10 % to 10879.84, ChiNext Price Index (399006.SZ) changed 3.71 % to 1904.19, CSI 300 INDEX (000300.SH) changed 0.44 % to 4163.18, CSI SmallCap 500 index (000905.SH) changed 1.85 % to 5480.23, SSE 50 Index (000016.SH) changed -0.34 % to 3067.88.
Graph 1: Indices Performance over past 3 months

The average daily turnover of the whole market during past 5 trading days is 732.48 billion CNY, it increased 13.65% compared with the previous 5-trading day period.
Graph 2: Market turnover

In the view of sectors, during last week (from 2020-01-03 to 2020-01-10), 17 of 24 Wind Level- 2 sector(s) increased while 7 sector(s) dropped. Specifically, Software & Services(5.08%), Semiconductors & Semiconductor Equipment (4.71%) and Media (4.31%) did the best performance while Real Estate (-1.62%), Insurance (-1.42%) and Telecommunication Services (-1.11%) did the worst performance.
Graph 3: Sectors performance under Wind Level-2 classification (%)

(3) Indices Valuation (TTM)
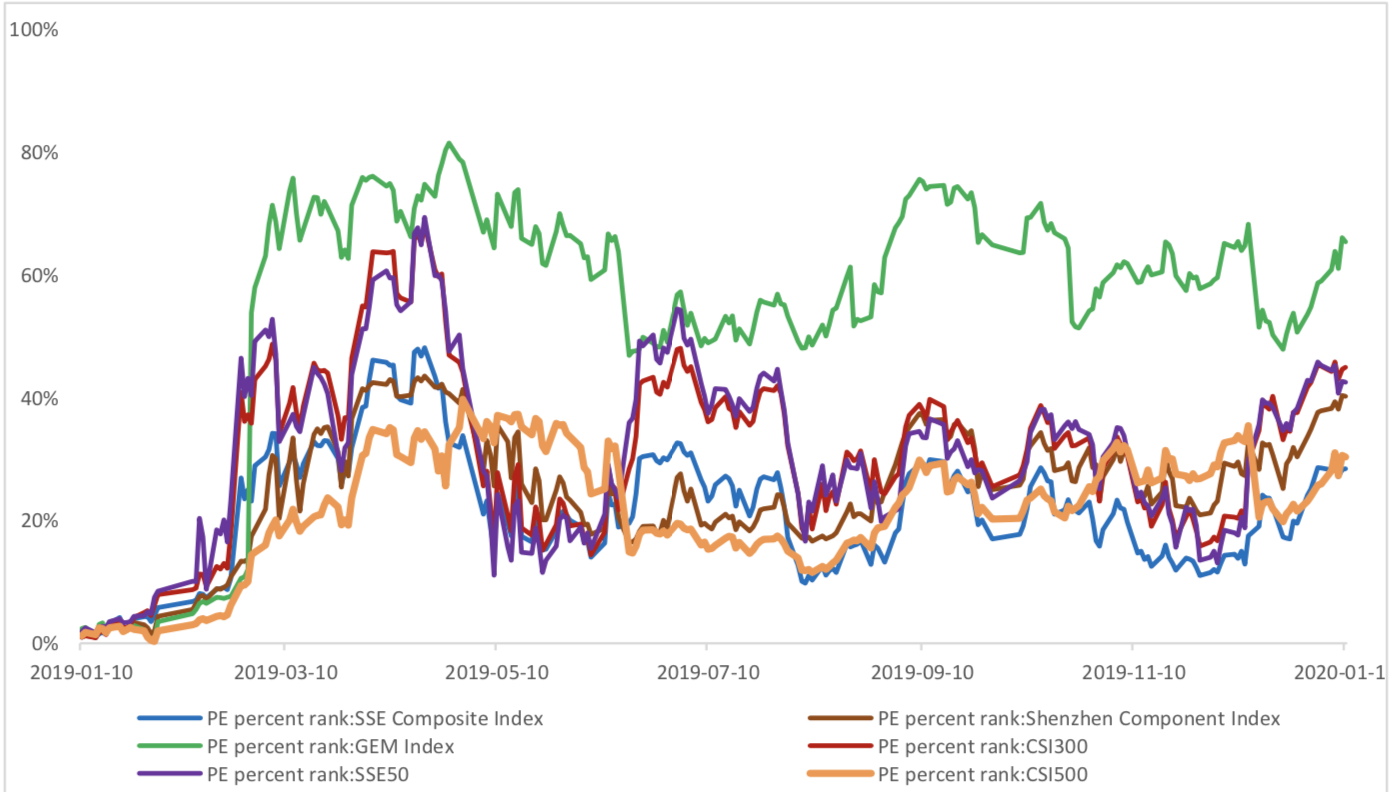
The current PE for SSE Composite Index, Shenzhen Component Index, GEM Index, CSI300, SSE50, CSI500 are 13.2702, 25.4187, 52.9258, 12.6175, 9.9871, 25.9170respectively; and these indices are at 28.40%, 40.20%, 65.30%, 44.90%, 42.50%, 30.30% percent rank level of their historic data, respectively
Graph 4: PE of 6 indices

Graph 5: PE percent rank of 6 indices (calculated by data of past 1200 trading days, only 1Y data is presented on the graph)
The current PB for SSE Composite Index, Shenzhen Component Index, GEM Index, CSI300, SSE50, CSI500 are 1.4225,2.7911,5.6556,1.5233,1.2323, 1.9123respectively, and these indices are at 21.10%, 34.40%, 64.40%, 55.60%, 51.50%, 25.60% percent rank level of their historic data, respectively.
Graph 6: PB of 6 indices

Graph 7: PB percent rank of 6 indices (calculated by data of past 1200 trading days, only 1Y data is presented on the graph)

(4) Foreign Fund Flow
Last week, there were 5 trading days for northward channel open for stock connect programs. During last week the total foreign fund flow via Stock Connect is 20.79 billion RMB, and the cumulative inflows was 1027.78 billion RMB. Specifically, the fund flow via Shanghai-Hong Kong Stock Connect is 7.12 billion RMB and the fund flow via Shenzhen-Hong Kong Stock Connect is 13.68 billion RMB.
Graph 8: Fund flow via both Shanghai and Shenzhen-Hong Kong Stock Connect in past 1M (100 million CNY)

Graph 9: Fund flow via Shenzhen-Hong Kong Stock Connect in past 1M (100 million CNY)
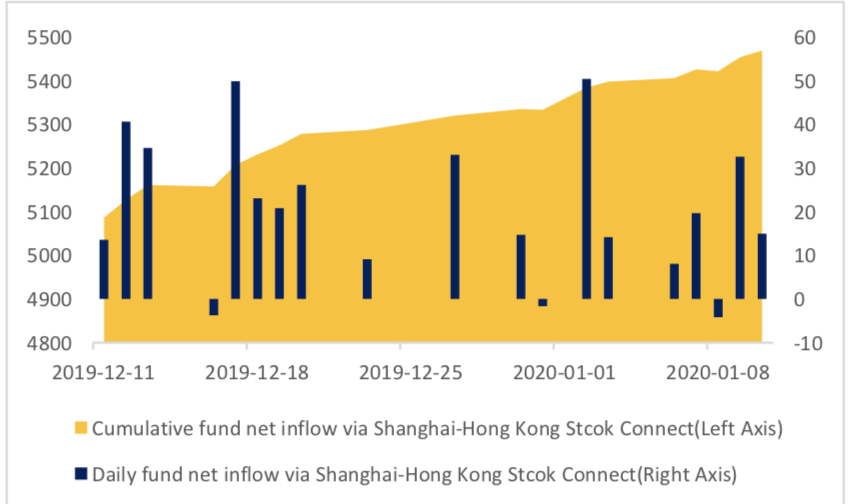
Graph 10: Fund flow via both Shanghai-Hong Kong Stock Connect in past 1M (100 million CNY)

(5) Margin Trading
According to the newest data, the margin financing balance is 967.84 billion, securities borrowing is
13.47 billion, totally 981.31 billion.
Graph 11: Margin Trading(100m RMB)

2. Index Futures
(1) Trading Volume and Open Interests
During past 5 trading days the average trading volume for CSI300(IF), SSE50(IH), CSI500(IC) contracts
are 92143 (-3.97%, the previous 5-trading day period),32173 (-4.85%),105782 (13.01%) lots, respectively. On the last trading day, the total open interests for them are 129623 (0.75%),55935 (-4.48%),173472 (5.09%) lots respectively.
Graph 12: CSI300 Index futures’ trading volume

Graph 13: CSI300 Index futures’ open interests

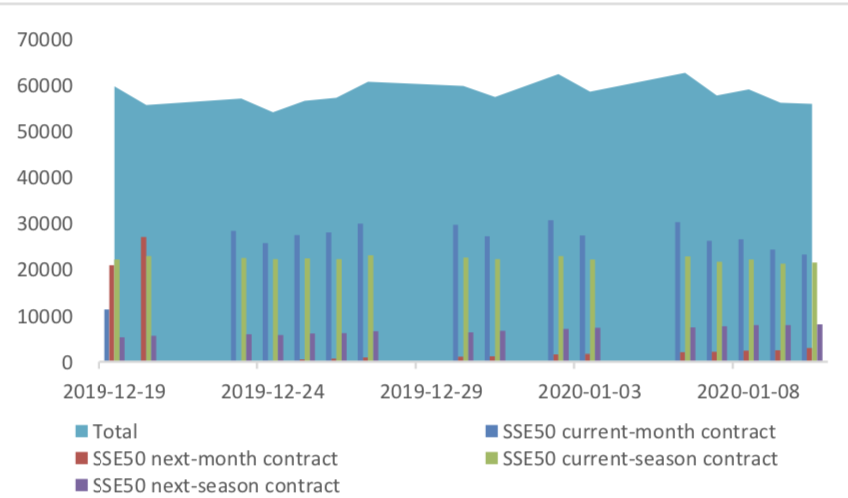
Graph 14:SSE50 Index futures’ trading volume

Graph 15: SSE50 Index futures’ open interests
Graph 16: CSI500 Index futures’ trading volume

Graph 17: CSI500 Index futures’ open interests

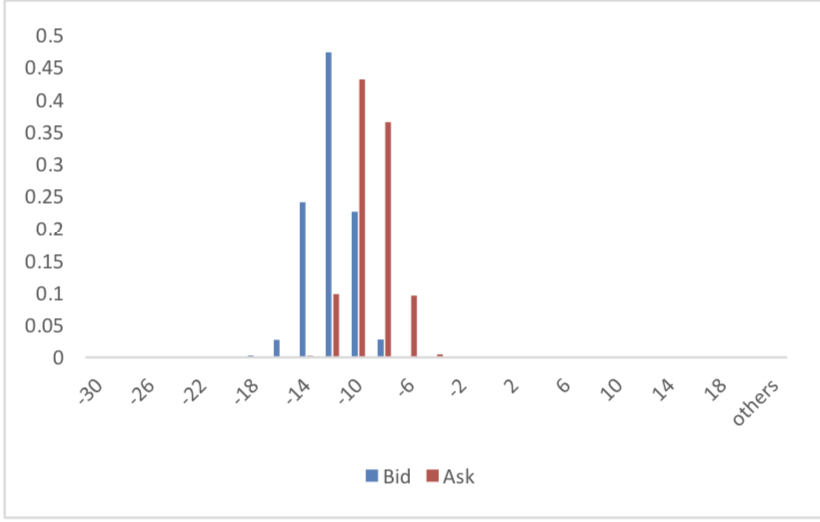
(2) Roll Level Bid-Ask Distribution
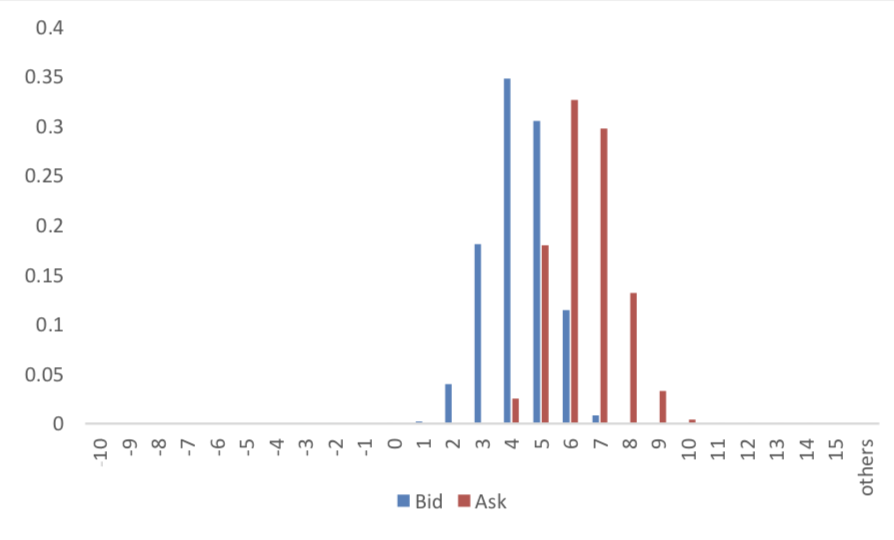
There are 5 trading days during last week, so the distribution is worked out with 36005 data points for each contract pair.
Graph 18: CSI300 Current/Next Month Contract Roll Spread Distribution (2s frequency)

Graph 19: SSE50 Current/Next Month Contract Roll Spread Distribution (2s frequency)
Graph 20: CSI500 Current/Next Month Contract Roll Spread Distribution (2s frequency)
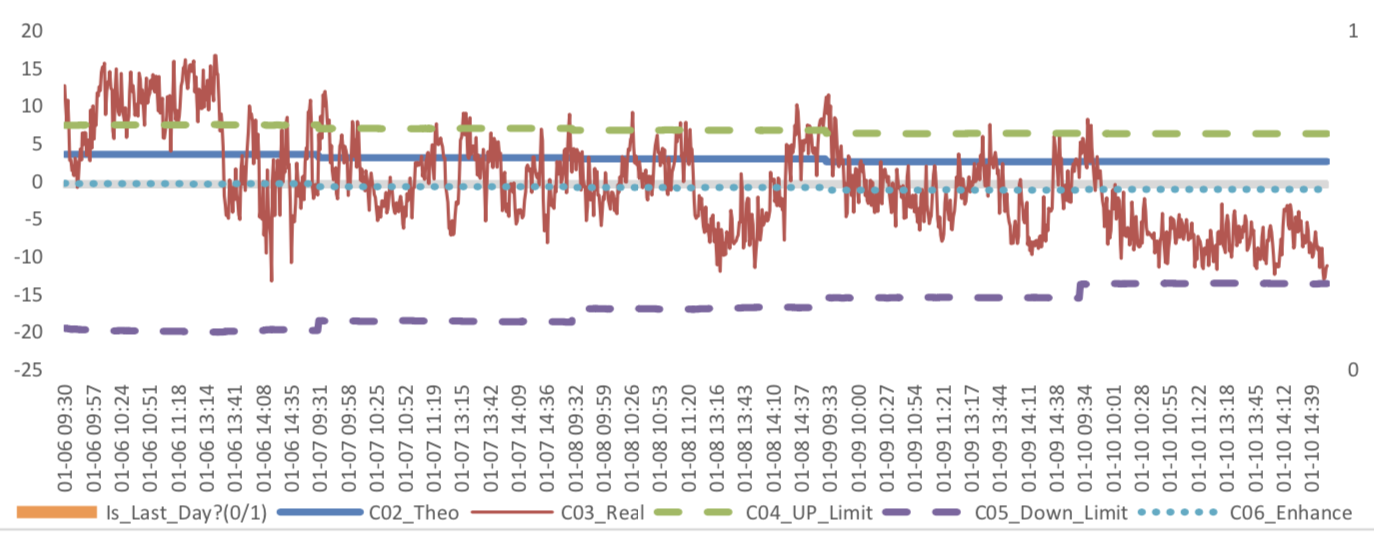
Assumption: risk-free rate: 3%; security borrowing cost: 8%; trading expense for spot: 0.025%; trading expense for futures: 0.005%; margin rates for futures contracts: 0.11 for CSI300 and SSE50, 0.13 for CSI500; margin rate for security borrowing: 0.3 (or 130% maintain rate).
When real price spread is out of theoretical range (calculated by our assumption), there exists absolute future-spot arbitrage opportunity.
Graph 21: Future (Current Month)-Spot Arbitrage Opportunity for CSI300 contract (in the view of price difference)

Graph 22: Future (Current Month)-Spot Arbitrage Opportunity for SSE50 contract (in the view of price difference)

Graph 23: Future (Current Month)-Spot Arbitrage Opportunity for CSI500 contract (in the view of price difference)
Graph 24: Future (Next Month-Current Month) Arbitrage Opportunity for CSI300 contract (in the view of price difference)

Graph 25: Future (Next Month-Current Month) Arbitrage Opportunity for SSE50 contract (in the view of price difference)

Graph 26: Future (Next Month-Current Month) Arbitrage Opportunity for CSI500 contract (in the view of price
difference)

(4) Roll Spread of Stock Index Futures Tracking
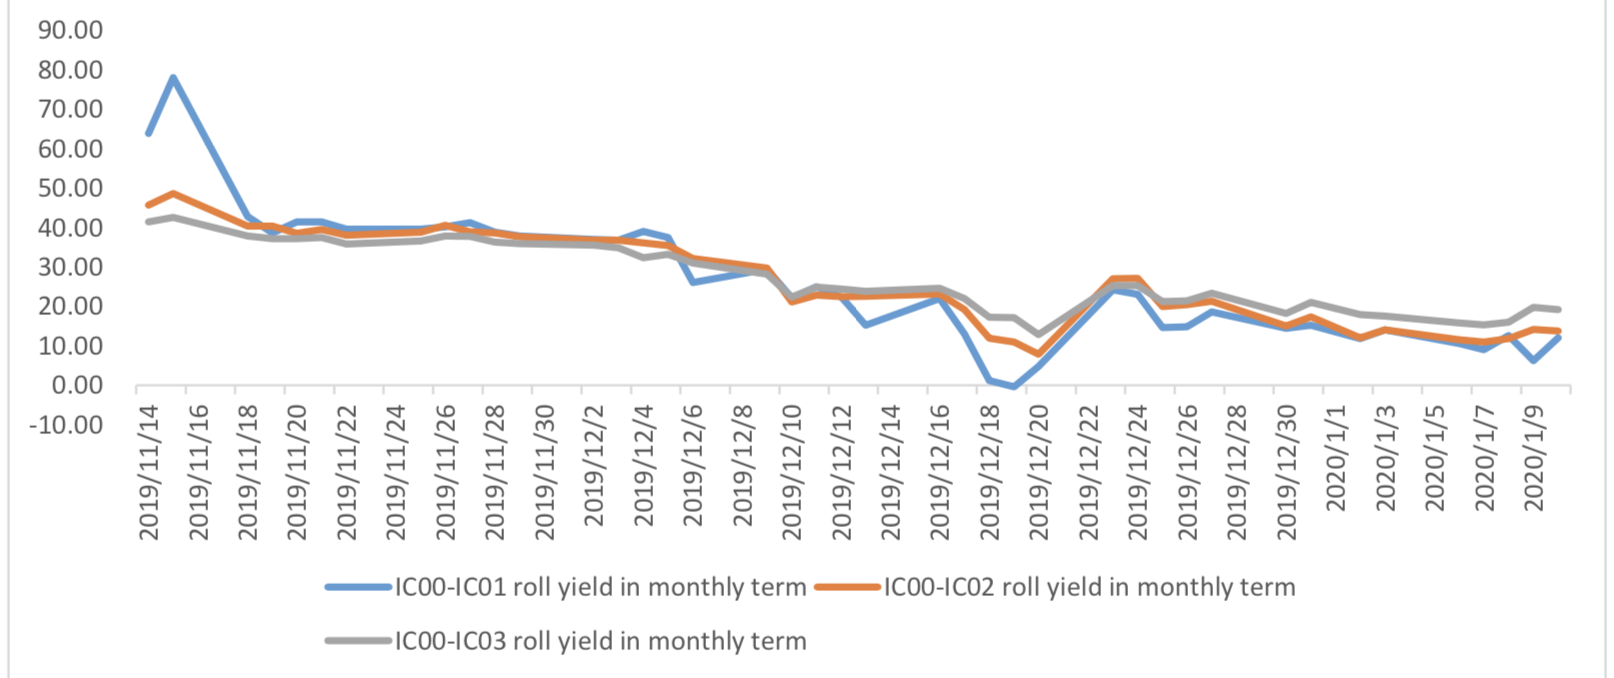
Calculated as the contract price of the current month minus the contract price of the following month, for the long roll, the positive calculation results are gains, the negative calculation results are losses. Code 00 in the figure represents the current month contract, 01 the next month contract, 02 the current quarter contract, 03 the next quarter contract.
(a)IF
Up to2020/1/10,the best roll plan is IF00-IF03,annualized roll yield in monthly term is-0.50%。
Graph 27: IF Current month contract roll yield comparison (index point)

Graph 28: IF Current month contract roll yield comparison (annualized return)

(b)IH
Up to 2020/1/10,the best roll plan is IH00-IH03,annualized roll yield in monthly term is-0.36%。
Graph 29: IH Current month contract roll yield comparison (index point)

Graph 30: IH Current month contract roll yield comparison (annualized return)

(c)IC
Up to2020/1/10,the best roll plan isIC00-IC03,annualized roll yield in monthly term is4.20%。
Graph 31: IC Current month contract roll yield comparison (index point)
Graph 32: IC Current month contract roll yield comparison (annualized return)

(5) Basis Tracking of Stock Index Futures
For long side, if the base difference is positive, the change of the base difference brings losses, and if the base difference is negative, the change of the base difference brings profits.
(a)IF
For long side hedge, up to 2020/1/10,all IF contracts were in premium. Here IF next month contract basis return annualized yield is -2.11%。
Graph 33: IF contracts basis

Table 1: IF basis return calculation

(b)IH
For long side hedge, up to 2020/1/10,all IH contracts were in premium. Here IH next month
contract basis return annualized yield is -3.08%。
Graph 34: IH contracts basis

Table 2: IH basis return calculation

(c)IC
For long side hedge, up to 2020/1/10,all IC contracts were in discount. Here IC next month contract
basis return annualized yield is 4.30%。
Graph 35: IC contracts basis

Table 3: IC basis return calculation

3. Financial Markets
(1) Interest Rates
The term structure of treasury bonds’ yields is currently upward sloping in concave shape.
Specifically, last week, short-term yields short term yield of Treasury bond experienced some fluctuation and 3M yield now at 2.0%-2.2% level. Furthermore, as for long-term yield, there is a small drop. 10Y yield is about 3.0%-3.2%.
Graph 36: Term Structure Evolvement of Treasury Bonds Yields During Recent 3 Months (%)

As for Shibor rates, short-term rates experienced significant fluctuation. Specifically, O/N rate experienced obvious fluctuation to 1.0%-1.2% level.
Graph 37: Term Structure Evolvement of Shibor Rates During Recent 3 Months (%)

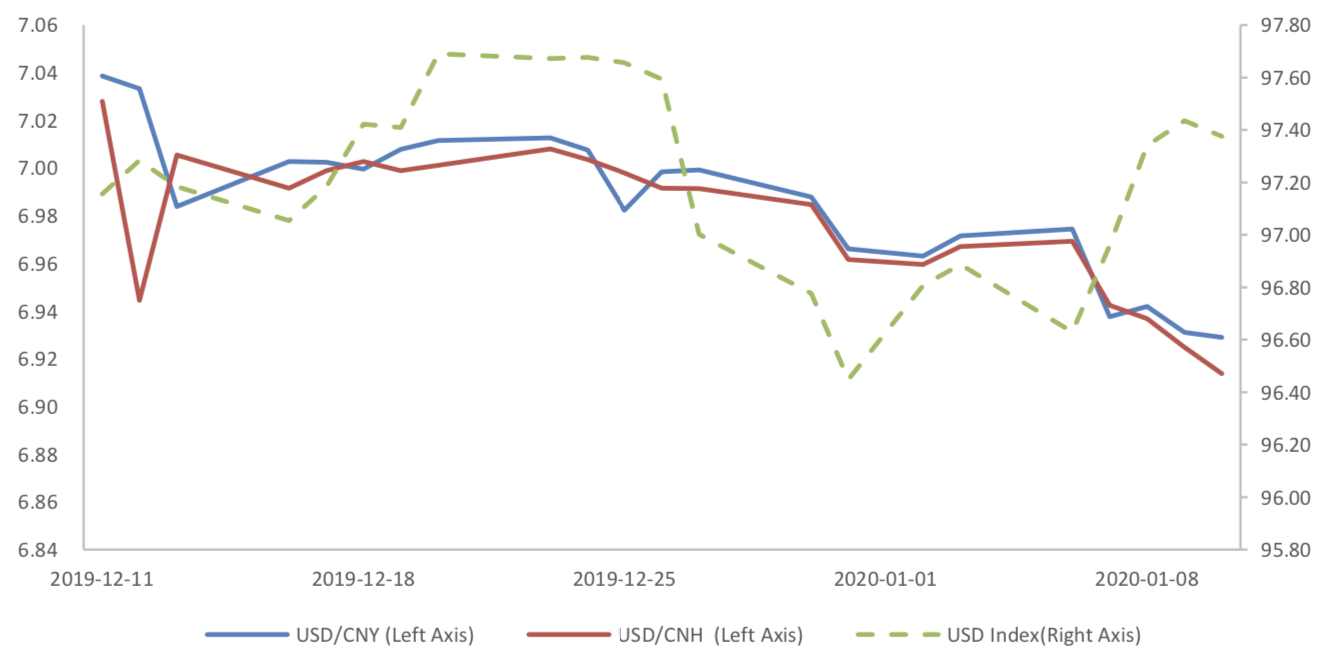
(2) ExchangeRates
During last week, CNY/USD changed -0.611% to 6.9290 and offshore rate, CNH/USD, changed - 0.77% to 6.9138 and USD index changed 0.50%.
Graph 38: USD/CNY, USD/CNH and USD Index
Macroeconomic Topic:
According to the released price data by the national bureau of statistics. The data showed that year-on- year CPI stopped rising. PPI is still in deflation region. The data showed that the year-on-year and ring ratio CPI were 4.5 percent and 0.0 percent, respectively, compared with pre value of 4.5 percent and 0.4 percent, respectively. Year-on-year and ring ratio PPI were -0.5 percent and 0 percent, respectively, compared with the previous figures of -1.4 percent and -0.1 percent, respectively.
December Price Data
(1) CPI Data
Graph A: CPI Data

The main reason for CPI stopped rising is the dropping of food price. Food CPI increased by 17.4% year-on-year, while non-food CPI increased by 1.3%. The core CPI has remained flat for several months.
Graph B: year-on-year CPI: by Food, Non-Food, Core, Services, Consumer Goods (%)

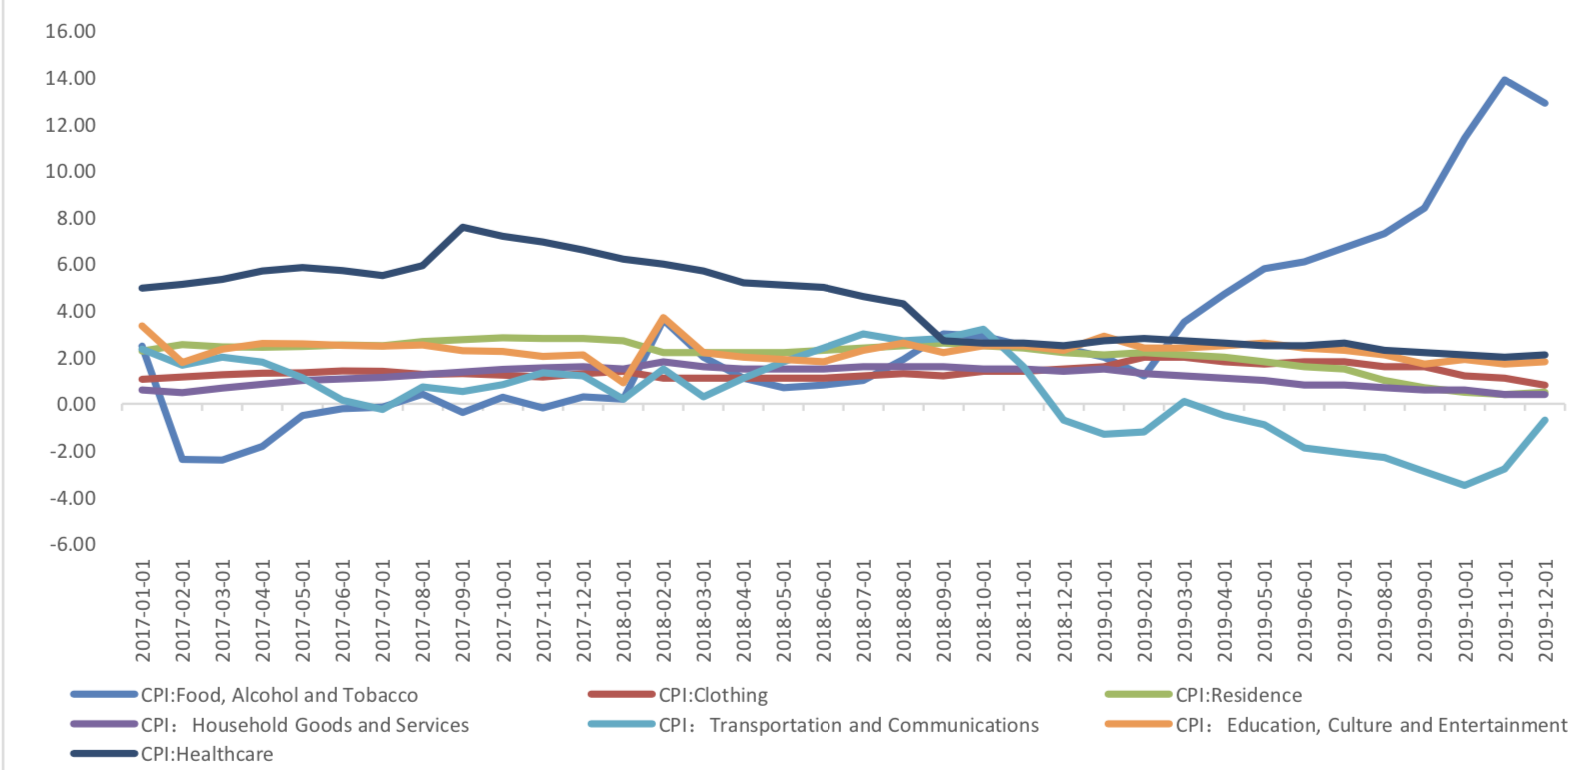
Residence, education, culture and entertainment, healthcare, household goods and service prices rose slightly, with growth rates of 0.5%, 1.8%, 2.1% and 0.4% respectively. Transportation and communication dropped 0.7%
Graph C: year-on-year CPI: by Food Alcohol and Tobacco, Clothing, Residence, Household Goods & Services, Transportation & Communications, Education, Culture & Entertainment, Healthcare (%)
(2) PPI Data
Graph D: PPI Data (%)

The means of production PPI was -1.2 percent year-on-year, increased 1.3 percentage point from the previous month. The means of livelihoods PPI, was 1.3 percent, compared with the previous value of 1.6 percent.
Graph E: PPI Data, by means of production and means of livelihoods

(3) Summary
In December, prices leveled at a high level, mainly due to the fall of pig prices at a high level. However, considering the Spring Festival, the low base of pig prices in the same period last year, and the fluctuation of oil prices, it is difficult to change the situation of price recovery in a short time. However, the core CPI is flat at low level, and the price fluctuation is still disturbed by short-term factors and supply side factors in nature. The basis for the overall level of prices to remain stable should remain.
Currently no Comments.
Hot Topics
The 13rd China International Future Forum
The Shanghai Derivatives Energy Forum has received extensive attention from relevant industries both within and outside the borders.
Financial institutions deep explore commodity market opportunities, commodity index financial products show full-scale trend
R-Code for analysis: getKDJ
R-Code@June 06, 2016
New indicator to analyze the arbitrage opportunities between sse50 and csi500
Market review: January 11, 2017
The Great China Bubble: Anniversary Lessons and Outlook
Quant Investment in China A-share market
The hedge strategy between SSE50 and A50--Jan 13,2017
The arbitraging strategy between CSI300 and SSE50
Market review: June 17, 2016
Sleepless in London--Enda Homan(Allied Irish Banks Plc)
MSCI Rebuffs Chinese Equities for Third Time in Blow to Xi
Soros, Druckenmiller among hedgies profiting in market plunge