FangQuant › Financial Futures
Market Summary:
Last week, there was generally increase over the market. Shanghai SE Composite Index (000001.SH) changed 2.62 % to 3083.79. Specifically, small cap shares perform better than large cap shares and we can observe that CSI500 did better than SSE50 (3.89% vs 2.00%). The average daily turnover of the whole market during past 5 trading days is 644.52 billion CNY, it increased 26.04% compared with the previous 5-trading day period.
According to Economic reference, the National Bureau of statistics will release the CPI data of December 2019 in the near future. Many institutions predict that in terms of food, the overall price of meat will fall in December 2019, but the price of vegetables and fruits will be stronger in winter. In terms of non food, due to the impact of the recent increase in oil price and the base number, CPI will be flat or slightly up year-on-year, or between 4.5% and 4.8%. Looking forward to 2020, the agency believes that from the second quarter, especially in the second half of the year, CPI may enter a period of decline year on year.
During the weekend, there is increasing level of US and Iran military conflict, which causes new impact to the market which was unexpected.
As for arbitrage opportunity, all futures current-month contracts show some room for arbitrage opportunities. No price spread for next-month/current month contracts show room for arbitrage.
News:
(1) Xinhua News Agency: a group of live broadcast concept stocks have become the "Internet red" in the A- share market. Some are in a hurry to get rid of hot spots, some are busy to write off, and some are in high position of listed companies to reduce their holdings. For the hot concept of live broadcast, investors need to think calmly and discern coldly when they "buy it".
(2) Broker China: the fourth foreign insurance asset management is coming, foreign insurance institutions are expected to have more significant changes in 2020, and the first wholly foreign-owned life insurance company in China is expected to be born. AIA is expected to become the first wholly foreign-owned life insurance company in China. In addition, Allianz also intends to achieve a wholly-owned holding of Allianz China and Germany.
(3)The National Conference on foreign exchange management will be held in Beijing in 2020, which will focus on this year's work. We will continue to improve the "macro Prudential + micro regulatory" two in one management framework for the foreign exchange market and maintain the basic balance of international payments. We should guard against external shock risks, safeguard the national economic and financial security, and promote the construction of "digital external management" and "security external management".
(4)2020 central bank working conference was held. The meeting summarized the main work in 2019, analyzed the current economic and financial situation, and deployed the key work in 2020. The meeting called for the preparation of macro Prudential policy guidelines. Build a macro Prudential stress test system. We will accelerate the establishment and improvement of a macro Prudential management mechanism for cross-border capital flows that integrates local and foreign currencies. We will gradually expand the coverage of macro prudential policies. To organize and implement the evaluation of systemically important banks and promote the promulgation of the supervision and management measures for financial holding companies. We will accelerate the establishment of a long-term management mechanism for real estate finance.
(5)Beijing News: Wang Shouwei, director of China Meat Research Center: "artificial meat" is a landmark product of food in the future, and the agency predicts that the global market share of "artificial meat" will reach 60% by 2040; at present, the national standard of "artificial plant meat" is being formulated, and there is no timetable for its promulgation.
(6)China Securities News: Wang Xiaoshu, head of Asia Pacific region of MSCI ESG research department, said that more A-share listed companies entering the vision of global investors is an opportunity as well as a challenge, which means that A-share listed companies need to compare and compete with global peers, especially in the field of ESG; MSCI has developed the ESG leader index for the Chinese market, which will further promote relevant supporting measures in 2020 To ground.
1. StockMarket
(1) Indices Performance
During last week, Shanghai SE Composite Index (000001.SH) changed 2.62 % to 3083.79, Shenzhen Component Index (399001.SZ) changed 4.13 % to 10656.41, ChiNext Price Index (399006.SZ) changed 3.87 % to 1836.01, CSI 300 INDEX (000300.SH) changed 3.06 % to 4144.96, CSI SmallCap 500 index (000905.SH) changed 3.89 % to 5380.64, SSE 50 Index (000016.SH) changed 2.00 % to 3078.28.
Graph 1: Indices Performance over past 3 months

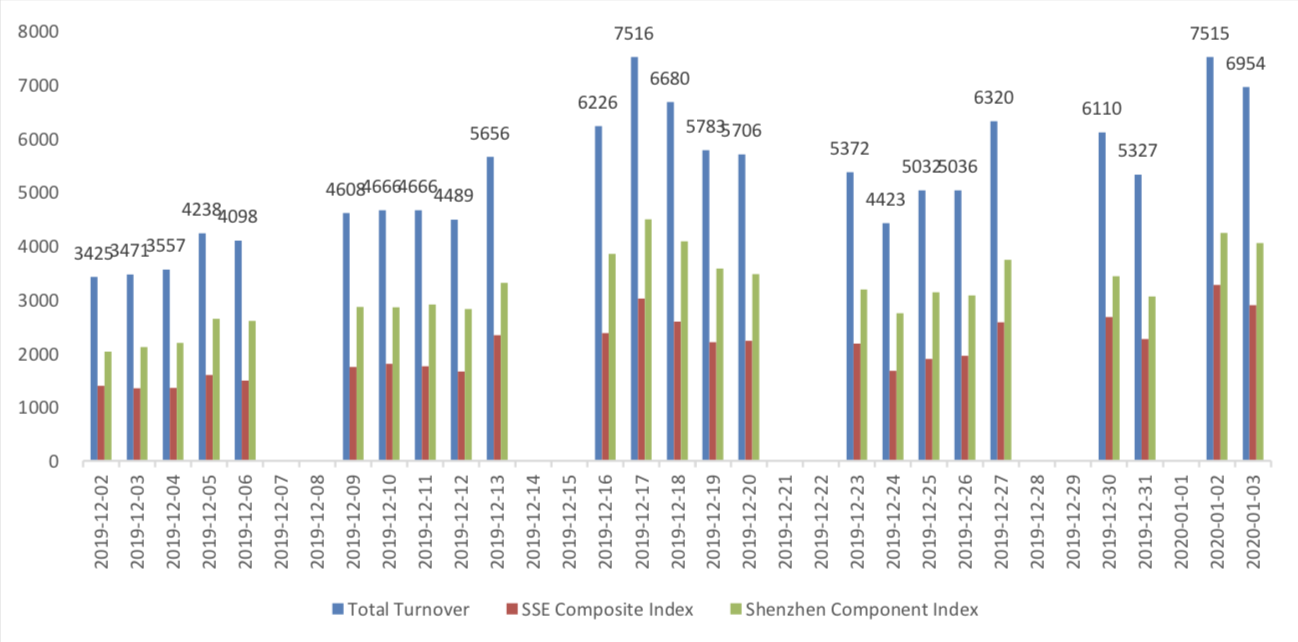
The average daily turnover of the whole market during past 5 trading days is 644.52 billion CNY, it increased 26.04% compared with the previous 5-trading day period.
Graph 2: Market turnover
(2) Sectors Performance
In the view of sectors, during last week (from 2019-12-27 to 2020-01-03), 24 of 24 Wind Level- 2 sector(s) increased while 0 sector(s) dropped. Specifically, Media (5.90%), Materials (4.62%) and
Energy (4.09%) did the best performance while Health Care Equipment & Services(1.62%), (1.71%) and Banks(1.86%) did the worst performance.
Graph 3: Sectors performance under Wind Level-2 classification (%)

(3) Indices Valuation (TTM)
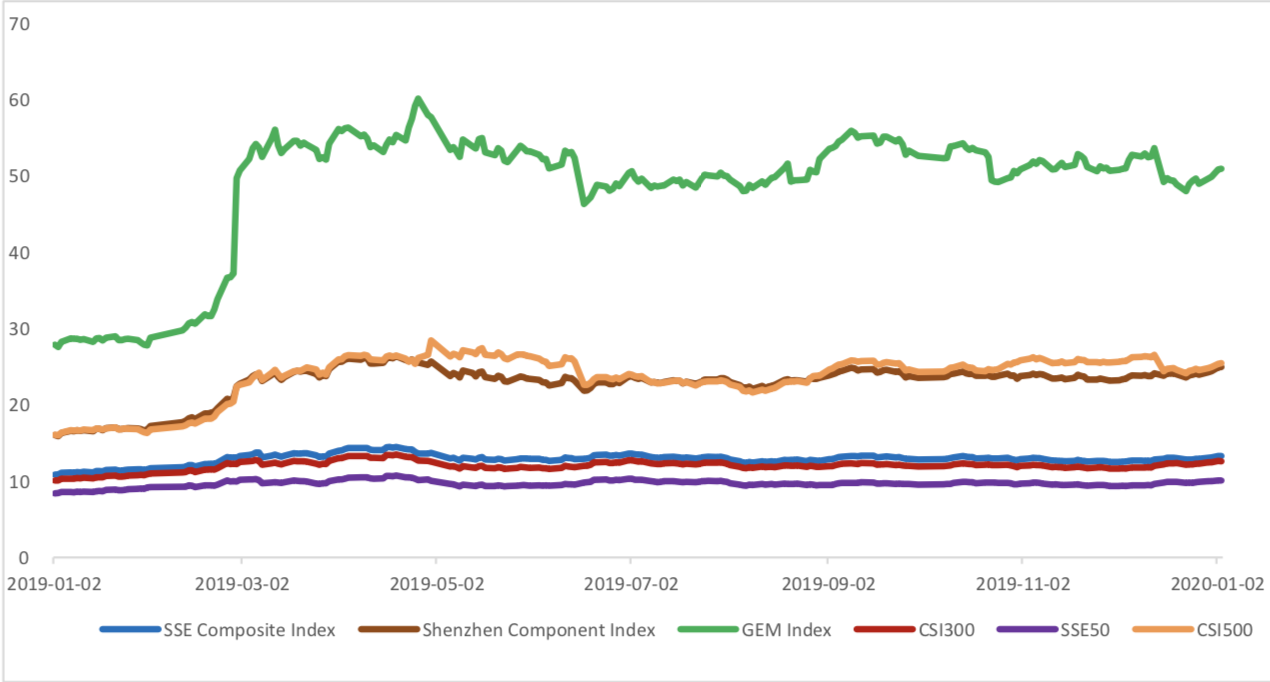
The current PE for SSE Composite Index, Shenzhen Component Index, GEM Index, CSI300, SSE50, CSI500 are 13.2711, 24.9362, 50.9420, 12.6250, 10.0734, 25.4416respectively; and these indices are at 28.10%, 38.20%, 58.90%, 45.20%, 44.90%, 25.90% percent rank level of their historic data, respectively
Graph 4: PE of 6 indices
Graph 5: PE percent rank of 6 indices (calculated by data of past 1200 trading days, only 1Y data is presented on the graph)

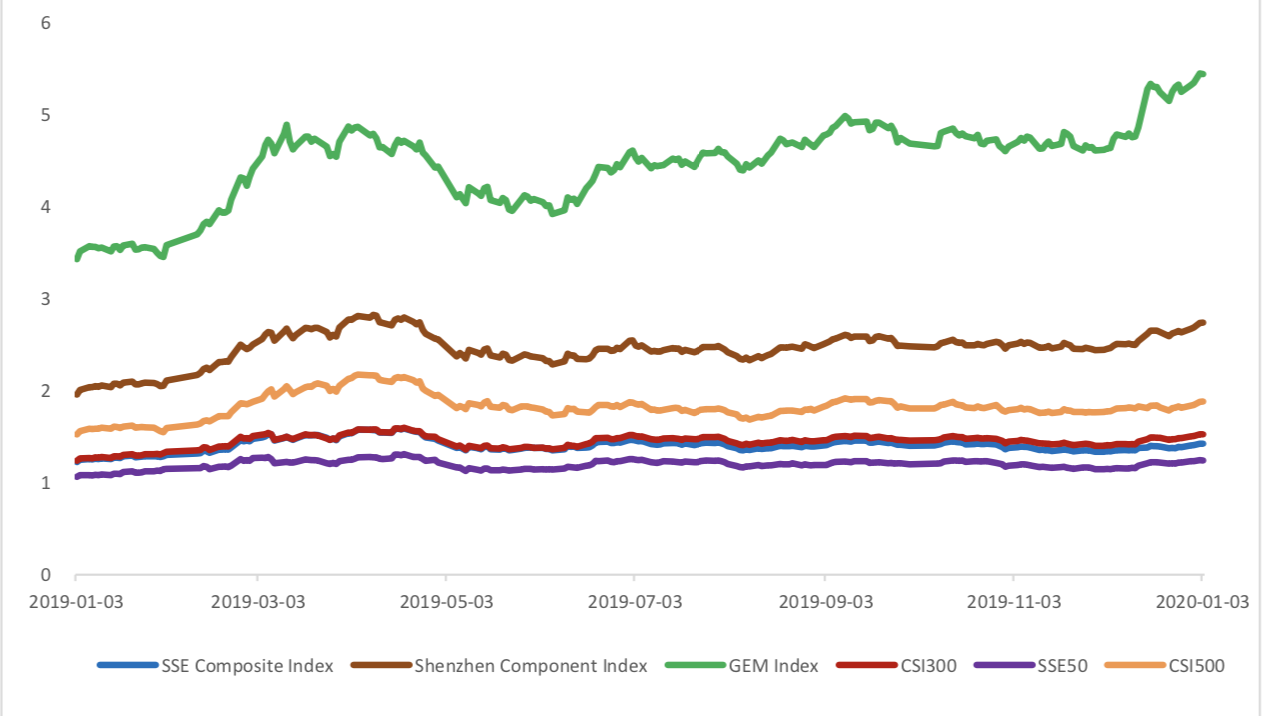
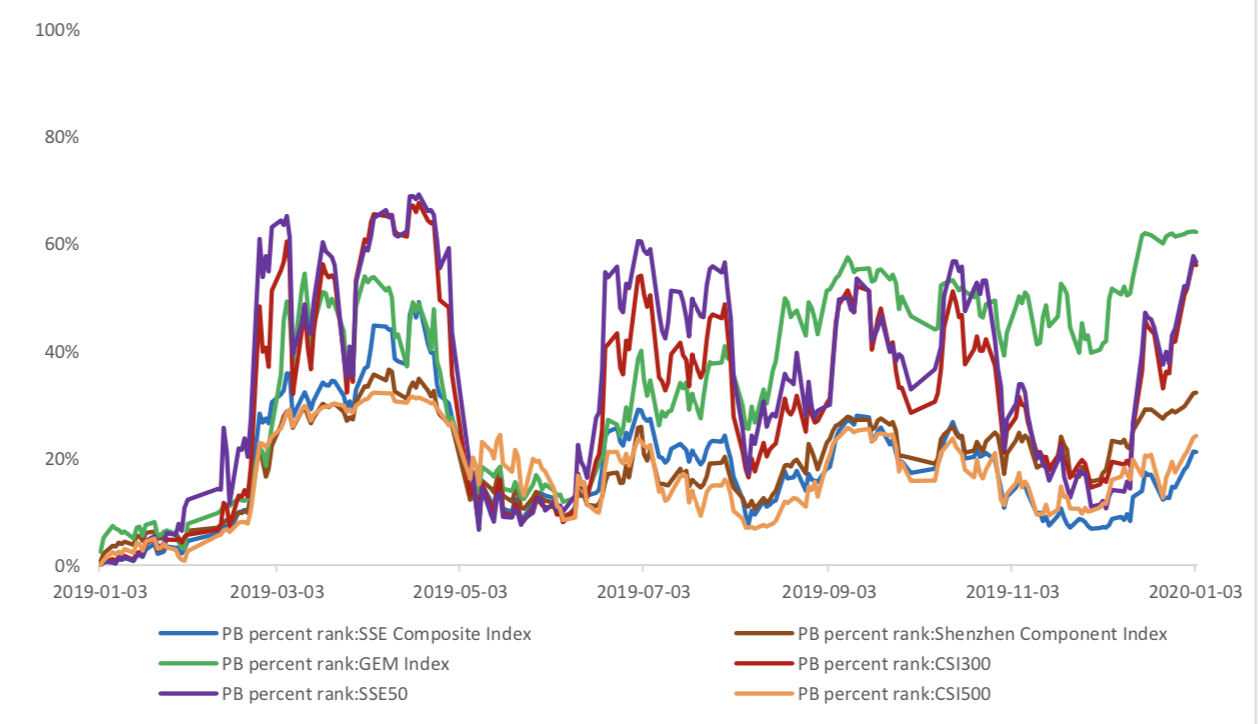
The current PB for SSE Composite Index, Shenzhen Component Index, GEM Index, CSI300, SSE50, CSI500 are 1.4241,2.7403,5.4435,1.5260,1.2425, 1.8809respectively, and these indices are at 21.10%, 32.20%, 62.20%, 56.00%, 56.60%, 24.10% percent rank level of their historic data, respectively.
Graph 6: PB of 6 indices
Graph 7: PB percent rank of 6 indices (calculated by data of past 1200 trading days, only 1Y data is presented on the graph)
(4) Foreign Fund Flow
Last week, there were 2 trading days for northward channel open for stock connect programs. During last week the total foreign fund flow via Stock Connect is 6.43 billion RMB, and the cumulative inflows was 1006.98 billion RMB. Specifically, the fund flow via Shanghai-Hong Kong Stock Connect is 4.21 billion RMB and the fund flow via Shenzhen-Hong Kong Stock Connect is 2.21billion RMB.
Graph 8: Fund flow via both Shanghai and Shenzhen-Hong Kong Stock Connect in past 1M (100 million CNY)

Graph 9: Fund flow via Shenzhen-Hong Kong Stock Connect in past 1M (100 million CNY)

Graph 10: Fund flow via both Shanghai-Hong Kong Stock Connect in past 1M (100 million CNY)

(5) Margin Trading
According to the newest data, the margin financing balance is 967.84 billion, securities borrowing is
13.47 billion, totally 981.31 billion.
Graph 11: Margin Trading(100m RMB)

2. Index Futures
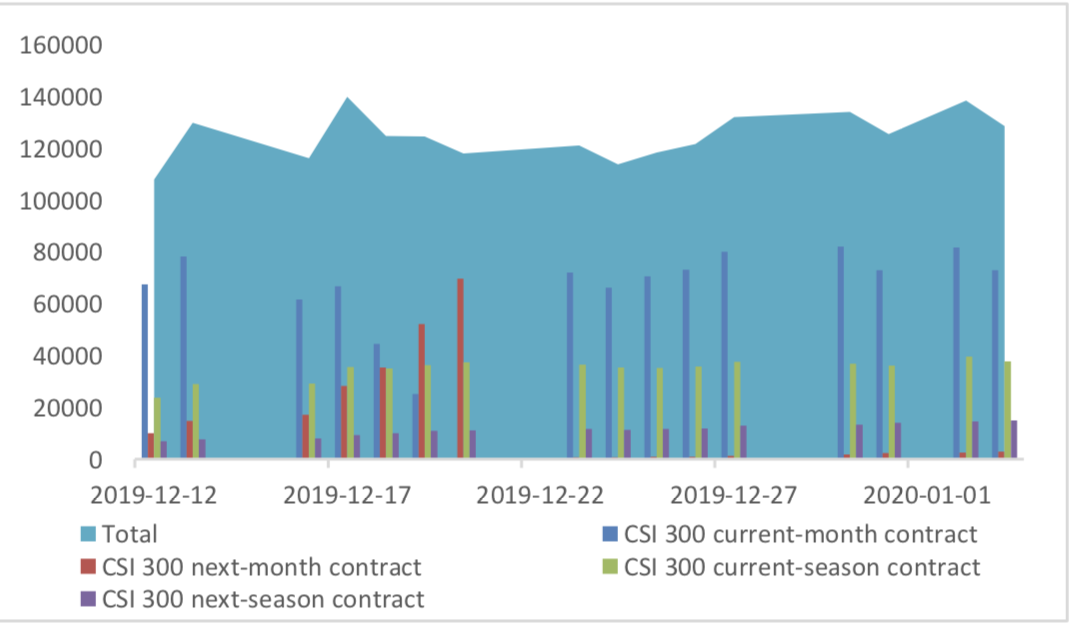
(1) Trading Volume and Open Interests
During past 5 trading days the average trading volume for CSI300(IF), SSE50(IH), CSI500(IC) contracts
are 95948 (21.24%, the previous 5-trading day period),33814 (19.20%),93604 (-3.28%) lots, respectively. On the last trading day, the total open interests for them are 128654 (5.64%),58556 (2.39%),165064 (- 1.37%) lots respectively.
Graph 12: CSI300 Index futures’ trading volume

Graph 13: CSI300 Index futures’ open interests
Graph 14:SSE50 Index futures’ trading volume

Graph 15: SSE50 Index futures’ open interests

Graph 16: CSI500 Index futures’ trading volume

Graph 17: CSI500 Index futures’ open interests

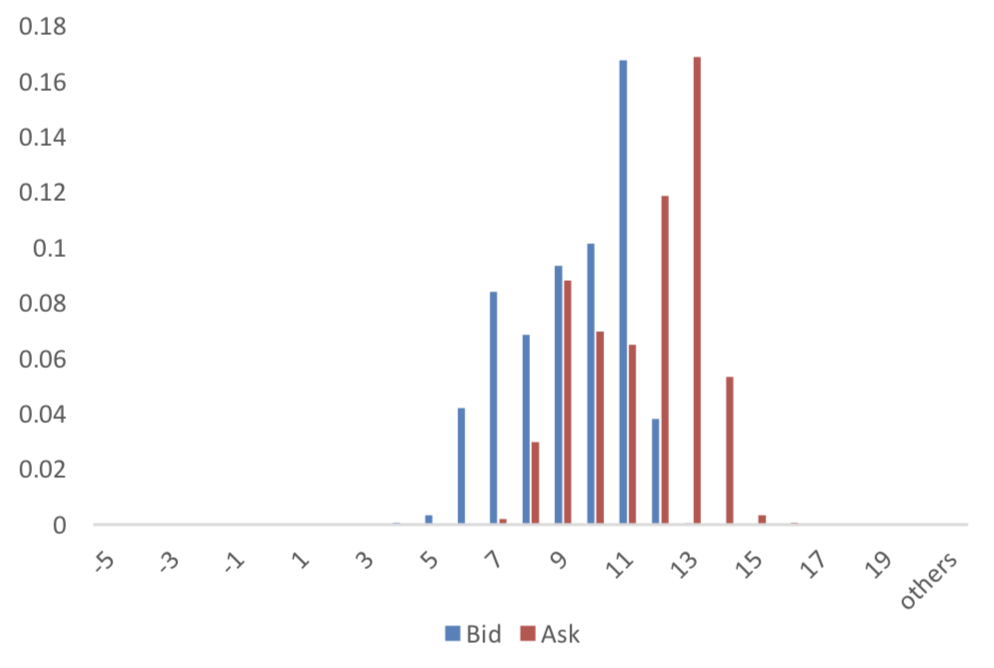
(2) Roll Level Bid-Ask Distribution
There are 5 trading days during last week, so the distribution is worked out with 36005 data points for each contract pair.
Graph 18: CSI300 Current/Next Month Contract Roll Spread Distribution (2s frequency)
Graph 19: SSE50 Current/Next Month Contract Roll Spread Distribution (2s frequency)

Graph 20: CSI500 Current/Next Month Contract Roll Spread Distribution (2s frequency)

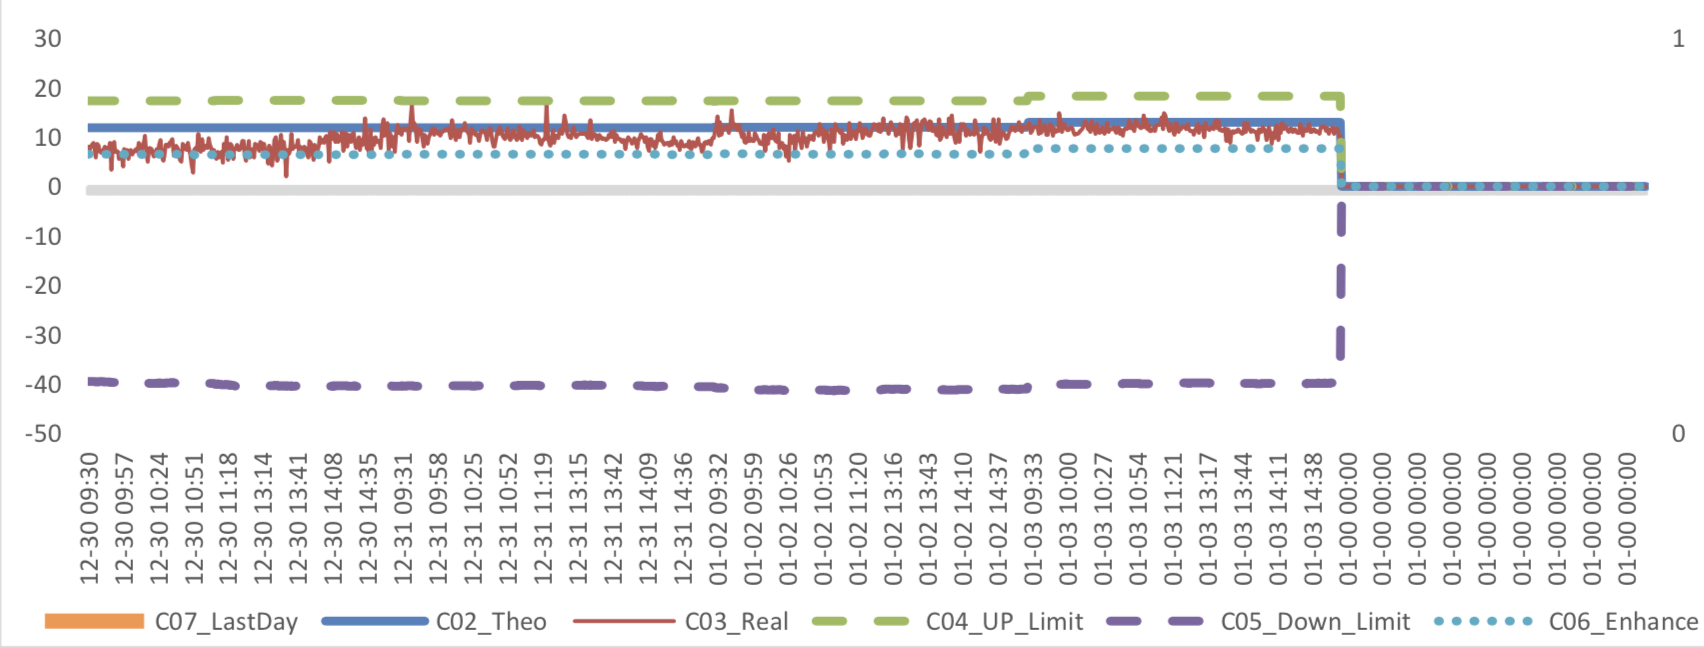
(3) Weekly Review of Future/Spot Arbitrage Opportunity
Assumption: risk-free rate: 3%; security borrowing cost: 8%; trading expense for spot: 0.025%; trading expense for futures: 0.005%; margin rates for futures contracts: 0.11 for CSI300 and SSE50, 0.13 for CSI500; margin rate for security borrowing: 0.3 (or 130% maintain rate).
When real price spread is out of theoretical range (calculated by our assumption), there exists absolute future-spot arbitrage opportunity.
Graph 21: Future (Current Month)-Spot Arbitrage Opportunity for CSI300 contract (in the view of price difference)

Graph 22: Future (Current Month)-Spot Arbitrage Opportunity for SSE50 contract (in the view of price difference)

Graph 23: Future (Current Month)-Spot Arbitrage Opportunity for CSI500 contract (in the view of price difference)

Graph 24: Future (Next Month-Current Month) Arbitrage Opportunity for CSI300 contract (in the view of price difference)
Graph 25: Future (Next Month-Current Month) Arbitrage Opportunity for SSE50 contract (in the view of price difference)

Graph 26: Future (Next Month-Current Month) Arbitrage Opportunity for CSI500 contract (in the view of price
difference)

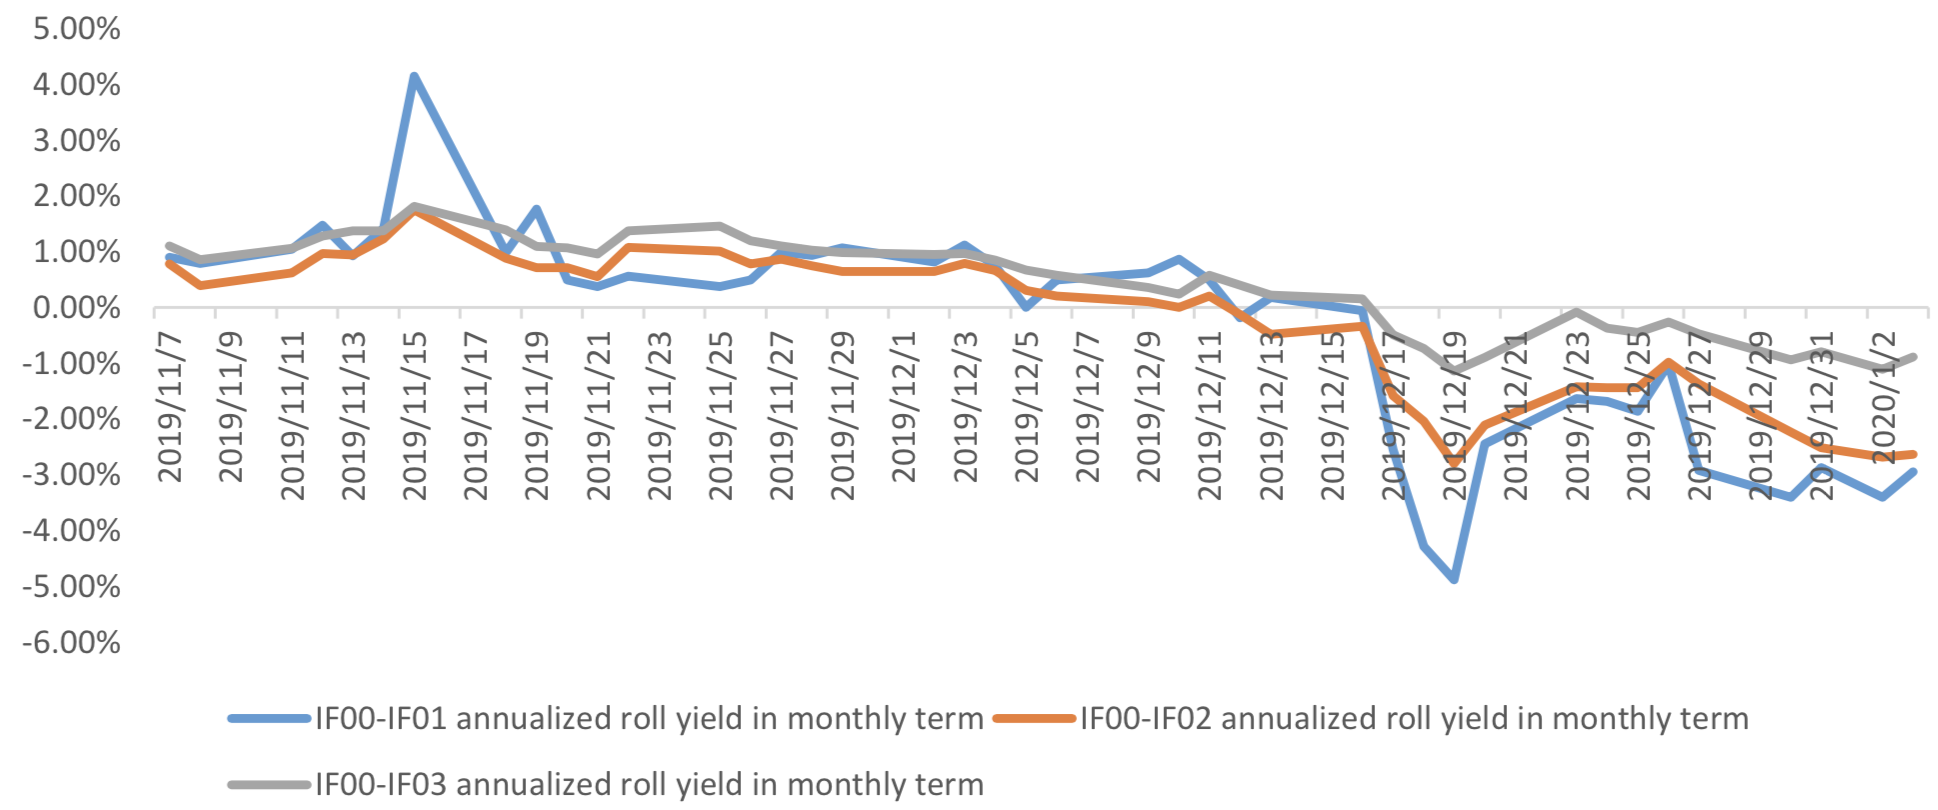
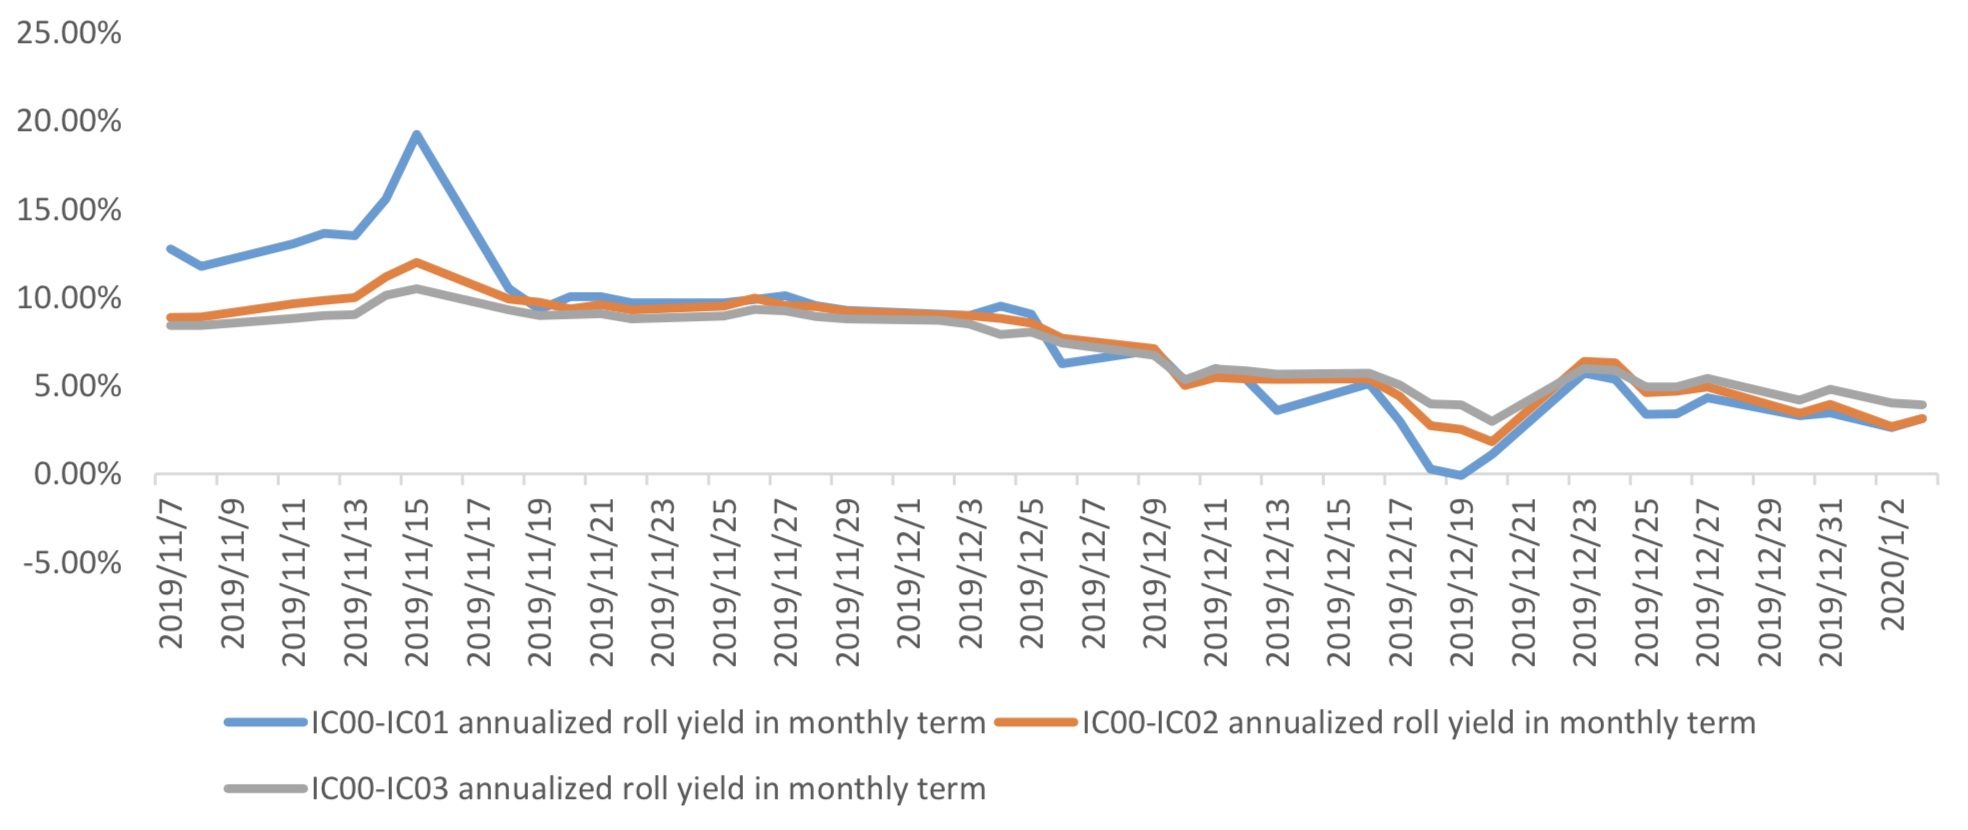
(4) Roll Spread of Stock Index Futures Tracking
Calculated as the contract price of the current month minus the contract price of the following month, for the long roll, the positive calculation results are gains, the negative calculation results are losses. Code 00 in the figure represents the current month contract, 01 the next month contract, 02 the current quarter contract, 03 the next quarter contract.
(a)IF
Up to2020/1/3,the best roll plan is IF00-IF03,annualized roll yield in monthly term is-0.89%。
Graph 27: IF Current month contract roll yield comparison (index point)

Graph 28: IF Current month contract roll yield comparison (annualized return)
(b)IH
Up to 2020/1/3,the best roll plan is IH00-IH03,annualized roll yield in monthly term is-0.65%。
Graph 29: IH Current month contract roll yield comparison (index point)

Graph 30: IH Current month contract roll yield comparison (annualized return)

Up to2020/1/3,the best roll plan isIC00-IC03,annualized roll yield in monthly term is3.92%。
Graph 31: IC Current month contract roll yield comparison (index point)

Graph 32: IC Current month contract roll yield comparison (annualized return)
(5) Basis Tracking of Stock Index Futures
For long side, if the base difference is positive, the change of the base difference brings losses, and if the base difference is negative, the change of the base difference brings profits.
(a)IF
For long side hedge, up to 2020/1/3,all IF contracts were in premium. Here IF next month contract basis return annualized yield is -3.36%。
Graph 33: IF contracts basis

Table 1: IF basis return calculation

(b)IH
For long side hedge, up to 2020/1/3,all IH contracts were in premium. Here IH next month contract
basis return annualized yield is -2.80%。
Graph 34: IH contracts basis

Table 2: IH basis return calculation

(c)IC
For long side hedge, up to 2020/1/3,all IC contracts were in discount. Here IC next month contract
basis return annualized yield is 2.53%。
Graph 35: IC contracts basis
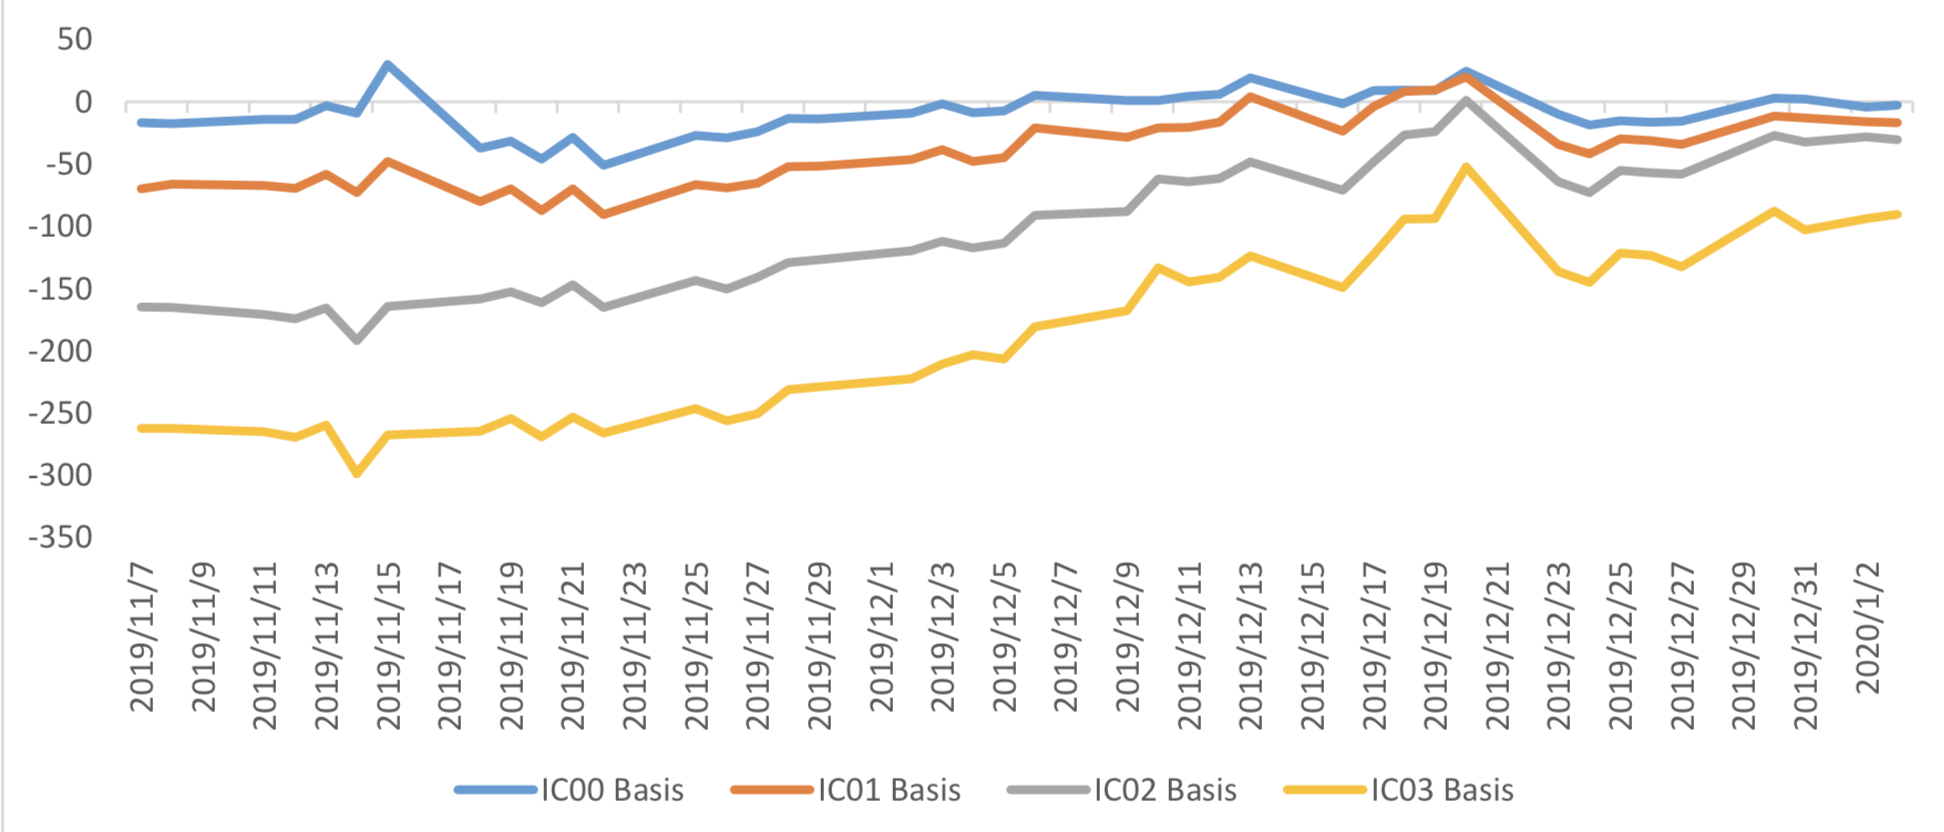
Table 3: IC basis return calculation

3. Financial Markets
(1) Interest Rates
The term structure of treasury bonds’ yields is currently upward sloping in concave shape.
Specifically, last week, short-term yields short term yield of Treasury bond experienced some fluctuation and 3M yield now at 2.0%-2.2% level. Furthermore, as for long-term yield, there is a small drop. 10Y yield is about 3.0%-3.2%.
Graph 36: Term Structure Evolvement of Treasury Bonds Yields During Recent 3 Months (%)

As for Shibor rates, short-term rates experienced significant fluctuation. Specifically, O/N rate experienced obvious fluctuation to 1.0%-1.2% level.
Graph 37: Term Structure Evolvement of Shibor Rates During Recent 3 Months (%)

(2) ExchangeRates
During last week, CNY/USD changed -0.383% to 6.9716 and offshore rate, CNH/USD, changed - 0.35% to 6.9671 and USD index changed -0.72%.
Graph 38: USD/CNY, USD/CNH and USD Index

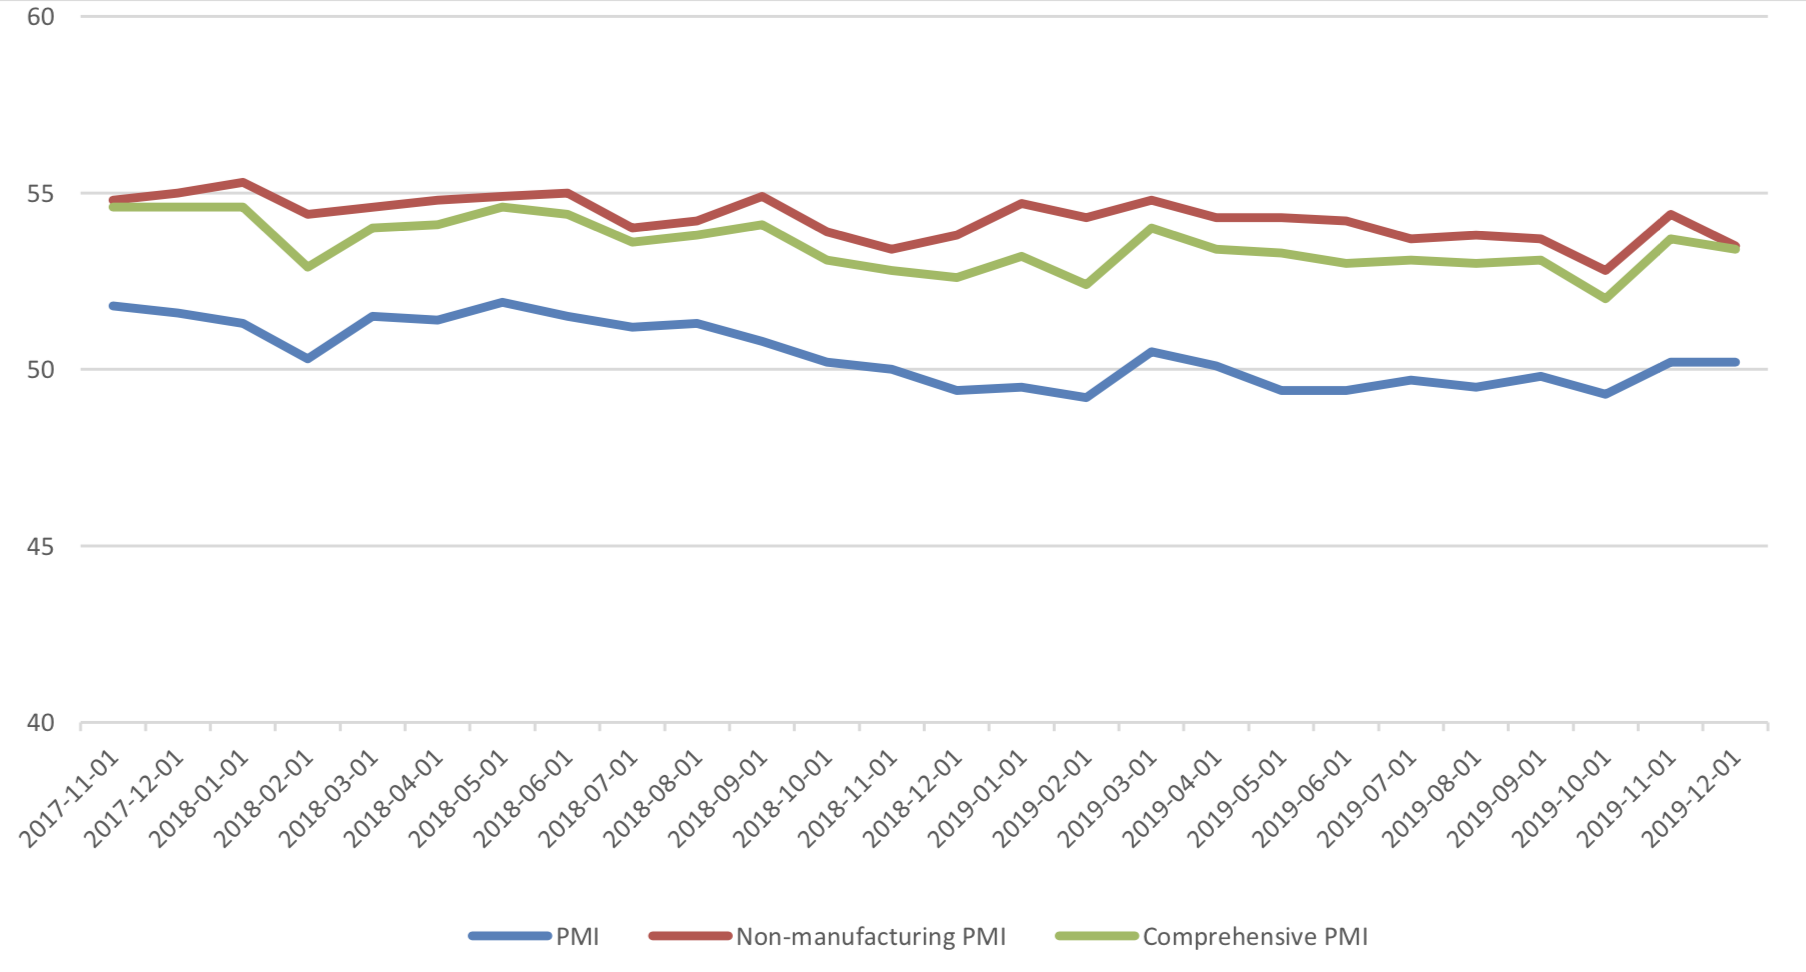
Macroeconomic Topic
On 2019/12/31, the December PMI data was released. The data showed PMI in December kept unchanged. The manufacturing PMI was 50.2 percent, with pre-value of 50.2 percent. The non- manufacturing PMI was at 53.5 percent, with pre-value of 54.4percent, while the composite PMI was at 53.4 percent, with pre-value of 53.7 percent.
December PMI Data
Graph A: PMI Data
(1) About 5 Sub-indexes for manufacturing PMI calculation
From the point of view of 5 sub-indexes: (1) the increase of PMI: production is major force to promote manufacturing PMI. It was reported at 53.2%, still in expansion zone, with preceding value of 52.6% and it promotes PMI for 0.15 percentage points. (2)The decrease of PMI: new orders is a minor force to drag manufacturing PMI. It was reported at 51.2%, still in expansion zone, with preceding value of 51.3% and it drags PMI for 0.03 percentage points. (3)The decrease of PMI: raw material storage, gave another minor force to drag manufacturing PMI. It was reported at 47.2%, still in contraction zone, with preceding value of 47.8% and it promotes PMI for 0.06 percentage points. (4) PMI: employees kept unchanged, 47.3%. (5) The rising of PMI: delivery time of supplier, is the major force to drag manufacturing PMI. It was reported at 51.1%, still in contraction zone, with preceding value of 50.5% and it drags PMI for 0.09 percentage points.
Graph B: PMI 5 sub-indexes

Graph C: PMI Change Contribution by 5 Sub-indexes

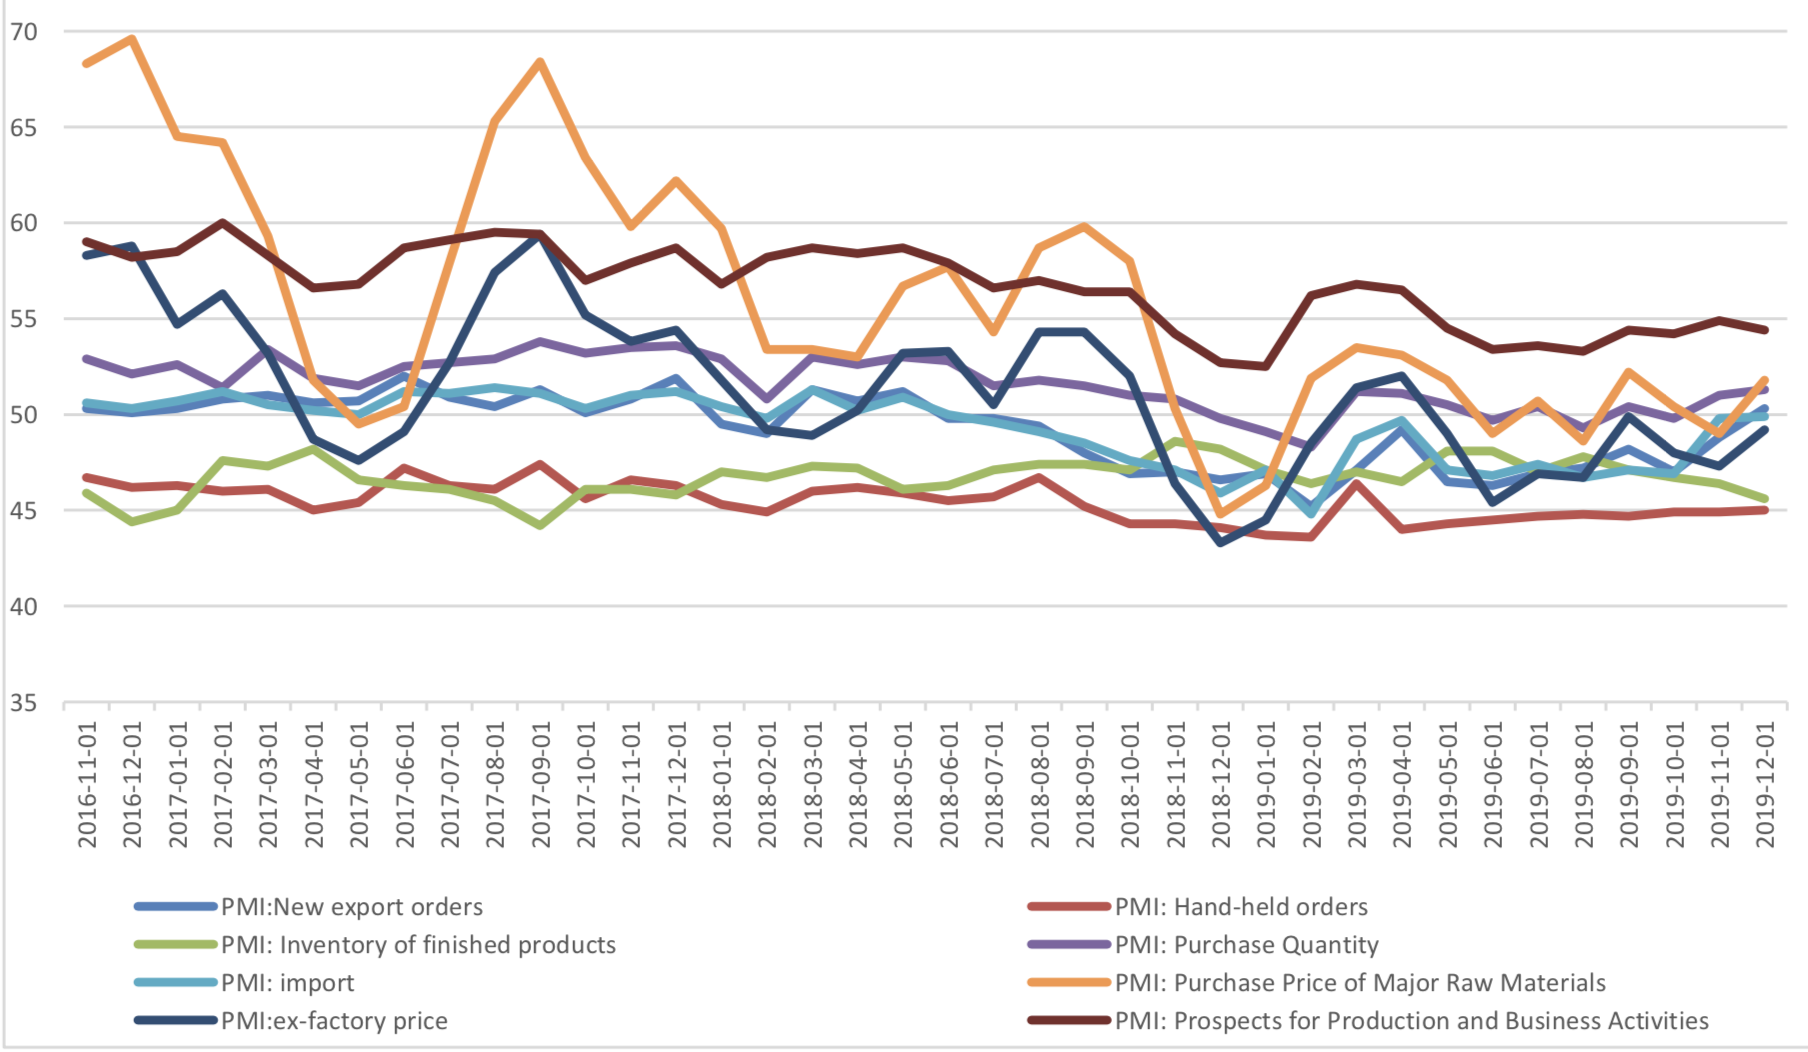
(2) About 8 Sub-indexes not for manufacturing PMI calculation
4 of 8 sub-indexes are above 50, in expansion zone and the remaining indexes are in contraction zone. Several points need to mention: from the relationship between new orders and new export orders, new export orders picked up, while new order PMI fell, although the new order PMI is still in the contraction zone; the difference between the two quickly fell back from 2.5% to 0.9%, showing that the contribution of new order PMI to new order PMI in December increased. To some extent, the rise of PMI of new export orders has the holiday effect of Christmas. In December, the finished product inventory PMI continued to fall, to 45.6%, with the previous value of 46.4%. Combined with the PMI recovery of new orders, the characteristics of finished product inventory removal are obvious.
Graph D: PMI for 8 Sub-indexes not for manufacturing PMI calculation
(3) PMI by enterprises size
From the perspective of PMI of large and medium-sized enterprises, only the medium-sized enterprises have improved and returned to the expansion area; small enterprises have fallen sharply in the contraction area, and the PMI of large enterprises has also fallen slightly in the expansion area.
Graph E: PMI by enterprises size

(4) Summary
Although the PMI in December was the same as that in November, through marginal analysis, the sustainability of economic growth momentum is worth exploring. The decline of new order PMI and import PMI indicates that domestic demand is still weak.
Currently no Comments.
Hot Topics
The 13rd China International Future Forum
The Shanghai Derivatives Energy Forum has received extensive attention from relevant industries both within and outside the borders.
Financial institutions deep explore commodity market opportunities, commodity index financial products show full-scale trend
R-Code for analysis: getKDJ
R-Code@June 06, 2016
New indicator to analyze the arbitrage opportunities between sse50 and csi500
Market review: January 11, 2017
The Great China Bubble: Anniversary Lessons and Outlook
Quant Investment in China A-share market
The hedge strategy between SSE50 and A50--Jan 13,2017
The arbitraging strategy between CSI300 and SSE50
Market review: June 17, 2016
Sleepless in London--Enda Homan(Allied Irish Banks Plc)
MSCI Rebuffs Chinese Equities for Third Time in Blow to Xi
Soros, Druckenmiller among hedgies profiting in market plunge