FangQuant › Financial Futures
Market Summary:
Last week, there was generally decrease over the market. SSE Composite Index (000001.SH) changed -0.21 % to 2885.29. Specifically, small cap shares perform better than large cap shares and we can observe that CSI500 did better than SSE50 (0.73% vs -1.10%). The average daily turnover of the whole market during past 5 trading days is 419.09 billion CNY, it increased 11.58% compared with the previous 5-trading day period.
According to China Securities News, most securities companies said they are bullish on the A-share market in 2020 for the following reasons: the growth rate of A-share profits is expected to bottoming out and picking up. Now there are some excessive concerns about the economy, and it is possible to stabilize the economy in 2020 first. Historical experience shows that the time rule of economic cycle is more effective and stable than the economic logic. A-shares are expected to receive more incremental capital.
As for arbitrage opportunity, CSI500 futures current-month contracts show some room for arbitrage opportunities. Price spread for CSI500 next-month/current month contracts show room for arbitrage.
News:
(1) Securities Daily: since the first municipal Party committee meeting on the science and Innovation Board of Shanghai stock exchange held on June 5, 2019, it has lasted more than 5 and a half months. After 48 meetings, the number of enterprises "passing the meeting" in the review link of the municipal Party committee has finally reached "100". Up to now, there are 104 enterprises in the "meeting" of the municipal Party committee of the science and technology innovation board, but three enterprises have failed (failed and terminated the audit), and one enterprise is still in the state of suspension of deliberation.
(2) Securities Daily: with the continuous adjustment of the A-share market, as of the closing on November 22, there were 377 broken net shares in Shanghai and Shenzhen stock markets, accounting for 10.1% of the total A-share. Some people in the industry think that breaking the net rate of more than 10% means that an important bottom will come.
(3) China Securities News: benefited from the factors such as the increase of the import and delivery of frozen pork, the market supply increased and the market price was suppressed. Since the beginning of November, the price of pork has dropped by 3-5 yuan / Jin. Industry insiders believe that, on the whole, pig production capacity is expected to further stabilize and recover in the fourth quarter, and the output of pigs in the second half of next year will usher in an effective growth.
(4) China Securities Journal: Wang Yiming, deputy director of the development research center of the State Council, said at the "high level international seminar on optimizing the business environment", we should take the opportunity of implementing the regulations on optimizing the business environment to further improve the property rights protection system. China's intellectual property protection has made great progress, but there are still problems of low standards of compensation for infringement. We should establish a punitive compensation system for intellectual property infringement and further strengthen the protection of intellectual property.
(5) Hao Peng, director of the state owned assets supervision and Administration Commission of the State Council, presided over the Expert Symposium on the reform of state-owned enterprises, and listened to opinions and suggestions on the key and difficult issues facing the reform of state-owned enterprises at present and the key measures for deepening the reform of state-owned assets and enterprises in the next step. Hao Peng said that on the basis of extensive research and fully listening to the opinions of all parties, the SASAC is working hard to formulate a three-year action plan for the reform of state-owned enterprises, vigorously promoting the implementation of the reform measures of state-owned assets and state-owned enterprises, and adding new momentum for high-quality economic development.
(6) wind: the general office of the CPC Central Committee and the general office of the State Council printed and issued the opinions on strengthening the protection of intellectual property rights, striving to effectively curb the frequent occurrence of infringement by 2022, and the situation of "hard to provide evidence, long cycle, high cost and low compensation" for the rights holders' rights protection has changed significantly. "Opinions on strengthening the protection of intellectual property rights" proposes to improve the protection system of new formats and fields, and to study and strengthen the protection of patents, trademarks, copyrights, new plant varieties and layout design of integrated circuits. To explore the establishment of drug patent link system and drug patent term compensation system. To study and strengthen the protection of intellectual property rights in sports event broadcasting. Research and establish rules for cross-border e-commerce intellectual property protection, and formulate standards for e-commerce platform protection and management.
1. StockMarket
(1) Indices Performance
During last week, SSE Composite Index (000001.SH) changed -0.21 % to 2885.29, Shenzhen Component Index (399001.SZ) changed -0.22 % to 9626.90, ChiNext Price Index (399006.SZ) changed 0.30 % to 1679.80, CSI 300 INDEX (000300.SH) changed -0.70 % to 3849.99, CSI SmallCap 500 index (000905.SH) changed 0.73 % to 4904.08, SSE 50 Index (000016.SH) changed -1.10 % to 2922.27.
Graph 1: Indices Performance over past 3 months

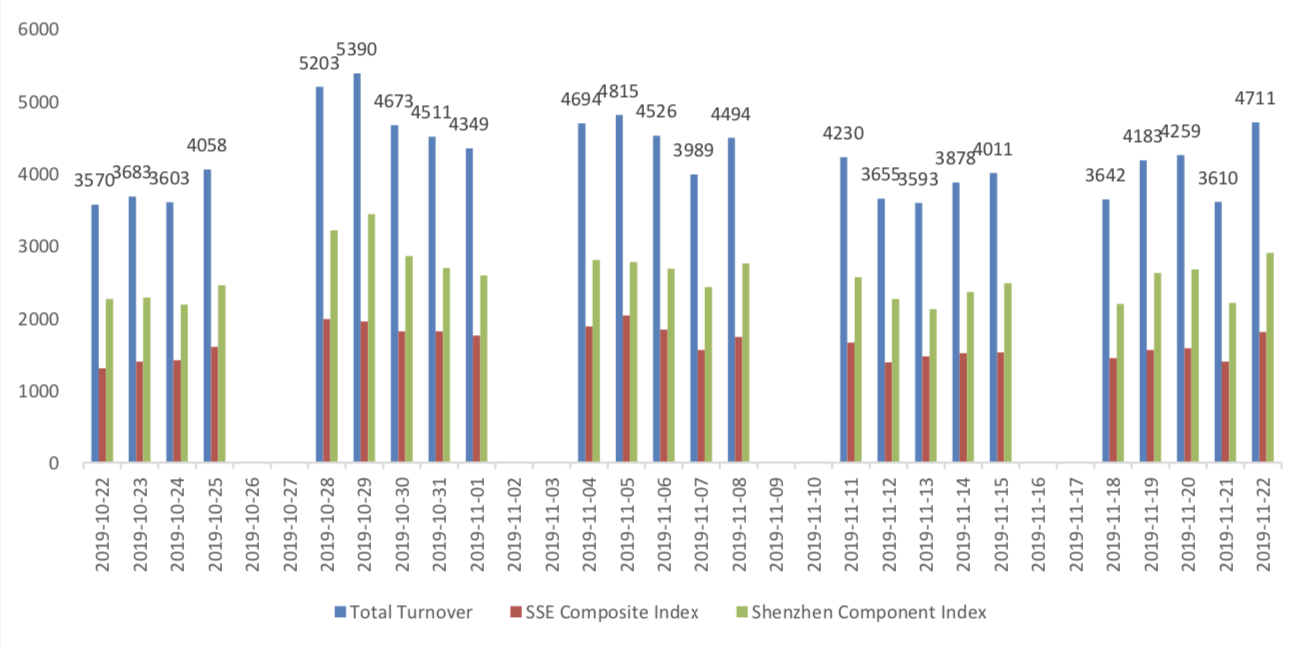
The average daily turnover of the whole market during past 5 trading days is 419.09 billion CNY, it increased 11.58% compared with the previous 5-trading day period.
Graph 2: Market turnover
In the view of sectors, during last week (from 2019-11-15 to 2019-11-22), 9 of 24 Wind Level-2 sector(s) increased while 15 sector(s) dropped. Specifically, Materials (1.69%), Media (1.62%) and Energy (1.59%) did the best performance while Insurance (-3.52%), Semiconductors & Semiconductor Equipment (-3.24%) and Health Care Equipment & Services(-3.23%) did the worst performance.
Graph 3: Sectors performance under Wind Level-2 classification (%)

(3) Indices Valuation (TTM)
The current PE for SSE Composite Index, Shenzhen Component Index, GEM Index, CSI300, SSE50, CSI500 are 12.5595, 23.3298, 51.1703, 11.6800, 9.3931, 25.6180respectively; and these indices are at 11.70%, 24.80%, 58.10%, 17.00%, 15.30%, 26.00% percent rank level of their historic data, respectively
Graph 4: PE of 6 indices

Graph 5: PE percent rank of 6 indices (calculated by data of past 1200 trading days, only 1Y data is presented on the graph)

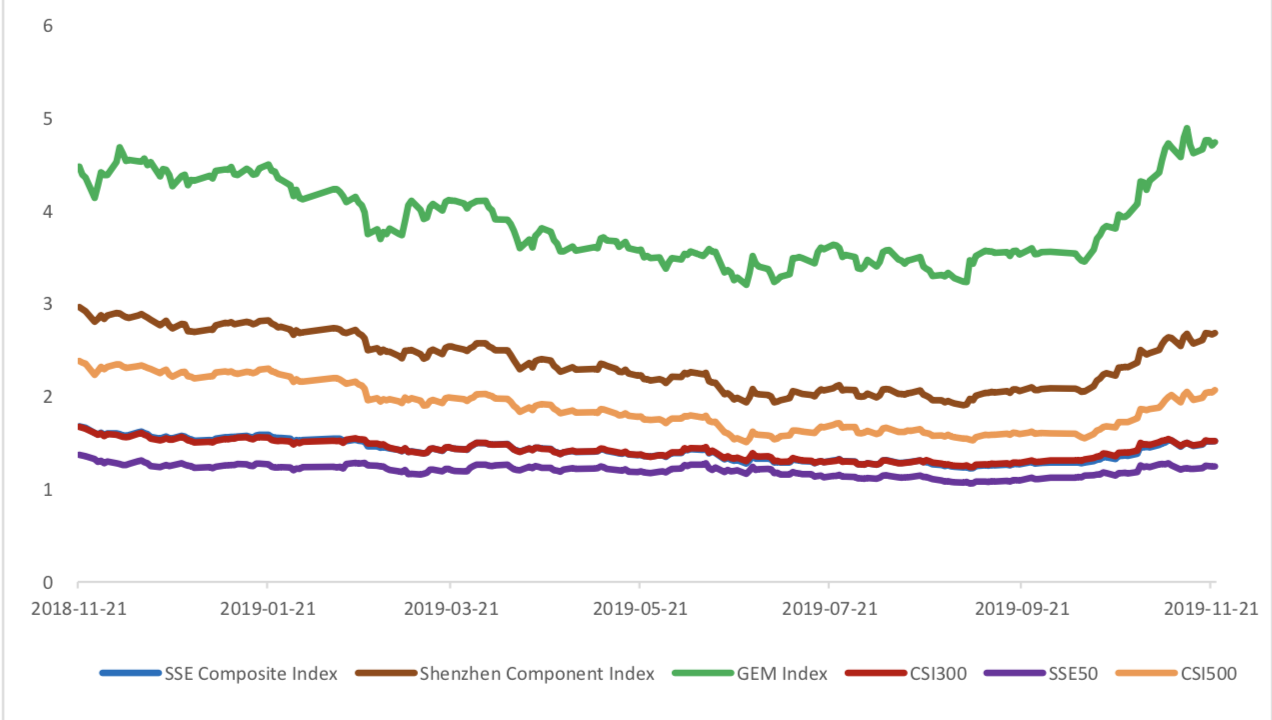
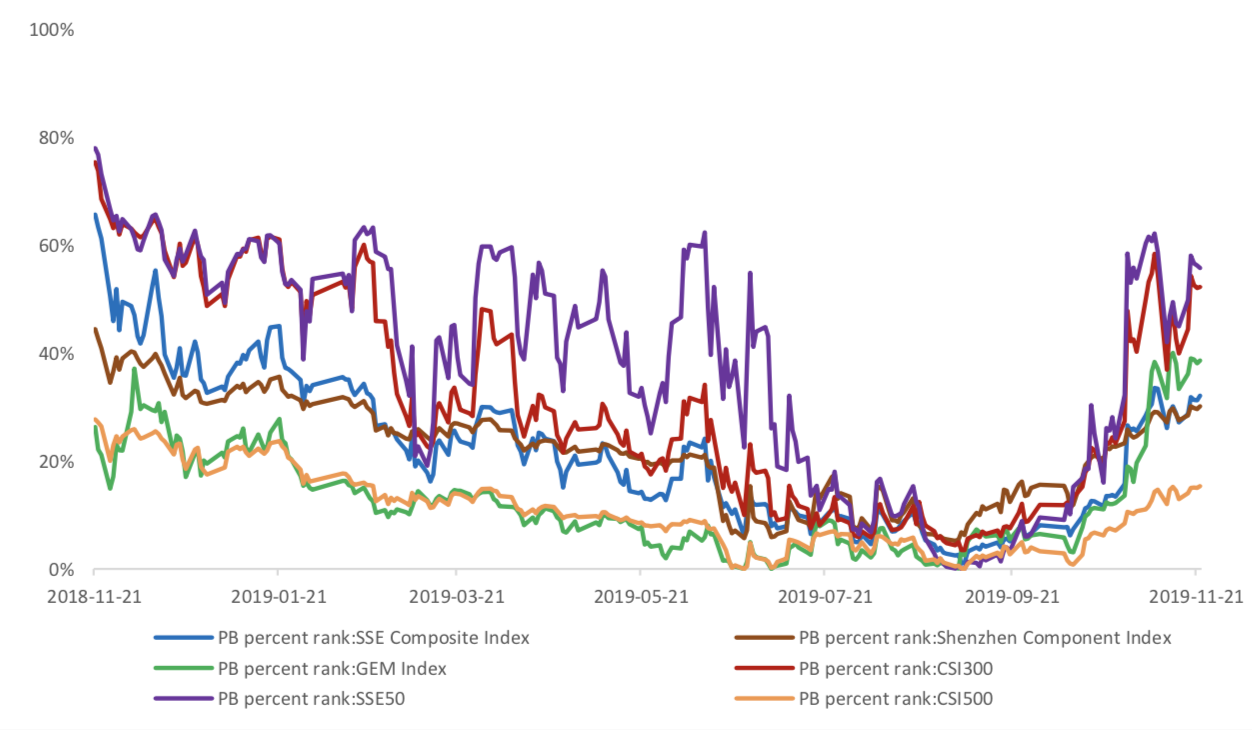
The current PB for SSE Composite Index, Shenzhen Component Index, GEM Index, CSI300, SSE50, CSI500 are 1.5185,2.6827,4.7397,1.5190,1.2443, 2.0682respectively, and these indices are at 32.10%, 30.10%, 38.60%, 52.20%, 55.70%, 15.30% percent rank level of their historic data, respectively.
Graph 6: PB of 6 indices
Graph 7: PB percent rank of 6 indices (calculated by data of past 1200 trading days, only 1Y data is presented on the graph)
(4) Foreign Fund Flow
Last week, there were 5 trading days for northward channel open for stock connect programs. During last week the total foreign fund flow via Stock Connect is 5.75 billion RMB, and the cumulative inflows was 888.59 billion RMB. Specifically, the fund flow via Shanghai-Hong Kong Stock Connect is -0.99 billion RMB and the fund flow via Shenzhen-Hong Kong Stock Connect is 6.74 billion RMB.
Graph 8: Fund flow via both Shanghai and Shenzhen-Hong Kong Stock Connect in past 1M (100 million CNY)

Graph 9: Fund flow via Shenzhen-Hong Kong Stock Connect in past 1M (100 million CNY)

Graph 10: Fund flow via both Shanghai-Hong Kong Stock Connect in past 1M (100 million CNY)

2. Index Futures
(1) Trading Volume and Open Interests
During past 5 trading days the average trading volume for CSI300(IF), SSE50(IH), CSI500(IC) contracts
are 67332 (-22.52%, the previous 5-trading day period),25290 (-24.52%),70920 (-22.31%) lots, respectively. On the last trading day, the total open interests for them are 123386 (13.44%),63233 (12.25%),177650 (12.67%) lots respectively.
Graph 11: CSI300 Index futures’ trading volume

Graph 12: CSI300 Index futures’ open interests

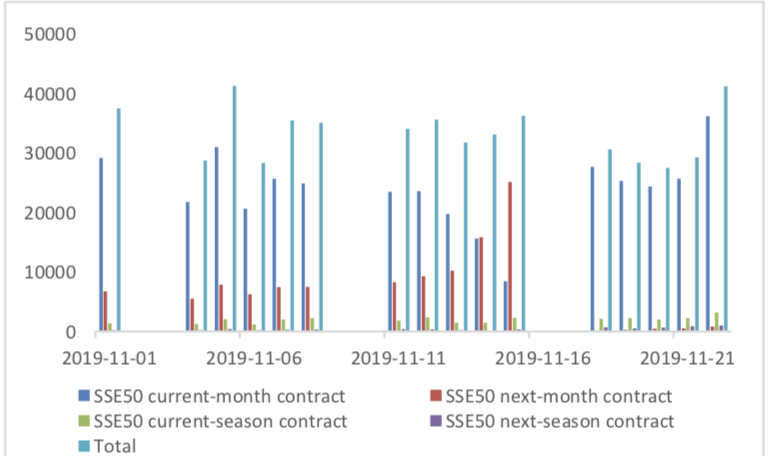
Graph 13:SSE50 Index futures’ trading volume
Graph 14: SSE50 Index futures’ open interests

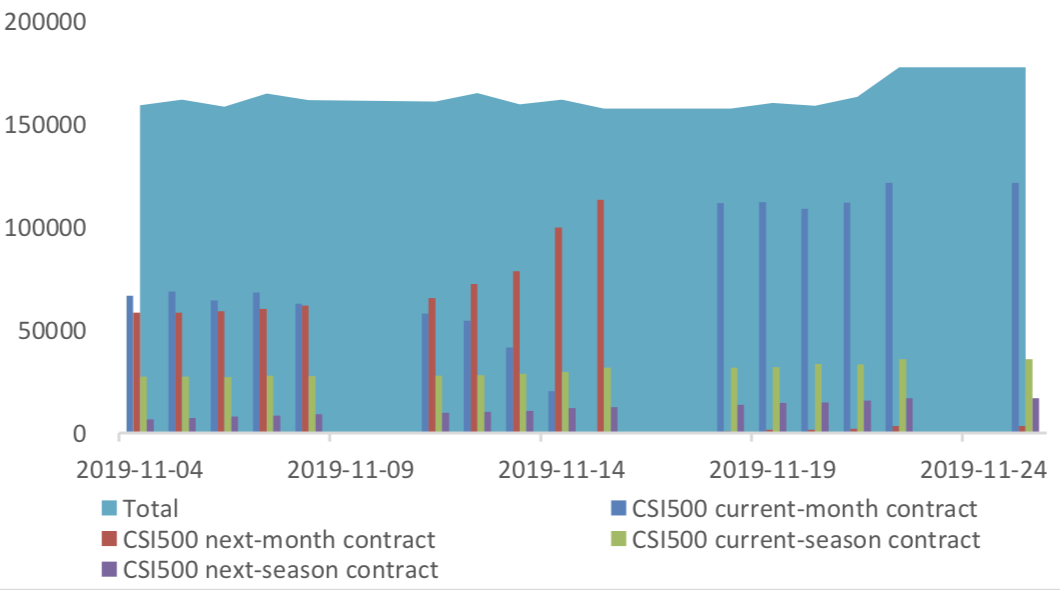
Graph 15: CSI500 Index futures’ trading volume

Graph 16: CSI500 Index futures’ open interests
(2) Roll Level Bid-Ask Distribution
There are 5 trading days during last week, so the distribution is worked out with 36005 data points for each contract pair.
Graph 17: CSI300 Current/Next Month Contract Roll Spread Distribution (2s frequency)

Graph 18: SSE50 Current/Next Month Contract Roll Spread Distribution (2s frequency)

Graph 19: CSI500 Current/Next Month Contract Roll Spread Distribution (2s frequency)

(3) Weekly Review of Future/Spot Arbitrage Opportunity
Assumption: risk-free rate: 3%; security borrowing cost: 8%; trading expense for spot: 0.025%; trading expense for futures: 0.005%; margin rates for futures contracts: 0.11 for CSI300 and SSE50, 0.13 for CSI500; margin rate for security borrowing: 0.3 (or 130% maintain rate).
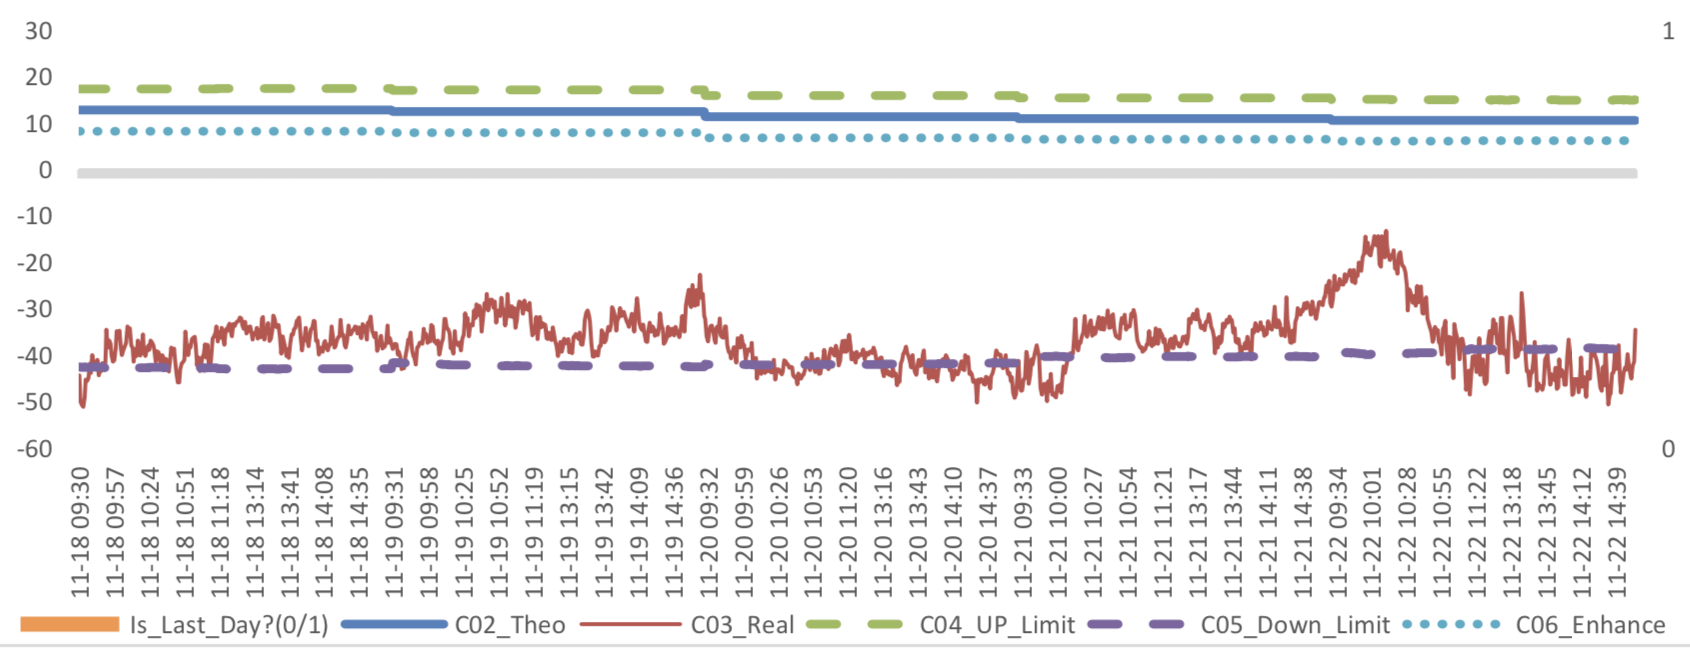
When real price spread is out of theoretical range (calculated by our assumption), there exists absolute future-spot arbitrage opportunity.
Graph 20: Future (Current Month)-Spot Arbitrage Opportunity for CSI300 contract (in the view of price difference)

Graph 21: Future (Current Month)-Spot Arbitrage Opportunity for SSE50 contract (in the view of price difference)
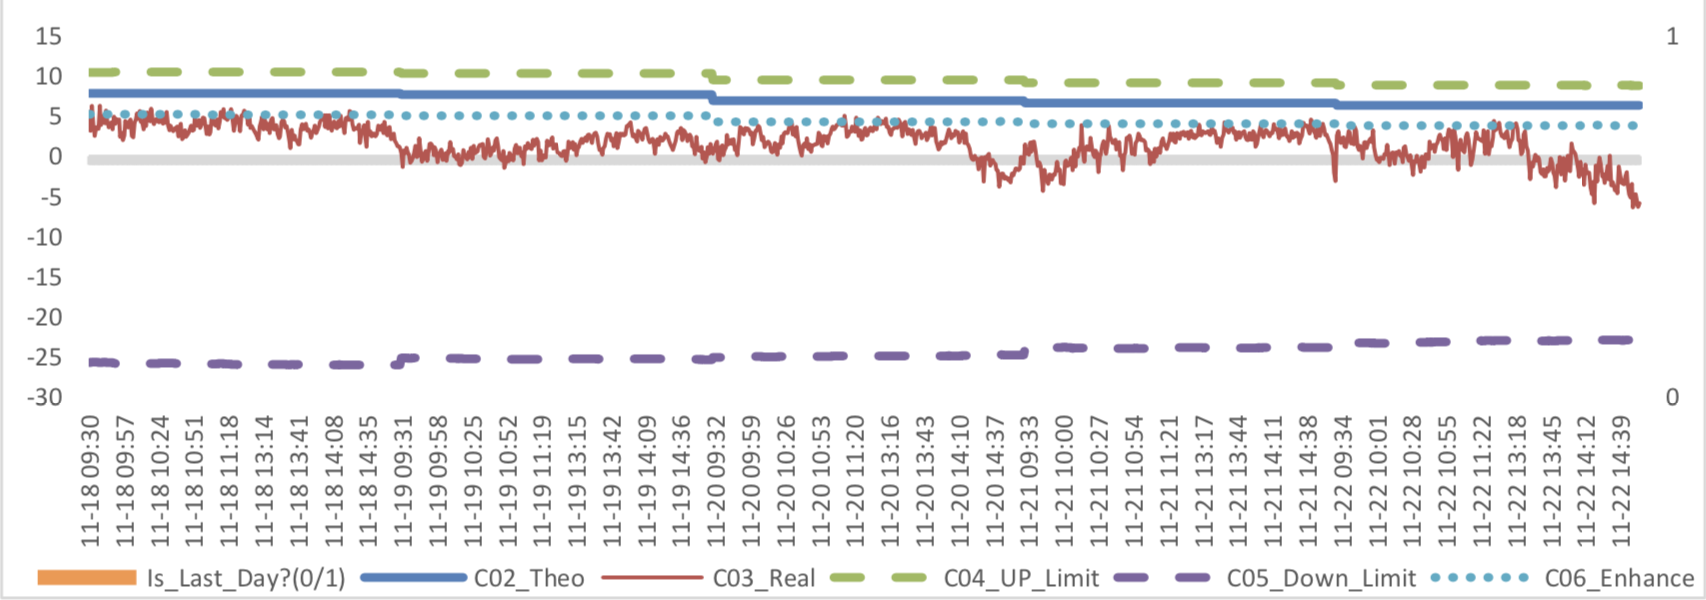
Graph 22: Future (Current Month)-Spot Arbitrage Opportunity for CSI500 contract (in the view of price difference)
Graph 23: Future (Next Month-Current Month) Arbitrage Opportunity for CSI300 contract (in the view of price difference)

Graph 24: Future (Next Month-Current Month) Arbitrage Opportunity for SSE50 contract (in the view of price difference)

Graph 25: Future (Next Month-Current Month) Arbitrage Opportunity for CSI500 contract (in the view of price
difference)
(4) Roll Spread of Stock Index Futures Tracking
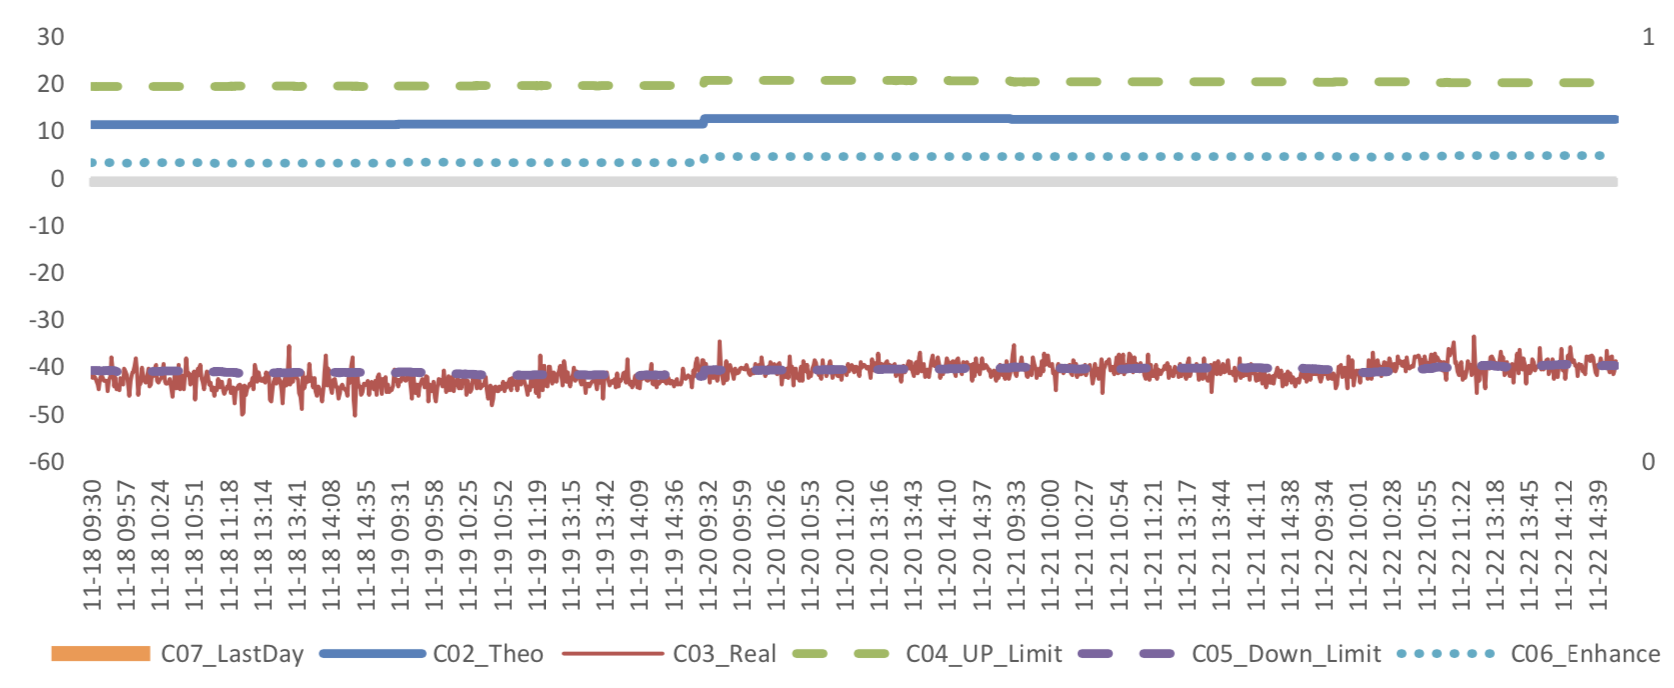
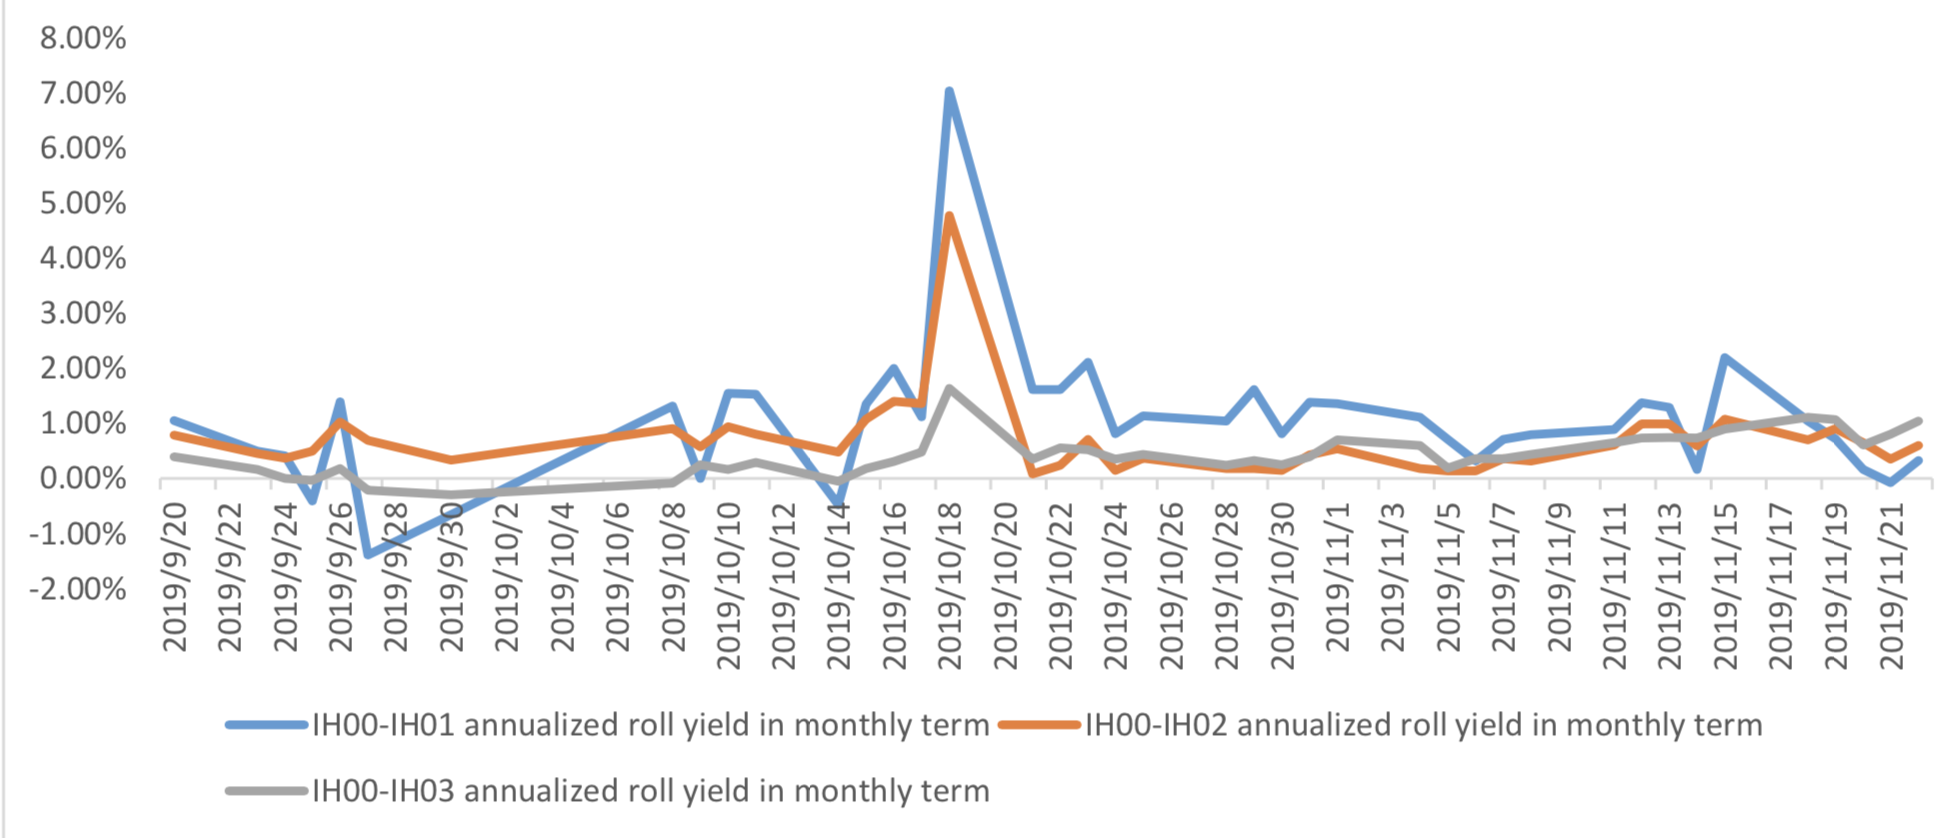
Calculated as the contract price of the current month minus the contract price of the following month, for the long roll, the positive calculation results are gains, the negative calculation results are losses. Code 00 in the figure represents the current month contract, 01 the next month contract, 02 the current quarter contract, 03 the next quarter contract.
(a)IF
Up to2019/11/22,the best roll plan is IF00-IF03,annualized roll yield in monthly term is 1.37%。
Graph 26: IF Current month contract roll yield comparison (index point)

Graph 27: IF Current month contract roll yield comparison (annualized return)

(b)IH
Up to 2019/11/22,the best roll plan is IH00-IH03,annualized roll yield in monthly term is 1.04%。
Graph 28: IH Current month contract roll yield comparison (index point)

Graph 29: IH Current month contract roll yield comparison (annualized return)
(c)IC
Up to2019/11/22,the best roll plan isIC00-IC01,annualized roll yield in monthly term is9.69%。
Graph 30: IC Current month contract roll yield comparison (index point)

Graph 31: IC Current month contract roll yield comparison (annualized return)

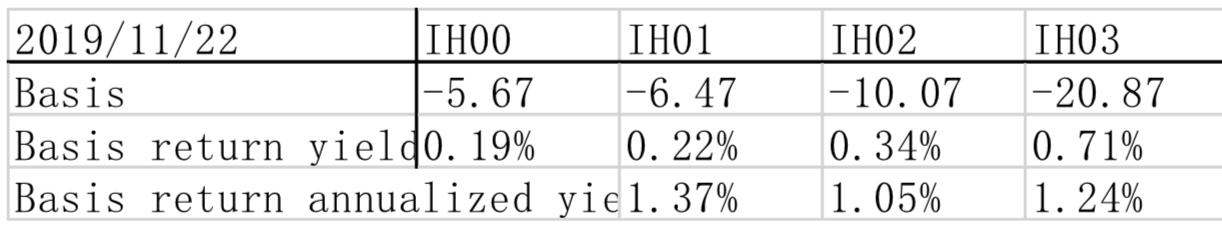
(5) Basis Tracking of Stock Index Futures
For long side, if the base difference is positive, the change of the base difference brings losses, and if the base difference is negative, the change of the base difference brings profits.
(a)IF
For long side hedge, up to 2019/11/22,all IF contracts were in discount. Here IF next month contract basis return annualized yield is 1.97%。
Graph 32: IF contracts basis

Table 1: IF basis return calculation

(b)IH
For long side hedge, up to 2019/11/22,all IH contracts were in discount. Here IH next month
contract basis return annualized yield is 1.37%。
Graph 33: IH contracts basis

Table 2: IH basis return calculation
(c)IC
For long side hedge, up to 2019/11/22,all IC contracts were in discount.. Here IC next month
contract basis return annualized yield is 11.48%。
Graph 34: IC contracts basis

Table 3: IC basis return calculation

3. Financial Markets
(1) Interest Rates
The term structure of treasury bonds’ yields is currently upward sloping in concave shape.
Specifically, last week, short-term yields short term yield of Treasury bond experienced some fluctuation and 3M yield now at 2.4%-2.6% level. Furthermore, as for long-term yield, there is a small drop. 10Y yield is about 3.2%-3.4%.
Graph 35: Term Structure Evolvement of Treasury Bonds Yields During Recent 3 Months (%)

As for Shibor rates, short-term rates experienced significant fluctuation. Specifically, O/N rate experienced obvious fluctuation to 2.6%-2.8% level.
Graph 36: Term Structure Evolvement of Shibor Rates During Recent 3 Months (%)

(2) ExchangeRates
During last week, CNY/USD changed 0.334% to 7.0356 and offshore rate, CNH/USD, changed 0.24% to 7.0426 and USD index changed 0.47%.
Graph 37: USD/CNY, USD/CNH and USD Index

Macroeconomic Topic:
Data released by the National Bureau of Statistics show that in October, the added value of industries above scale increased by 4.7% in terms of monthly year-on-year ratio, with the pre-value of 5.8%; in January-October, the national fixed assets investment increased by 5.2% in nominal terms, with pre-value of 5.4%; and in October, the total retail sales of consumer goods increased by 7.2% in terms of monthly year- on-year ratio, with pre-value of 7.8%.
October Economic Data
(1) Fixed Assets Investment
From January to October, the cumulative growth rate of fixed assets investment was 5.2% year-on-year, show a slow dropping trend. From the structural point of view, the growth rate of real estate investment has slightly decreased, manufacturing investment has slightly increased, and infrastructure investment has slightly decreased.
Graph A: Investment Completion of Fixed Assets (100m RMB)

Graph B: Investment Completion of Real Estate Development, Manufacturing Industry, Infrastructure Construction

From January to October, investment in infrastructure (excluding electricity) increased by 4.2% year- on-year, with pre-value of 4.5%.
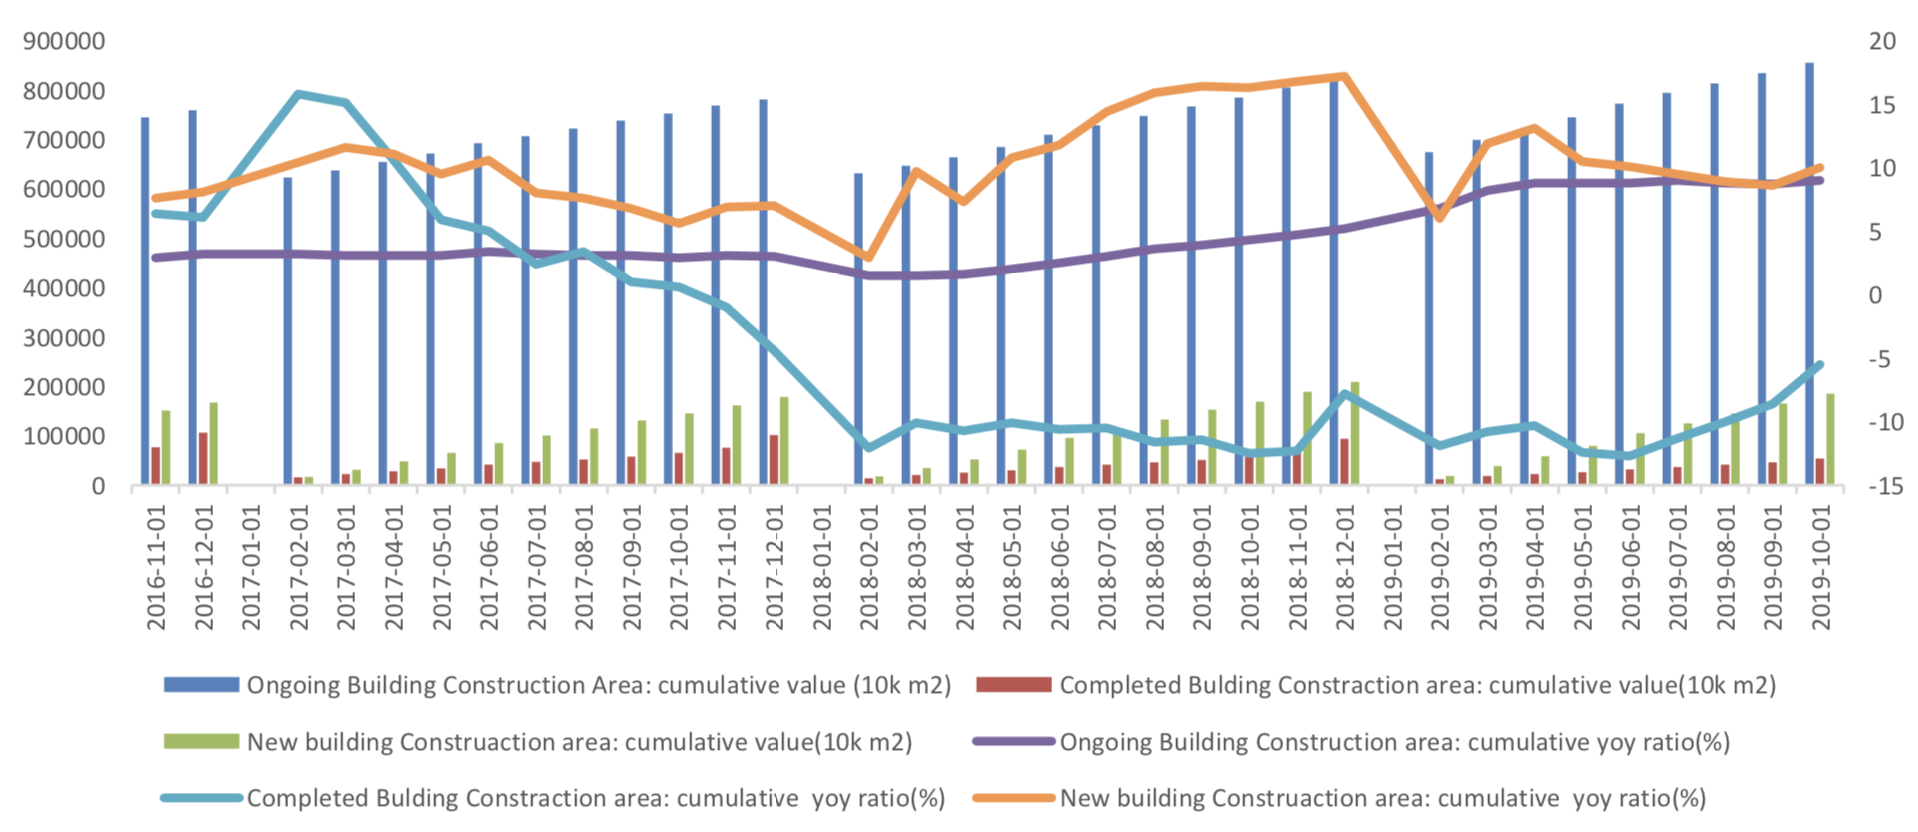
From January to October real estate investment increased by 10.3% year-on-year, 0.2 percentage points slower than the previous value, showed a drop trend. In October, the growth rate of new housing construction area increased. From January to October, the cumulative growth rate was 10% year-on-year, which was higher than the previous value of 8.6%.
Graph C: Build Construction Data
From January to October, manufacturing investment increased by 2.6% year-on-year, and the growth rate increased by 0.1 percentage points compared with the previous value.
Private investment completion of fixed assets decreased. From January to October, the cumulative growth rate of private fixed assets investment was 4.4% year-on-year, which was 0.3 percentage points lower than the previous period.
Graph D: Private Investment Completion of Fixed Assets

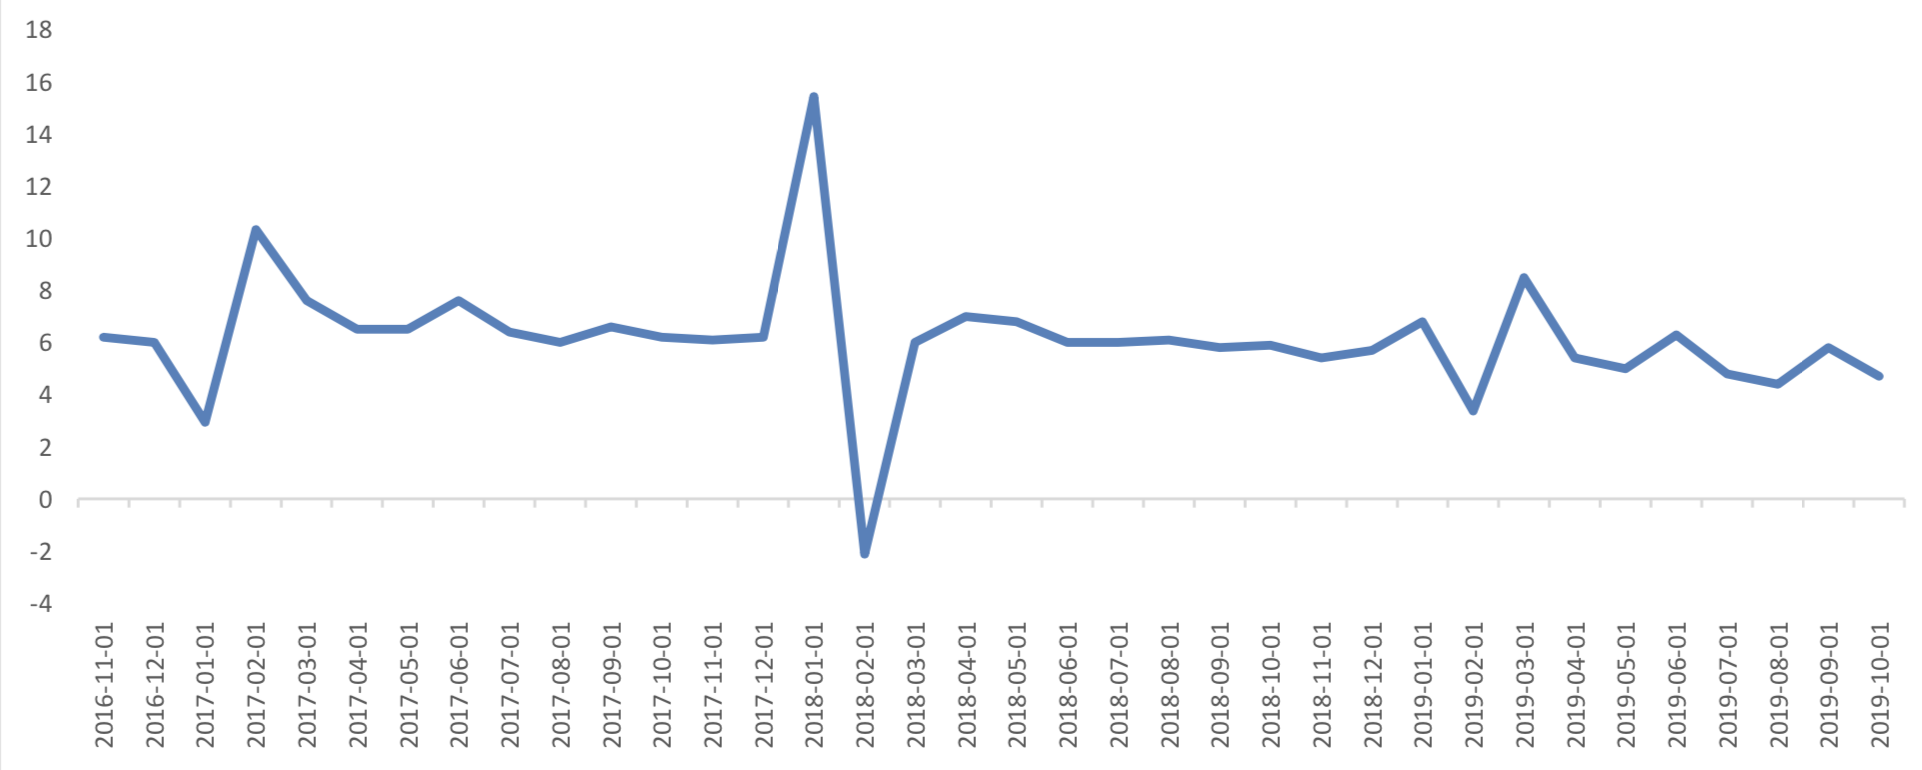
(2) Industrial Value Added
In October, the value added of industries above the designated size increased by 4.7% year on year, and the growth rate dropped by 1.1 percentage points compared with the previous month.
Graph E: Industrial added value above designated size: Monthly YoY Ratio (%)
In terms of the 4 categories, all of them dropped. The value added of mining industry in October increased by 3.9% year on year, and the growth rate dropped by 4.2 percentage points compared with the previous month, which had a great drag on the growth rate of industrial production in that month; the manufacturing industry decreased to 4.6% and drop by 1 percentage points; the production and supply of electricity, heat, gas and water increased to 6.6% and rose by 0.7 percentage points compared with the previous month. The value added of high-tech industry in October increased by 8.3% year on year, the growth rate decreased by 2.7 percentage points compared with the previous month, another drag force.
Graph F: Industrial added value above designated size: by industry categories
(3) Consumption
In October, the nominal growth rate of total retail sales of social consumer goods dropped to 7.2% from 7.8% last month, while the cumulative growth rate in January-October slowed by 0.1 percentage points to 8.1% compared with the previous value.
Graph G:Total Retail Sales of Consumer Goods

(1) Monetary Data
In October, M2 kept 8.4%, and M1 dropped from 3.4% to 3.3%, and the difference between M2 and M1 increase from 5% to 5.1%.
Graph H: M1 and M2 data

(3) Summary
In October, the scale of social financing fell, and the long holiday was a factor According to historical data, October is a low point due to long holiday. The proportion of new RMB loans increased with the decrease of new local debts and new off balance sheet businesses.
Currently no Comments.
Hot Topics
The 13rd China International Future Forum
The Shanghai Derivatives Energy Forum has received extensive attention from relevant industries both within and outside the borders.
Financial institutions deep explore commodity market opportunities, commodity index financial products show full-scale trend
R-Code for analysis: getKDJ
R-Code@June 06, 2016
New indicator to analyze the arbitrage opportunities between sse50 and csi500
Market review: January 11, 2017
The Great China Bubble: Anniversary Lessons and Outlook
Quant Investment in China A-share market
The hedge strategy between SSE50 and A50--Jan 13,2017
The arbitraging strategy between CSI300 and SSE50
Market review: June 17, 2016
Sleepless in London--Enda Homan(Allied Irish Banks Plc)
MSCI Rebuffs Chinese Equities for Third Time in Blow to Xi
Soros, Druckenmiller among hedgies profiting in market plunge