FangQuant › Financial Futures
Market Summary:
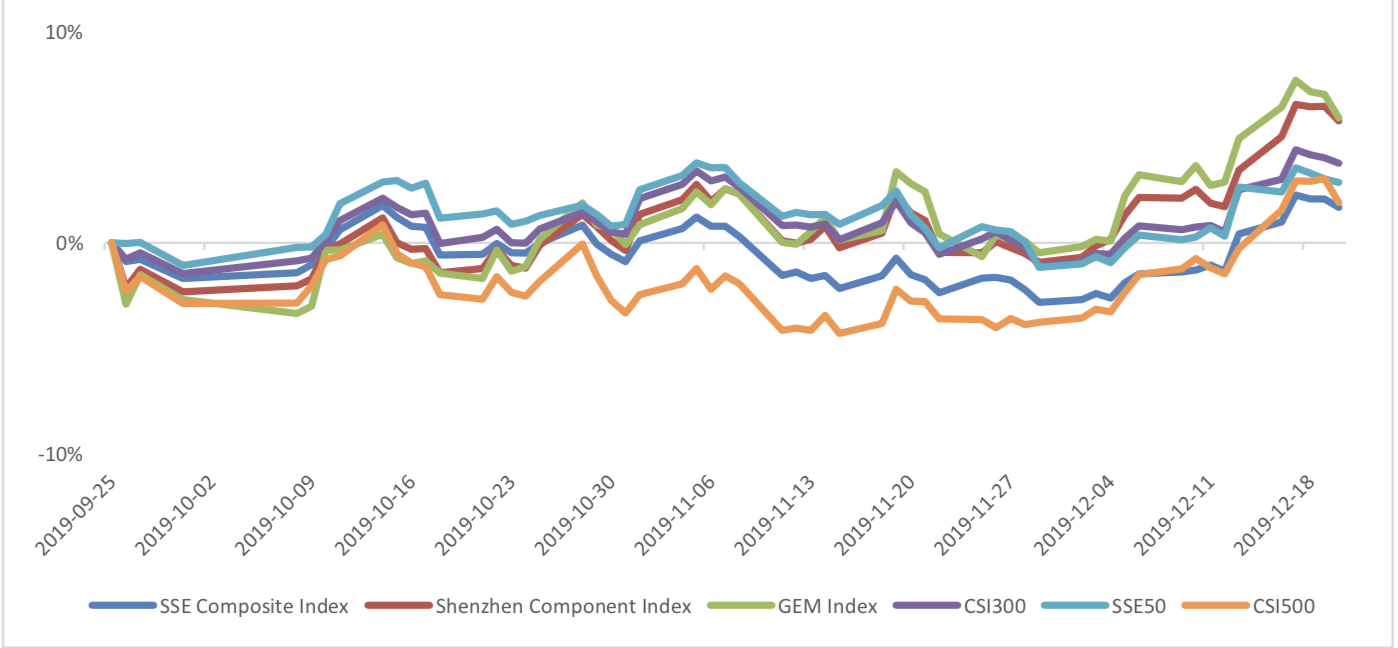
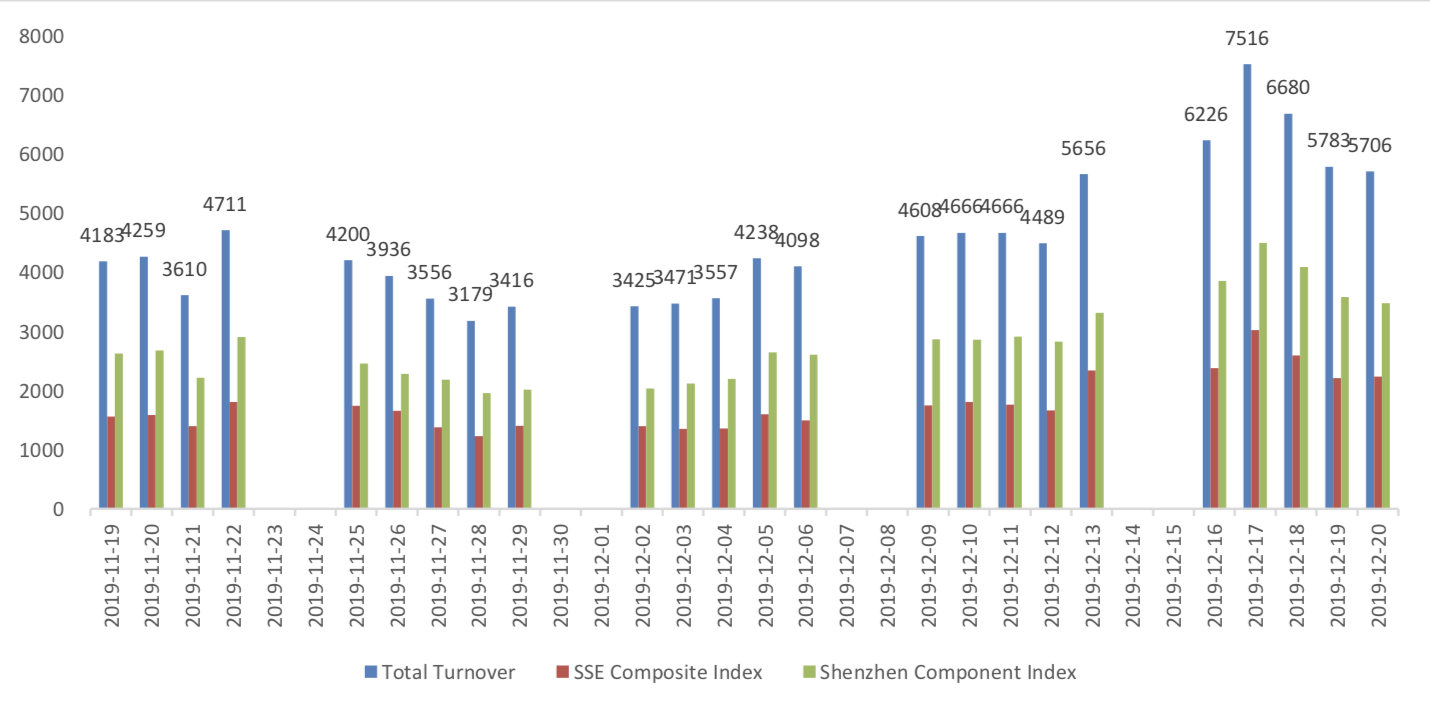
Last week, there was generally increase over the market. Shanghai SE Composite Index (000001.SH) changed 1.26 % to 3004.94. Specifically, small cap shares perform better than large cap shares and we can observe that CSI500 did better than SSE50 (2.19% vs 0.21%). The average daily turnover of the whole market during past 5 trading days is 638.22 billion CNY, it increased 32.49% compared with the previous 5-trading day period.
The three major domestic exchanges will usher in a new option product collectively on December 23. Shanghai Stock Exchange and Shenzhen Stock Exchange will list CSI300 ETF options contract (510300 and 159919, respectively); CFFEX will list CSI 300stock index option listed transaction. This will have obvious meaning in the marketing, creating another effective tools for risk management by covering a major representative stock index. This will bring more long-term fund to stock market.
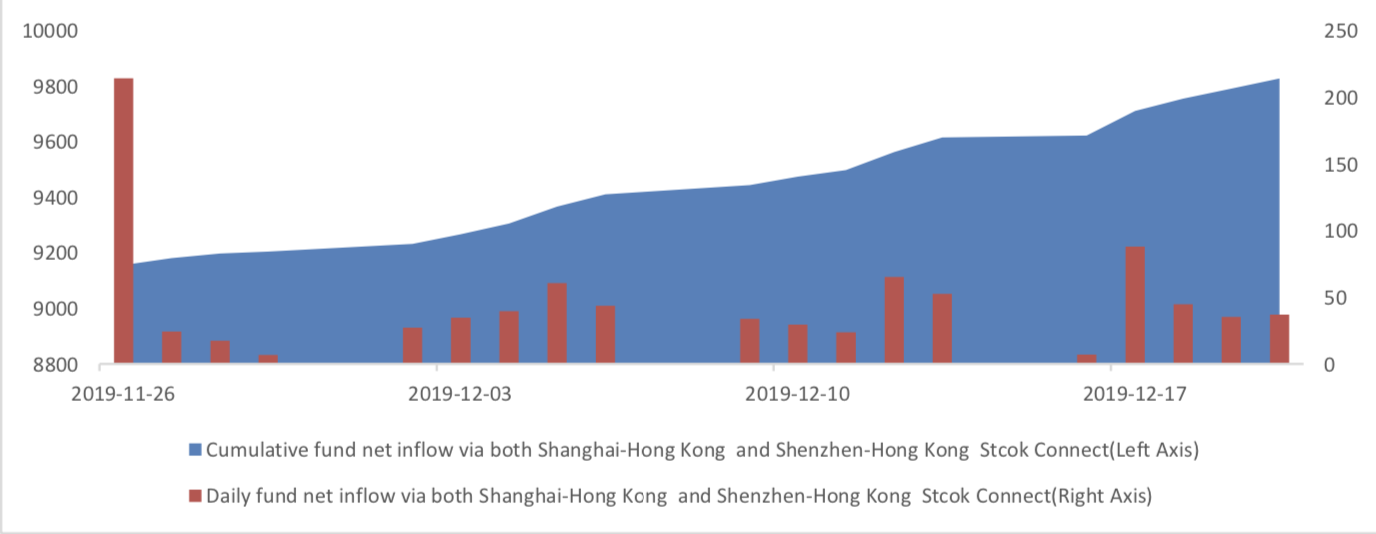
Foreign funds kept flowing in A-shares. During last week the total foreign fund flow via Stock Connect is 21.24 billion RMB, and the cumulative inflows was 982.78 billion RMB, creating a new high.
As for arbitrage opportunity, all futures current-month contracts show some room for arbitrage opportunities. No price spread for next-month/current month contracts show room for arbitrage.
News:
(1)Wind:The meeting of directors of the National Agriculture Rural Department was held in Beijing. It is required to complete the task of stable production and supply of pigs, and do everything possible to increase the supply and do a good job of regulation. Make every effort to ensure the New Year's Day Spring Festival meat market supply, and do everything possible to promote the recovery of pig production. Level, and at the same time, do our best to prevent and control African swine fever.
(2)China economic weekly :Huang Qifan, Vice Chairman of China International Economic Exchange Center, delivered a keynote speech at the "18th China Economic Forum". Huang Qifan believes that the supply-side reform is a structural reform and a long-term economic development of power. The opening of foreign financial institutions, the settlement of migrant workers in urban, and the retirement age of women in YanZ hang County are expected to bring trillion-level dividends.
(3) Chen Zhaoxiong, Deputy Minister of MIIT: vigorously develop the digital economics, focus on promoting the deep integration of Information and communication technology with physical economics, based on the physical economic main battlefield, steadily promote 5G commercial deployment, and strengthen new types of infrastructure construction such as artificial intelligence, industry the Internet, and Internet of Things To promote the optimization and upgrade of the traditional The internet infrastructure; deepen the development of the integration of the Internet, Big Data, artificial intelligence and physical economics.
(4)China Securities Net: Mu Zhang Chun, director of Central Bank digital currency research institute, said that the digital RMB of Central Bank Research and Development is not a crypto asset as understood by us, but Digitizing of RMB. At present, the Central Bank digital currency DCEP has basically completed the top- level design, typical formulation, functional research and development, and joint testing. The next step will be to continuously optimize and enrich the DCEP functions, and steadily promote the launch of the application of legal currency in the form of Digitizing.
(5)Tencent: The "2019 China game industry report" was officially released. According to the report's preliminary statistics, the actual sales revenue of the China game industry for the year reached 230.8 billion yuan, a year-on-year increase of 7.7%, and then the innovation was high. Driven by the new technology, cutting-edge markets such as AR / VR and cloud gaming will usher in new opportunities for rapid growth.
(6)Wind:The "Settlement Reserve Management Measures" has been revised to reduce the minimum Settlement Reserve collection rate for stock businesses to 18%. The adjustment involves nearly 300 billion yuan of funds, which can save liquidity of about 26 billion for listed Brokers, which is good for Broker Interest income.
1. StockMarket
(1) Indices Performance
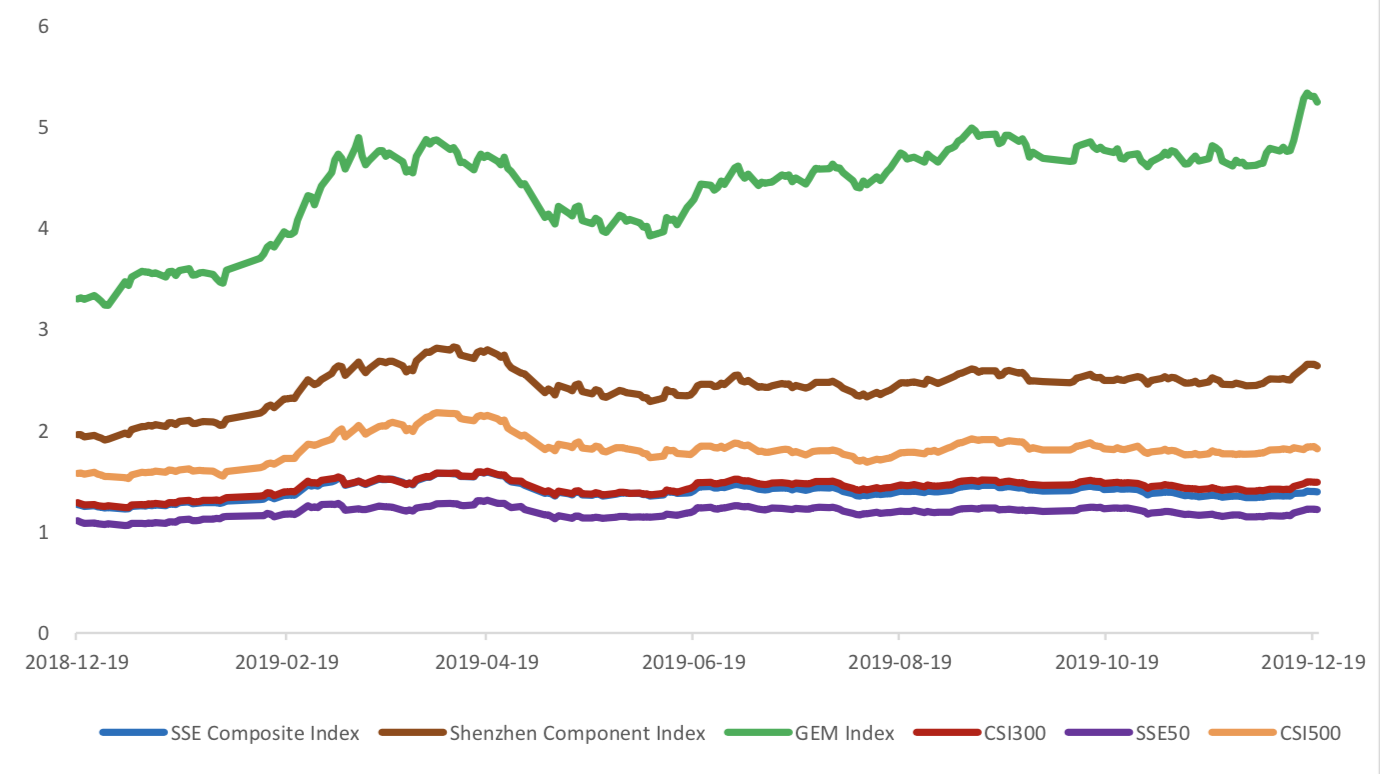
During last week, Shanghai SE Composite Index (000001.SH) changed 1.26 % to 3004.94, Shenzhen Component Index (399001.SZ) changed 2.25 % to 10229.49, ChiNext Price Index (399006.SZ) changed 0.93 % to 1771.71, CSI 300 INDEX (000300.SH) changed 1.24 % to 4017.25, CSI SmallCap 500 index (000905.SH) changed 2.19 % to 5184.68, SSE 50 Index (000016.SH) changed 0.21 % to 3012.63.
Graph 1: Indices Performance over past 3 months
The average daily turnover of the whole market during past 5 trading days is 638.22 billion CNY, it increased 32.49% compared with the previous 5-trading day period.
Graph 2: Market turnover
(2) Sectors Performance
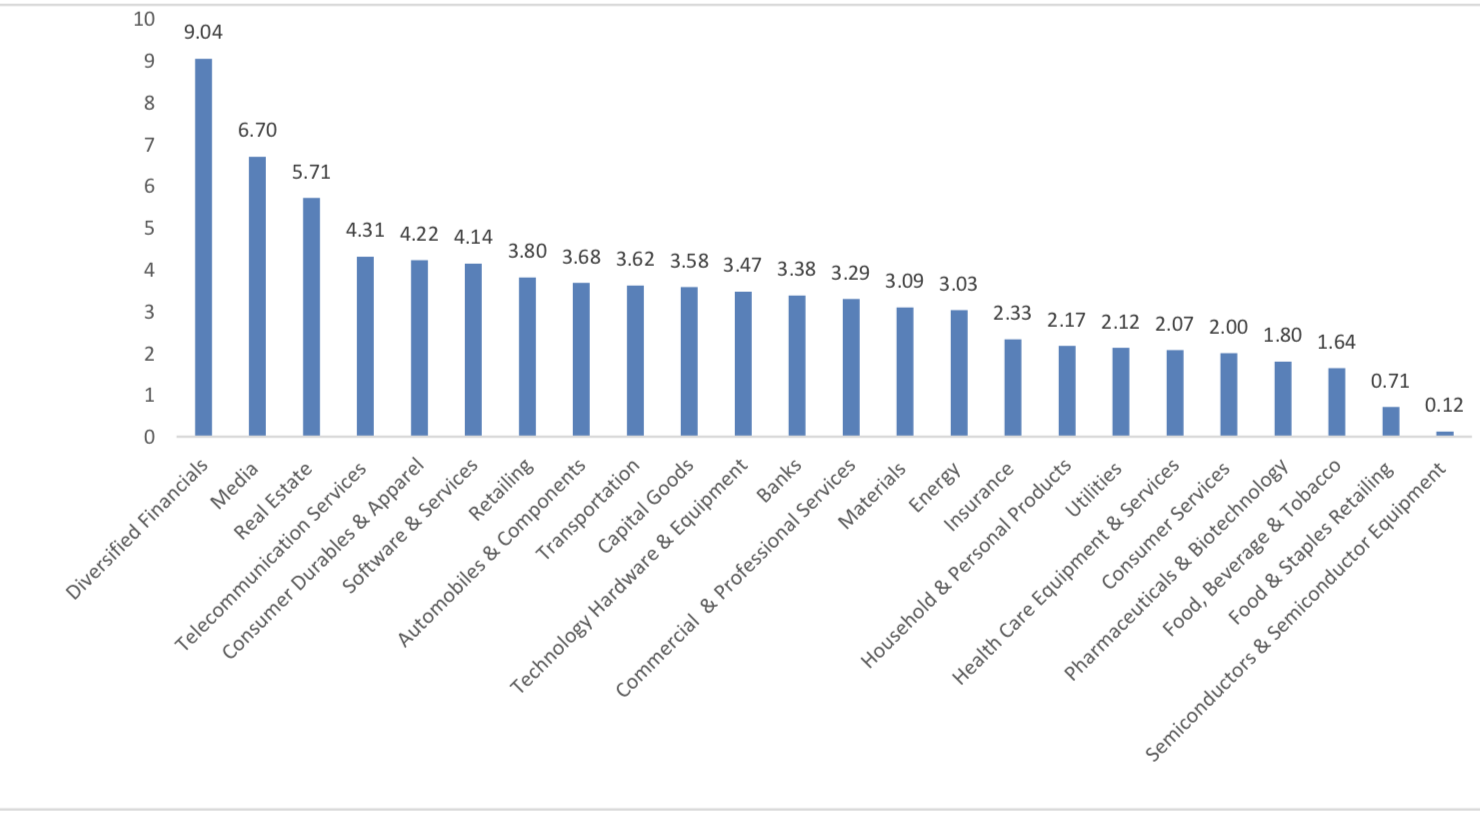
In the view of sectors, during last week (from 2019-12-13 to 2019-12-20), 24 of 24 Wind Level- 2 sector(s) increased while 0 sector(s) dropped. Specifically, Diversified Financials(9.04%), Media (6.70%) and Real Estate (5.71%) did the best performance while Semiconductors & Semiconductor Equipment (0.12%), Food & Staples Retailing (0.71%) and Food, Beverage & Tobacco(1.64%) did the worst performance.
Graph 3: Sectors performance under Wind Level-2 classification (%)
(3) Indices Valuation (TTM)
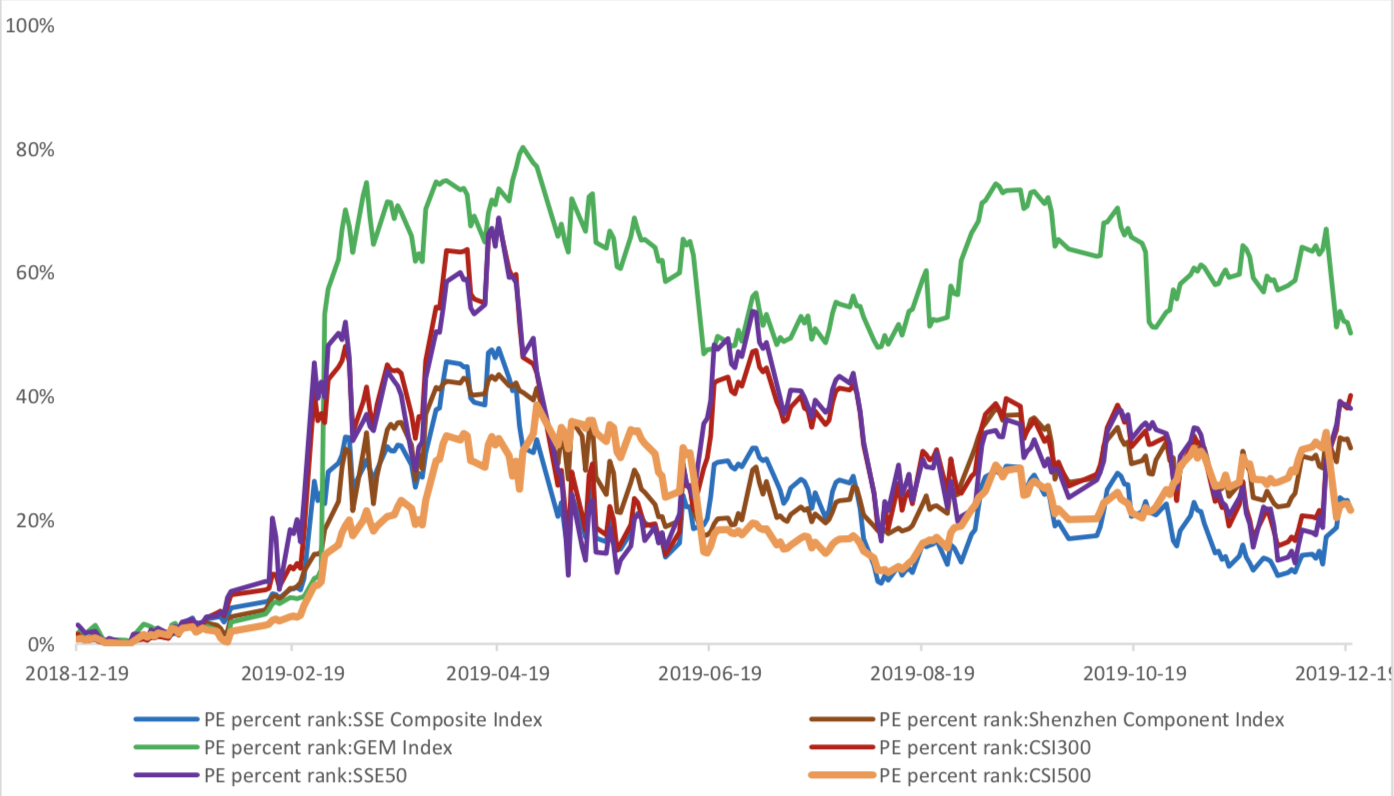
The current PE for SSE Composite Index, Shenzhen Component Index, GEM Index, CSI300, SSE50, CSI500 are 13.0094, 23.9927, 48.9012, 12.3691, 9.8902, 24.5998respectively; and these indices are at 21.70%, 31.60%, 50.20%, 40.10%, 38.00%, 21.60% percent rank level of their historic data, respectively
Graph 4: PE of 6 indices

Graph 5: PE percent rank of 6 indices (calculated by data of past 1200 trading days, only 1Y data is presented on the graph)
The current PB for SSE Composite Index, Shenzhen Component Index, GEM Index, CSI300, SSE50, CSI500 are 1.3934,2.6387,5.2468,1.4882,1.2199, 1.8193respectively, and these indices are at 15.20%, 28.30%, 61.10%, 42.80%, 43.90%, 18.00% percent rank level of their historic data, respectively.
Graph 6: PB of 6 indices
Graph 7: PB percent rank of 6 indices (calculated by data of past 1200 trading days, only 1Y data is presented on the graph)

(4) Foreign Fund Flow
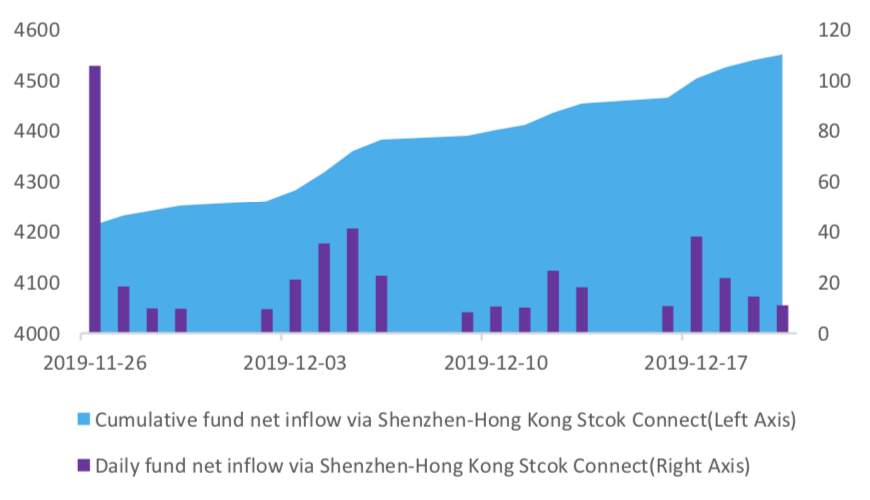
Last week, there were 5 trading days for northward channel open for stock connect programs. During last week the total foreign fund flow via Stock Connect is 21.24 billion RMB, and the cumulative inflows was 982.78 billion RMB. Specifically, the fund flow via Shanghai-Hong Kong Stock Connect is 11.62 billion RMB and the fund flow via Shenzhen-Hong Kong Stock Connect is 9.62 billion RMB.
Graph 8: Fund flow via both Shanghai and Shenzhen-Hong Kong Stock Connect in past 1M (100 million CNY)
Graph 9: Fund flow via Shenzhen-Hong Kong Stock Connect in past 1M (100 million CNY)
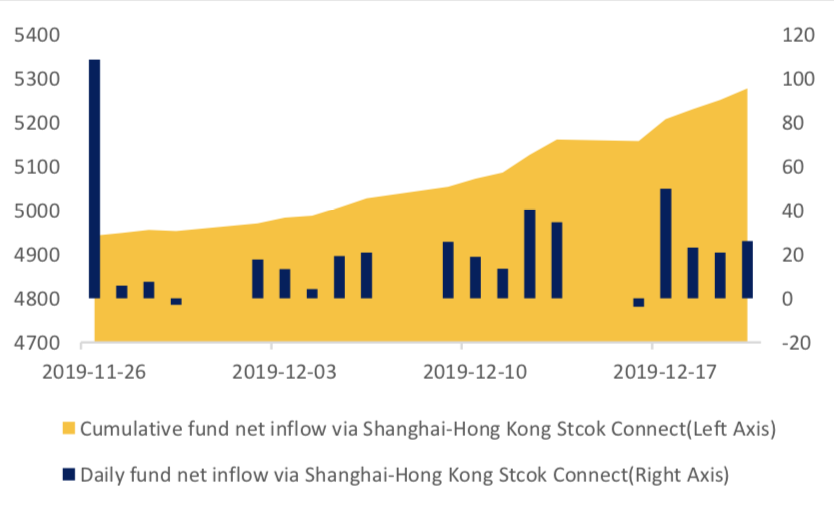
Graph 10: Fund flow via both Shanghai-Hong Kong Stock Connect in past 1M (100 million CNY)
(5) Margin Trading
According to the newest data, the margin financing balance is 967.84 billion, securities borrowing is
13.47 billion, totally 981.31 billion.
Graph 11: Margin Trading(100m RMB)

2. Index Futures
(1) Trading Volume and Open Interests
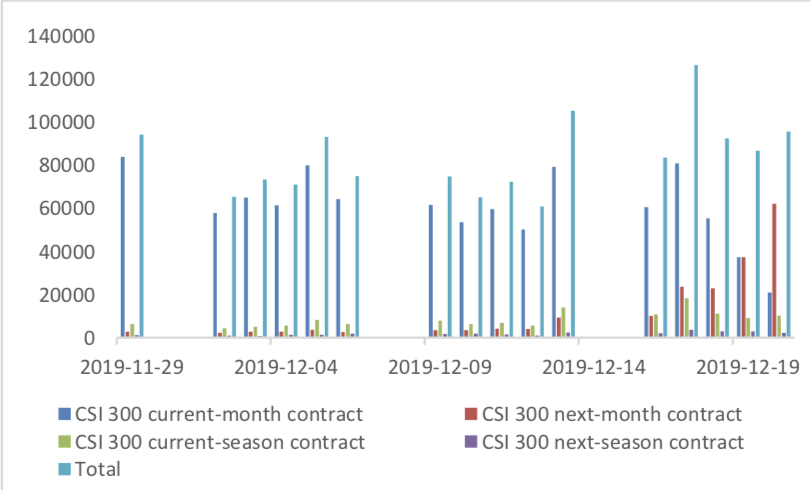
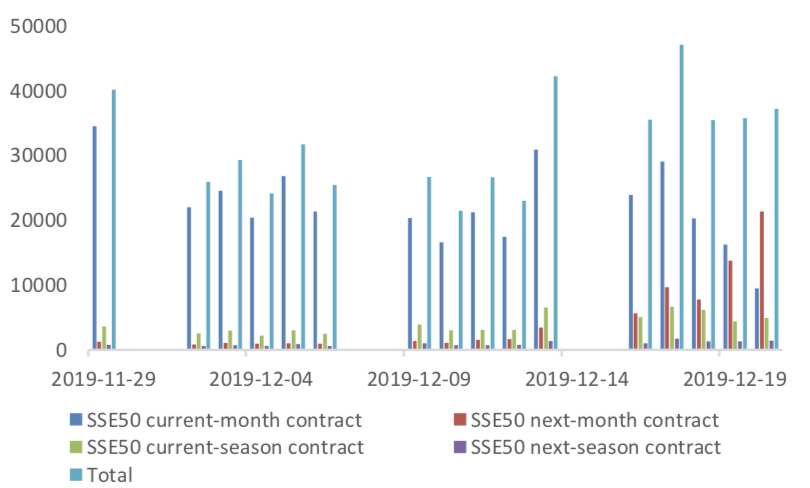
During past 5 trading days the average trading volume for CSI300(IF), SSE50(IH), CSI500(IC) contracts
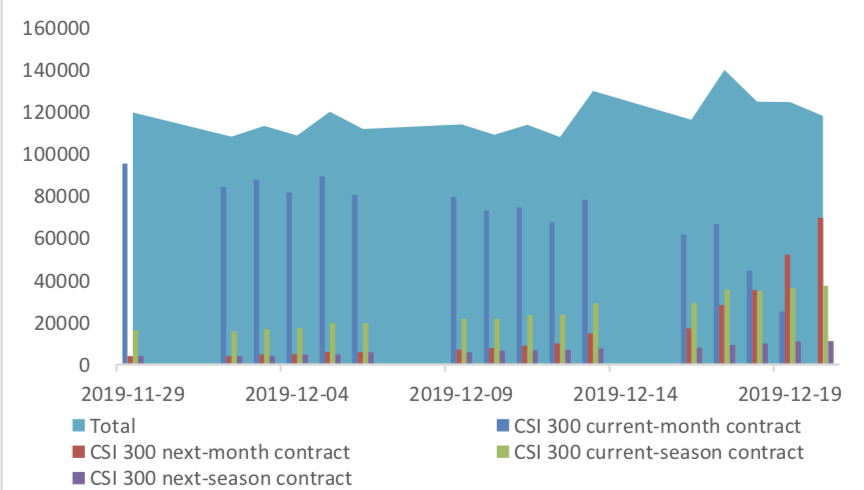
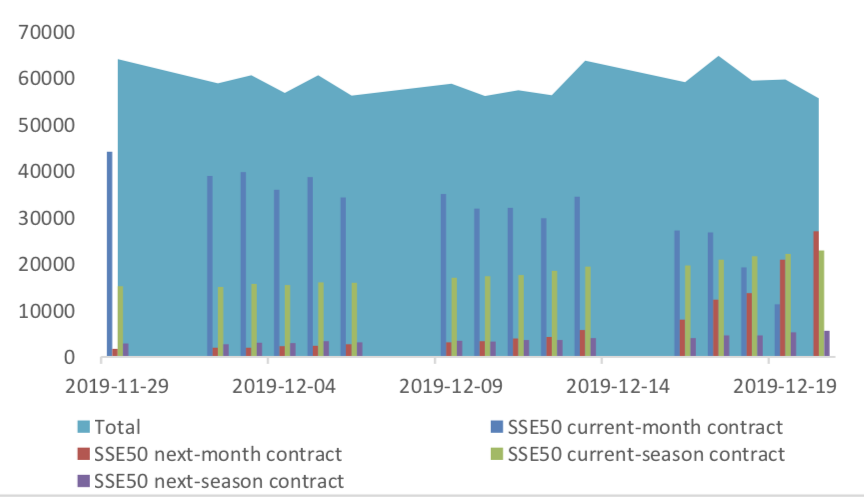
are 96797 (28.13%, the previous 5-trading day period),38119 (36.45%),105821 (21.22%) lots, respectively. On the last trading day, the total open interests for them are 118027 (-9.14%),55654 (-12.68%),169072 (- 4.64%) lots respectively.
Graph 12: CSI300 Index futures’ trading volume
Graph 13: CSI300 Index futures’ open interests
Graph 14:SSE50 Index futures’ trading volume
Graph 15: SSE50 Index futures’ open interests
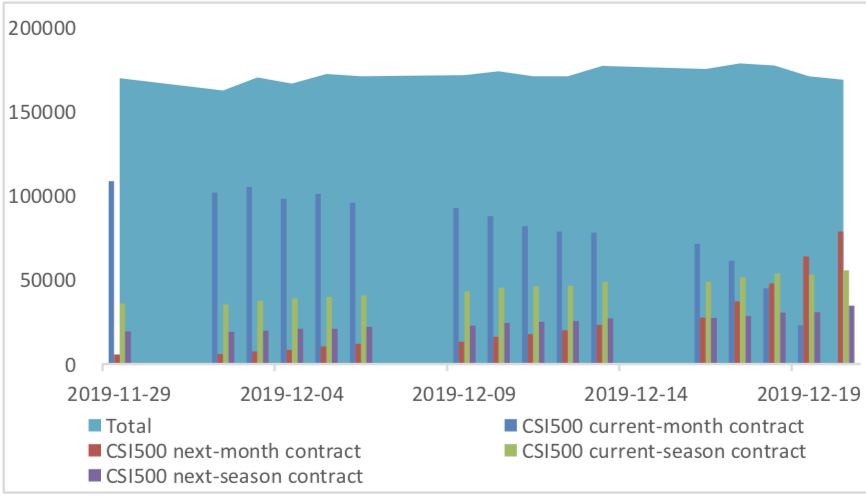
Graph 16: CSI500 Index futures’ trading volume
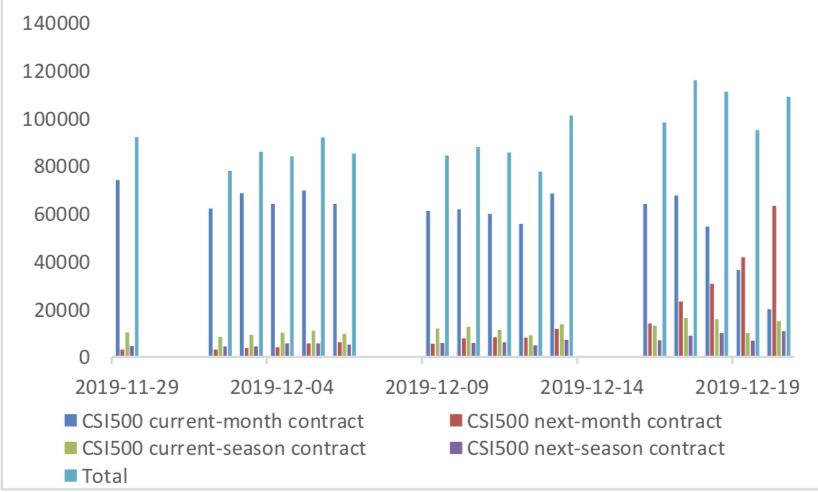
Graph 17: CSI500 Index futures’ open interests
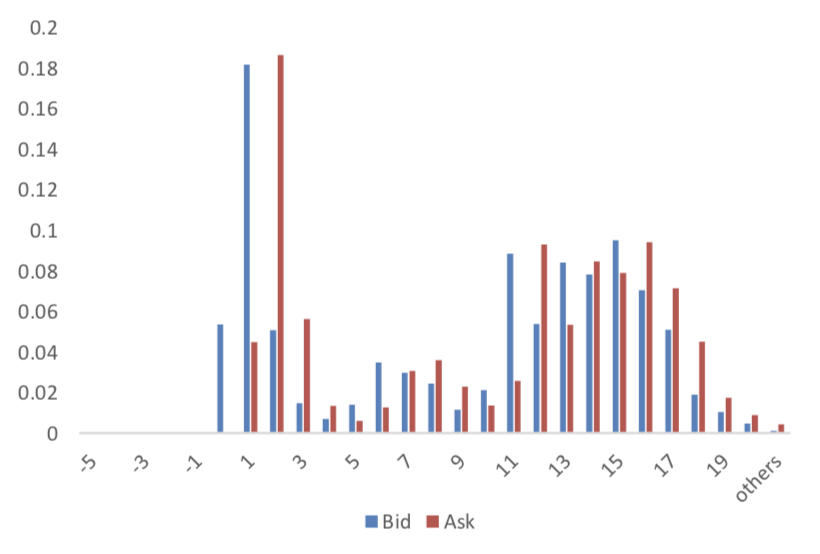
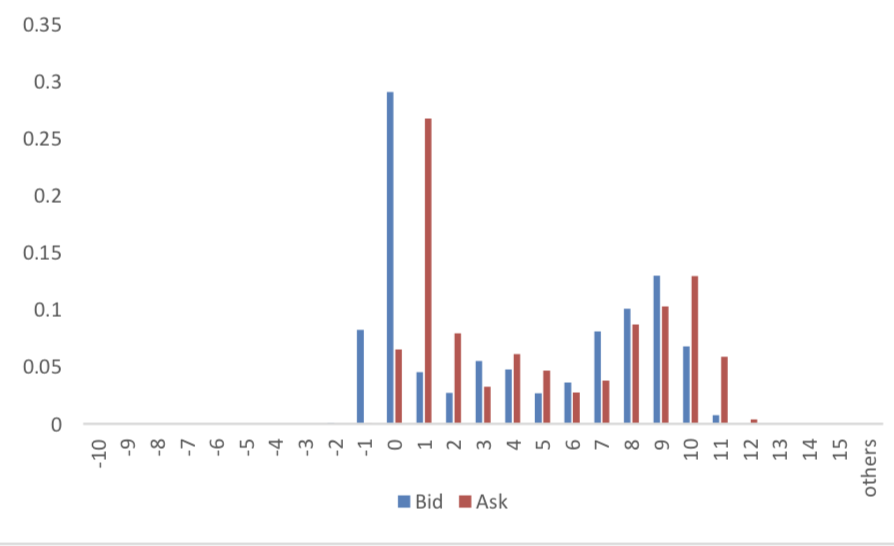
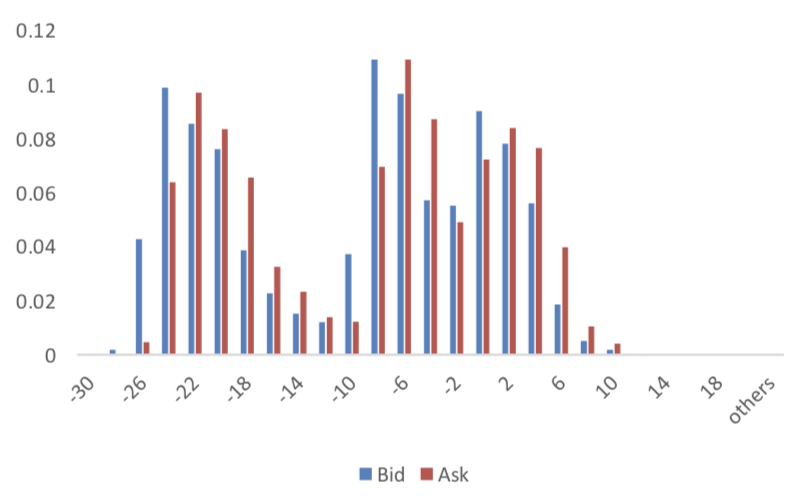
(2) Roll Level Bid-Ask Distribution
There are 5 trading days during last week, so the distribution is worked out with 36005 data points for each contract pair.
Graph 18: CSI300 Current/Next Month Contract Roll Spread Distribution (2s frequency)
Graph 19: SSE50 Current/Next Month Contract Roll Spread Distribution (2s frequency)
Graph 20: CSI500 Current/Next Month Contract Roll Spread Distribution (2s frequency)
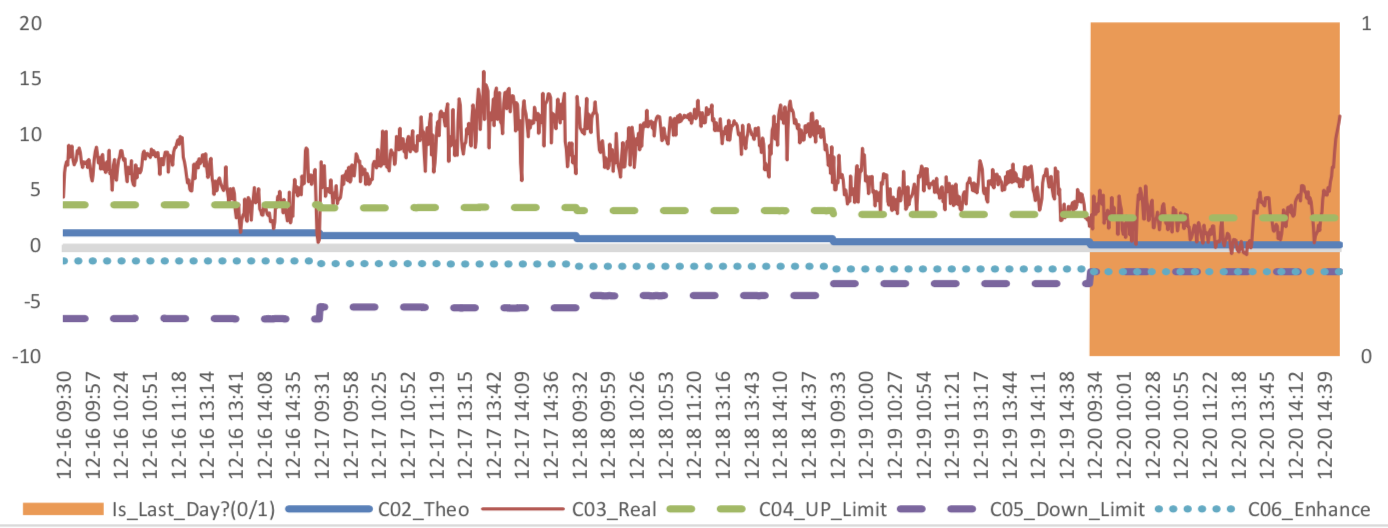
(3) Weekly Review of Future/Spot Arbitrage Opportunity
Assumption: risk-free rate: 3%; security borrowing cost: 8%; trading expense for spot: 0.025%; trading expense for futures: 0.005%; margin rates for futures contracts: 0.11 for CSI300 and SSE50, 0.13 for CSI500; margin rate for security borrowing: 0.3 (or 130% maintain rate).
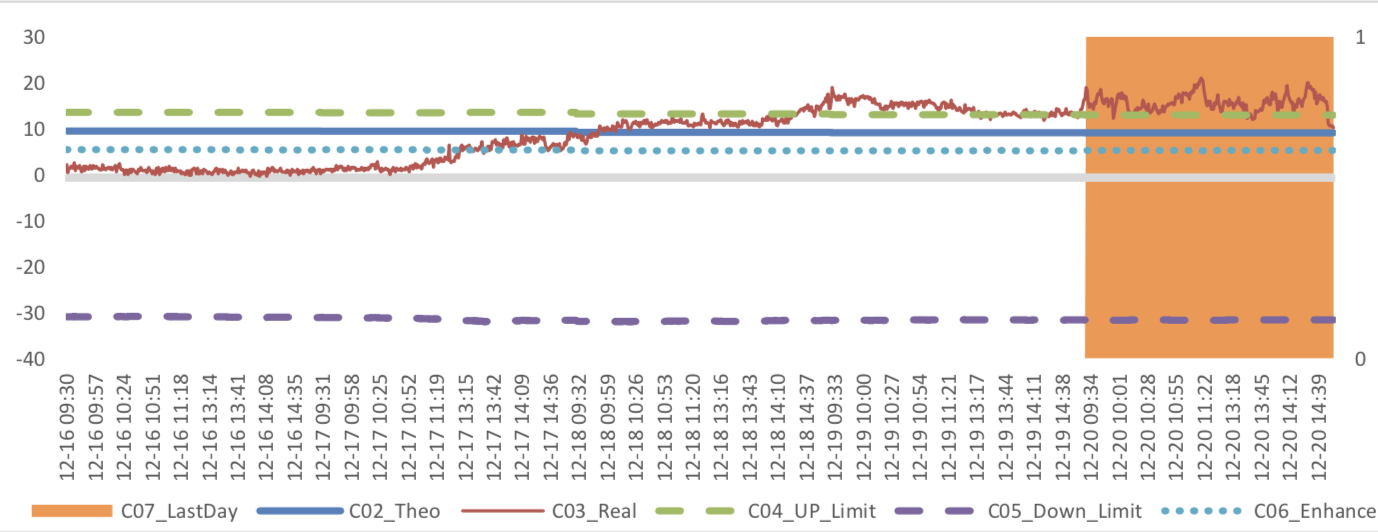
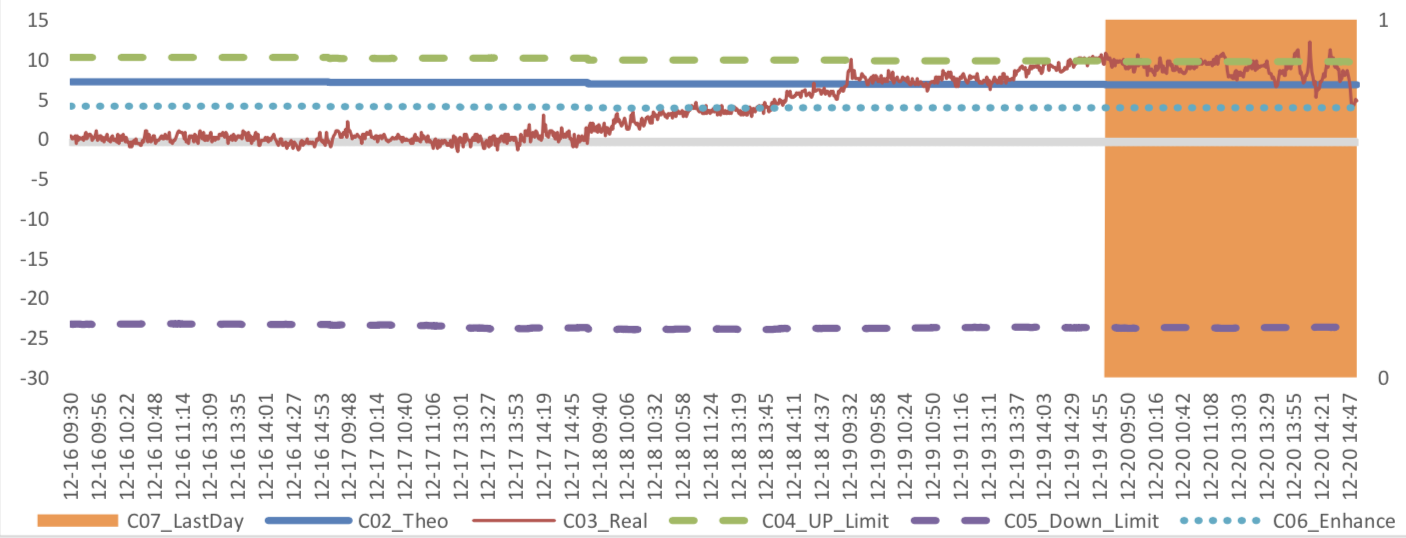
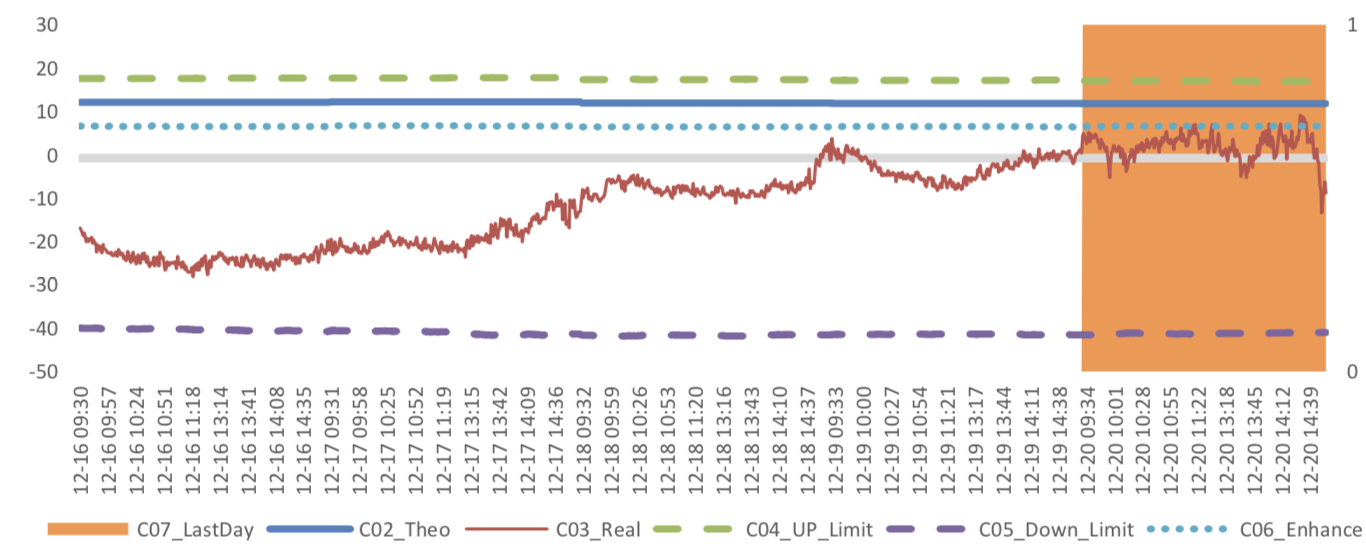
When real price spread is out of theoretical range (calculated by our assumption), there exists absolute future-spot arbitrage opportunity.
Graph 21: Future (Current Month)-Spot Arbitrage Opportunity for CSI300 contract (in the view of price difference)
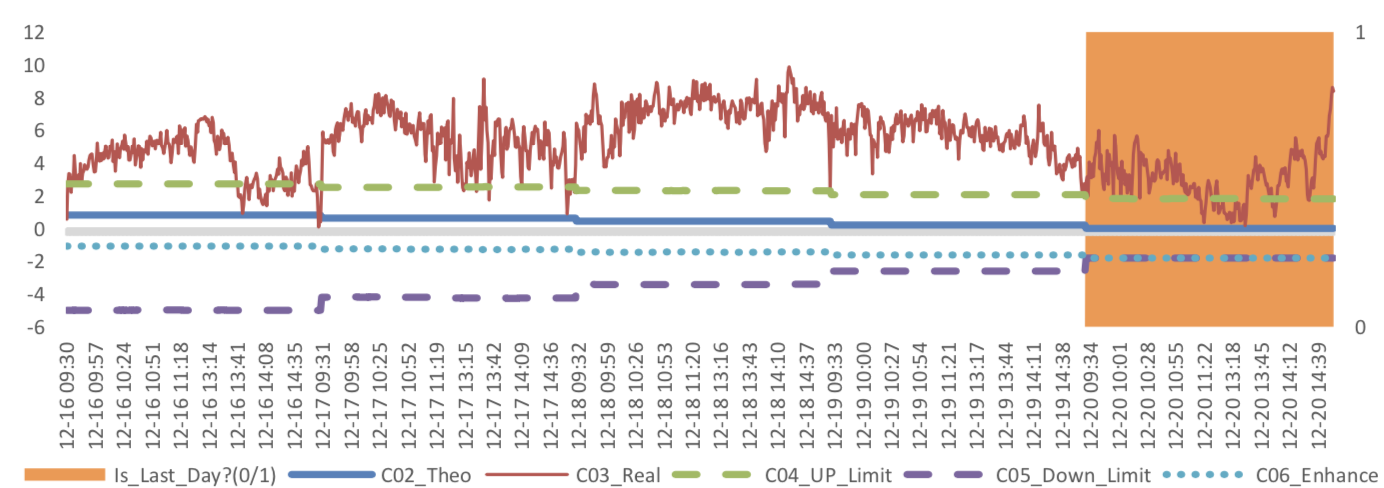
Graph 22: Future (Current Month)-Spot Arbitrage Opportunity for SSE50 contract (in the view of price difference)
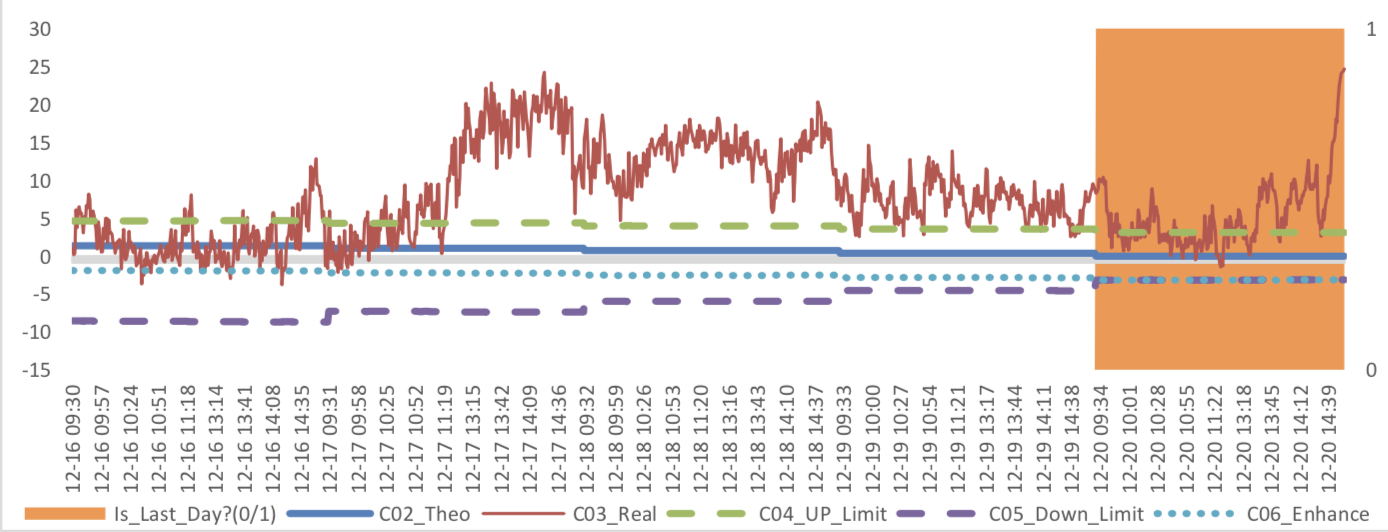
Graph 23: Future (Current Month)-Spot Arbitrage Opportunity for CSI500 contract (in the view of price difference)
Graph 24: Future (Next Month-Current Month) Arbitrage Opportunity for CSI300 contract (in the view of price difference)
Graph 25: Future (Next Month-Current Month) Arbitrage Opportunity for SSE50 contract (in the view of price difference)
Graph 26: Future (Next Month-Current Month) Arbitrage Opportunity for CSI500 contract (in the view of price
difference)
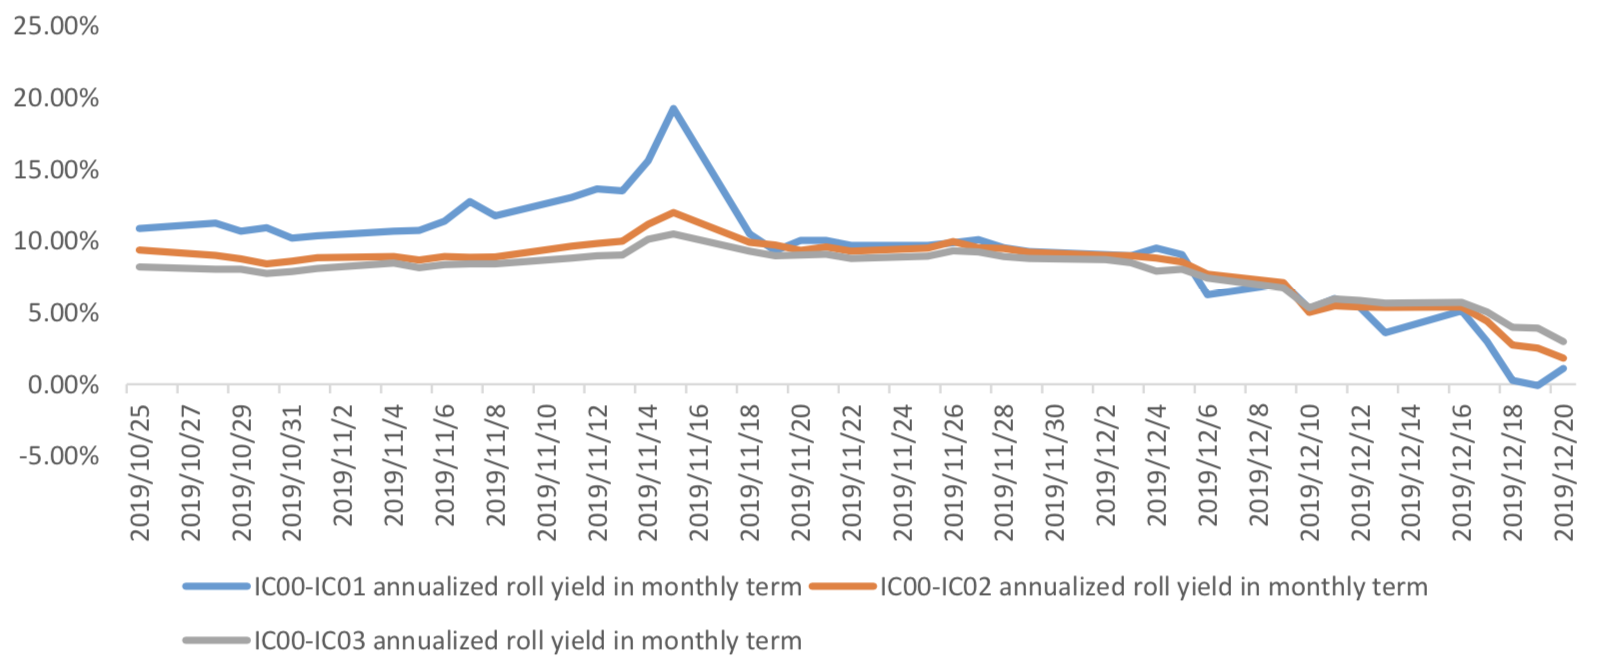
(4) Roll Spread of Stock Index Futures Tracking
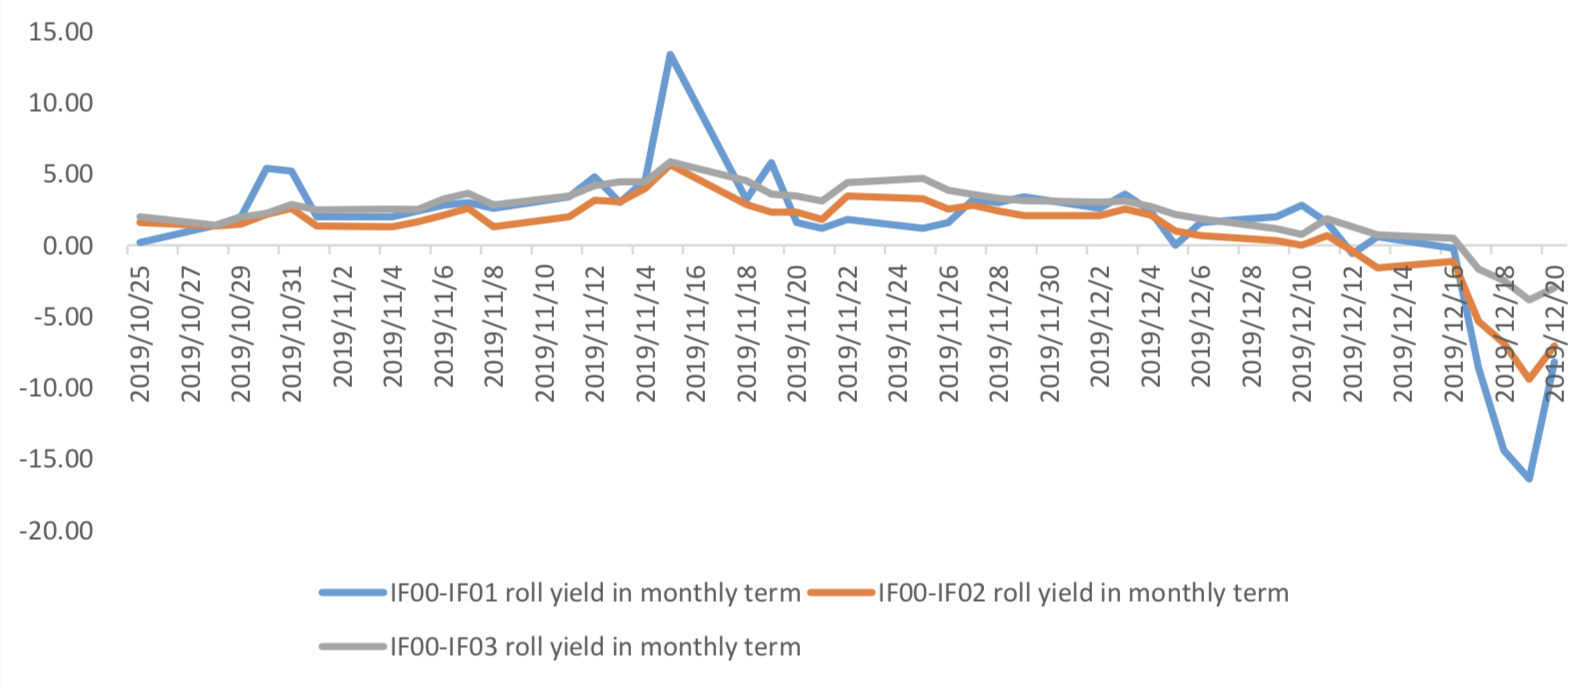
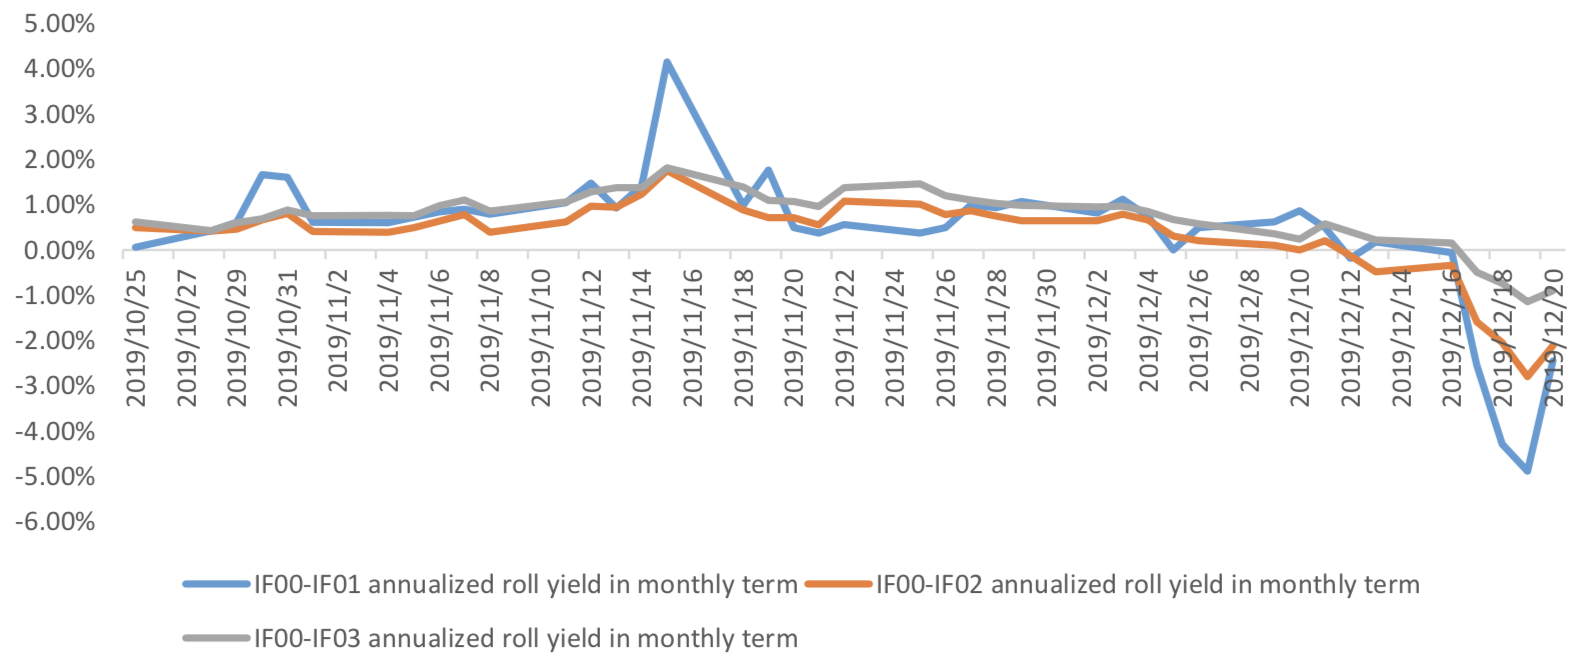
Calculated as the contract price of the current month minus the contract price of the following month, for the long roll, the positive calculation results are gains, the negative calculation results are losses. Code 00 in the figure represents the current month contract, 01 the next month contract, 02 the current quarter contract, 03 the next quarter contract.
(a)IF
Up to2019/12/20,the best roll plan is IF00-IF03,annualized roll yield in monthly term is-0.90%。
Graph 27: IF Current month contract roll yield comparison (index point)
Graph 28: IF Current month contract roll yield comparison (annualized return)
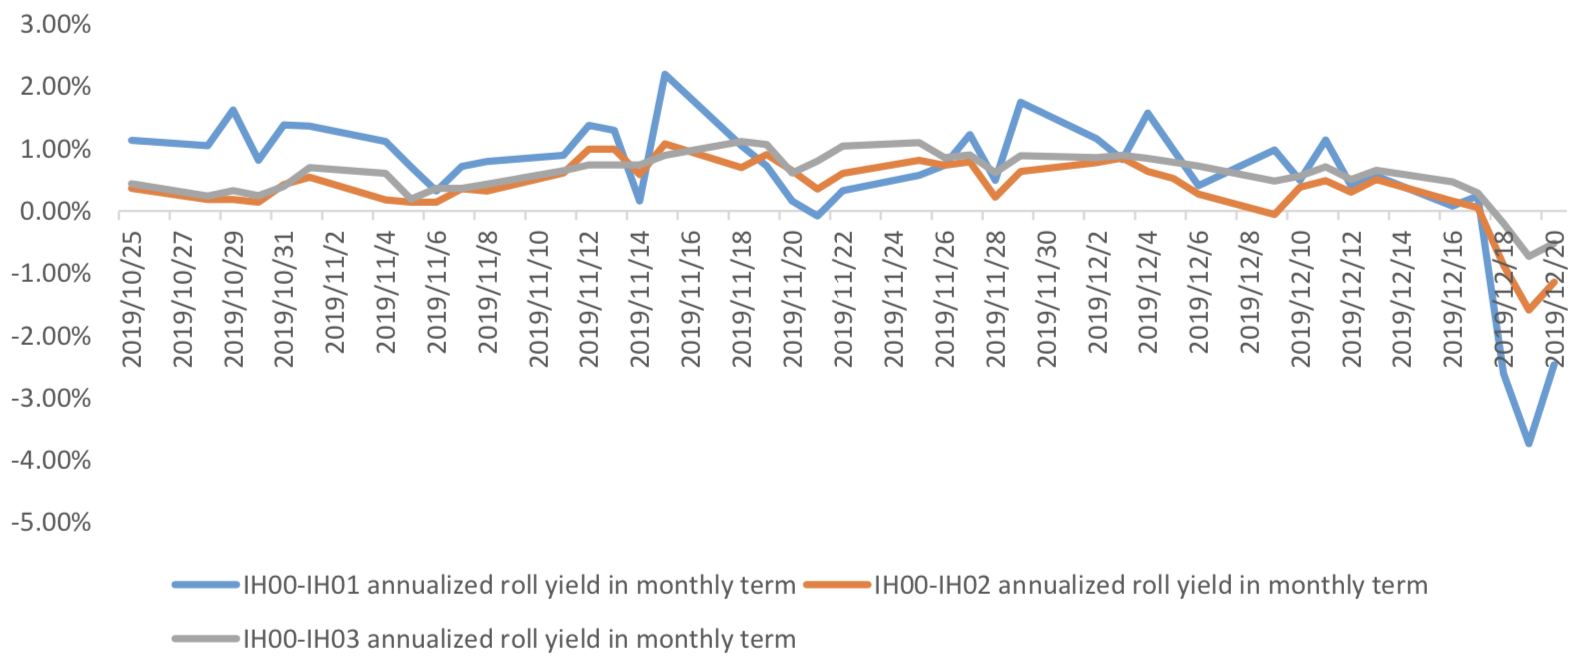
(b)IH
Up to 2019/12/20,the best roll plan is IH00-IH03,annualized roll yield in monthly term is-0.52%。
Graph 29: IH Current month contract roll yield comparison (index point)
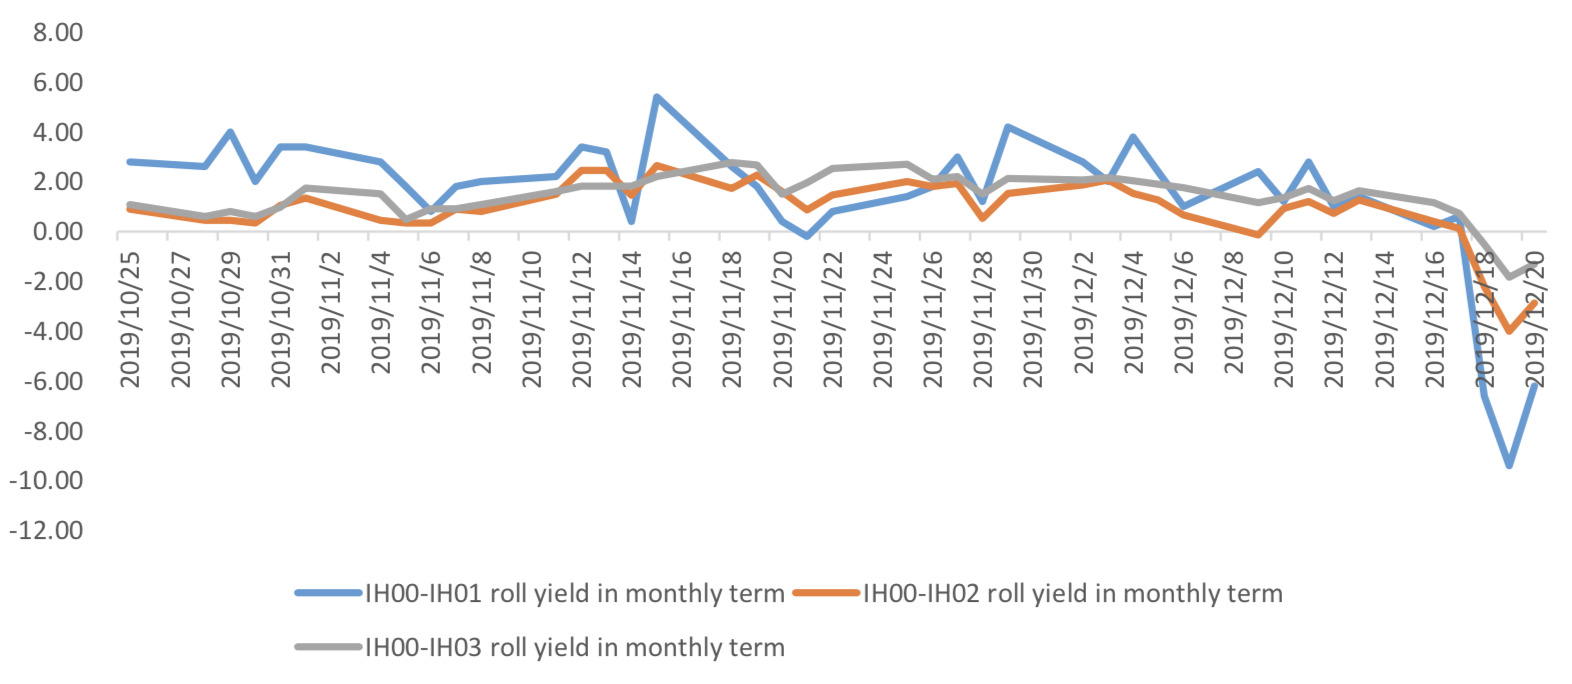
Graph 30: IH Current month contract roll yield comparison (annualized return)
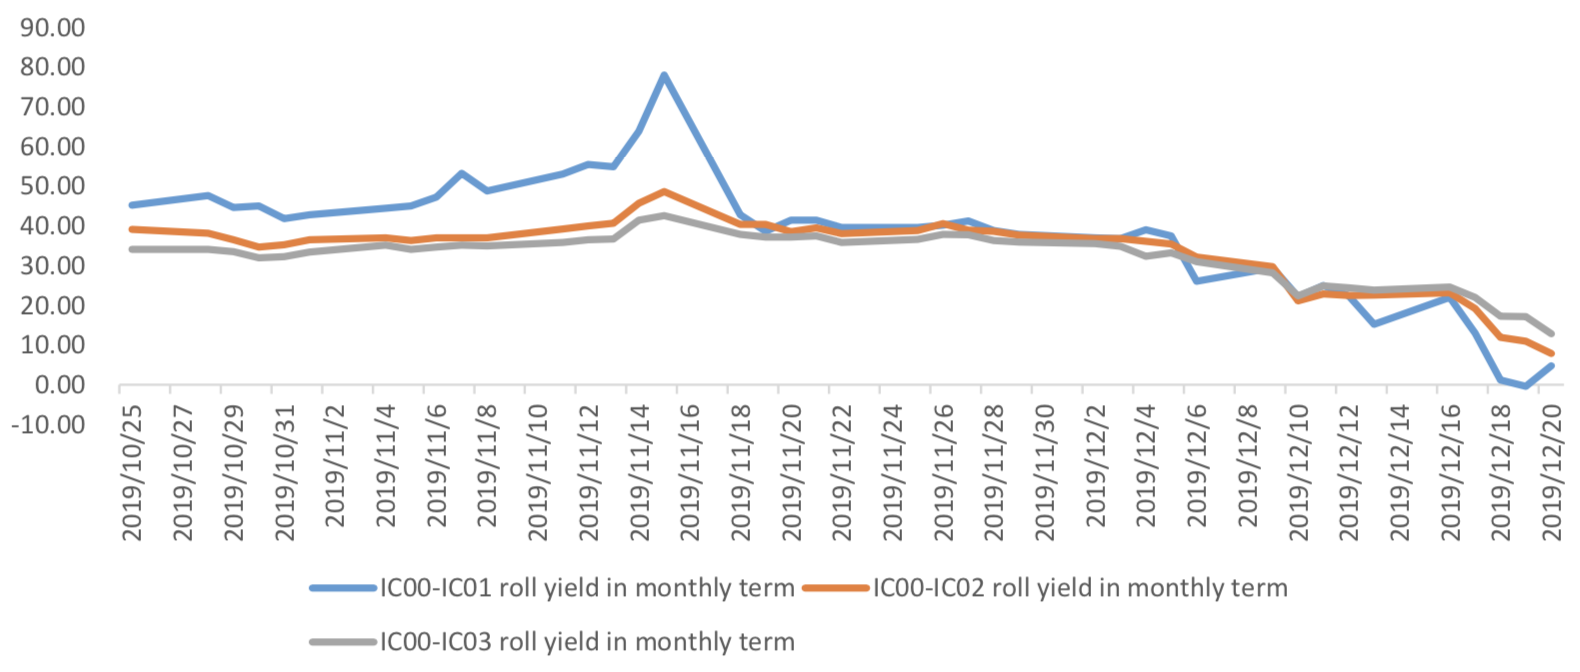
(c)IC
Up to2019/12/20,the best roll plan isIC00-IC03,annualized roll yield in monthly term is2.97%。
Graph 31: IC Current month contract roll yield comparison (index point)
Graph 32: IC Current month contract roll yield comparison (annualized return)
(5) Basis Tracking of Stock Index Futures
For long side, if the base difference is positive, the change of the base difference brings losses, and if the base difference is negative, the change of the base difference brings profits.
(a)IF
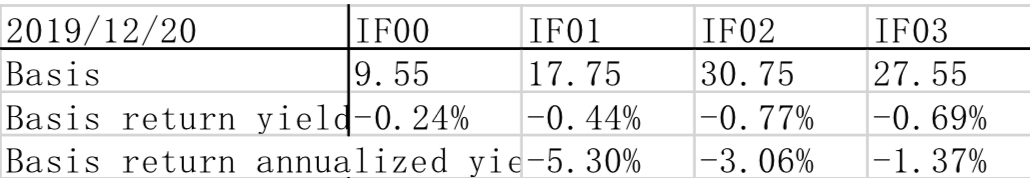
For long side hedge, up to 2019/12/20,all IF contracts were in premium. Here IF next month contract basis return annualized yield is -5.30%。
Graph 33: IF contracts basis
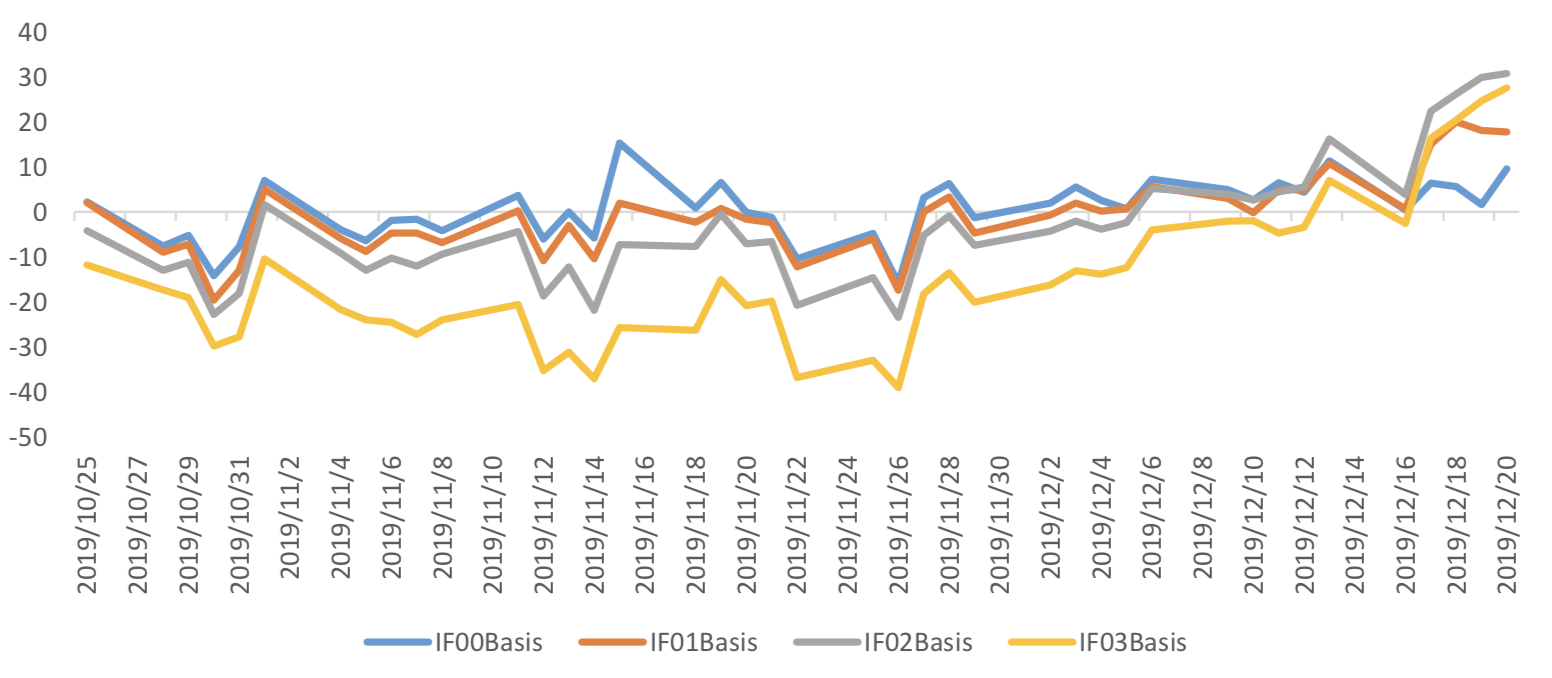
Table 1: IF basis return calculation
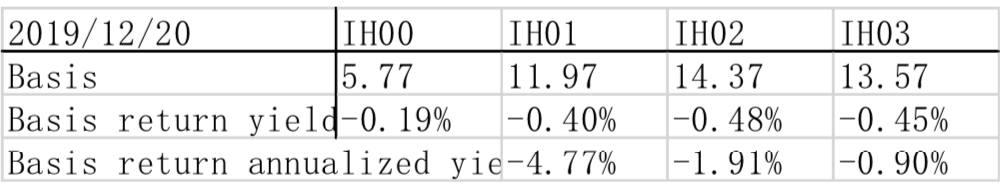
(b)IH
For long side hedge, up to 2019/12/20,all IH contracts were in premium. Here IH next month
contract basis return annualized yield is -4.77%。
Graph 34: IH contracts basis
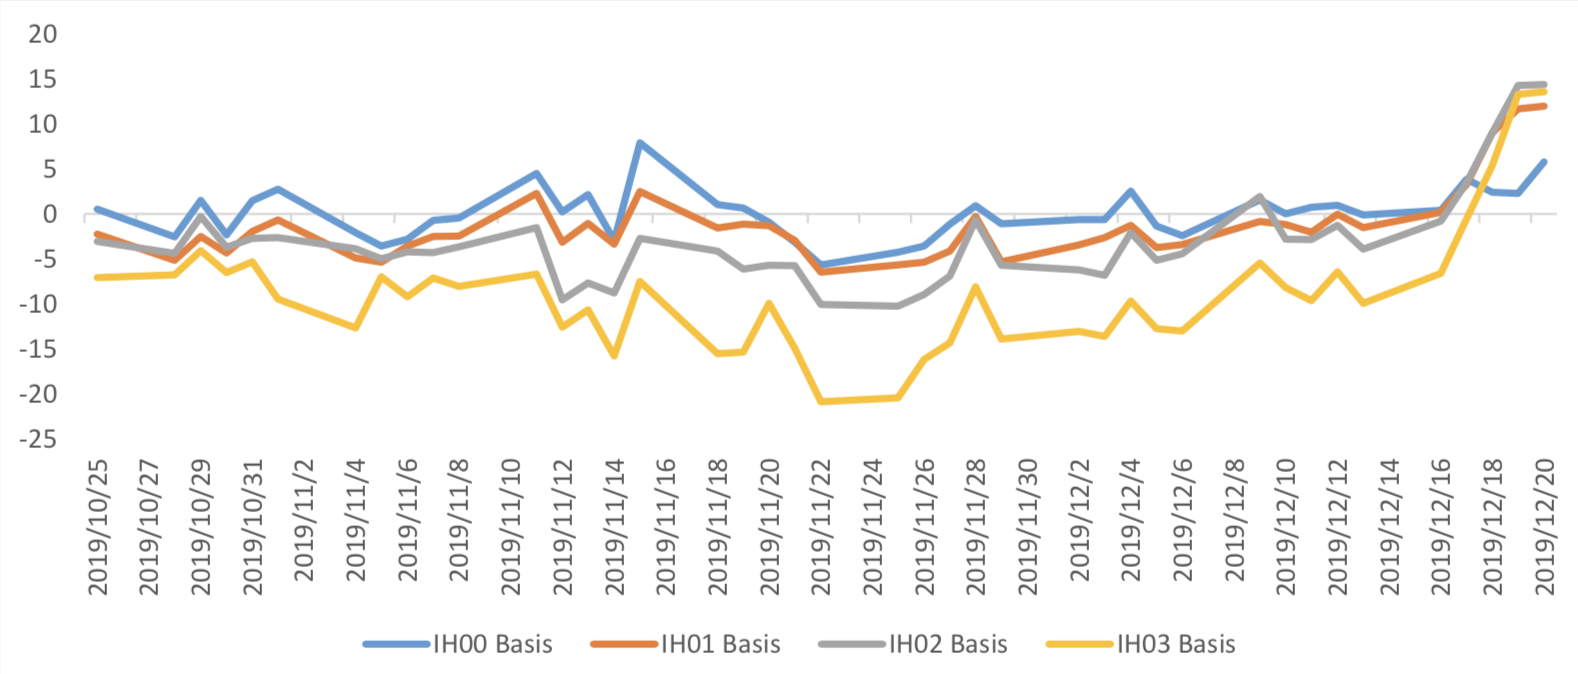
Table 2: IH basis return calculation
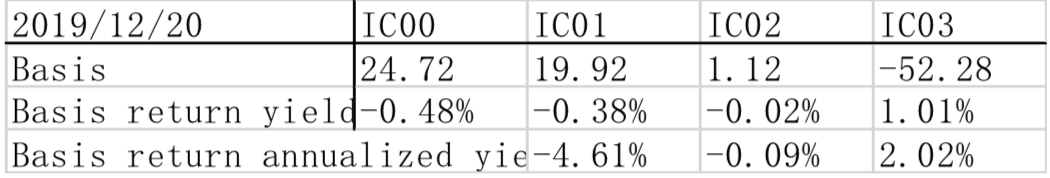
(c)IC
For long side hedge, up to 2019/12/20,IC00, IC01 and IC02 were in premium, other IC contracts were
in discount. Here IC next month contract basis return annualized yield is -4.61%。
Graph 35: IC contracts basis
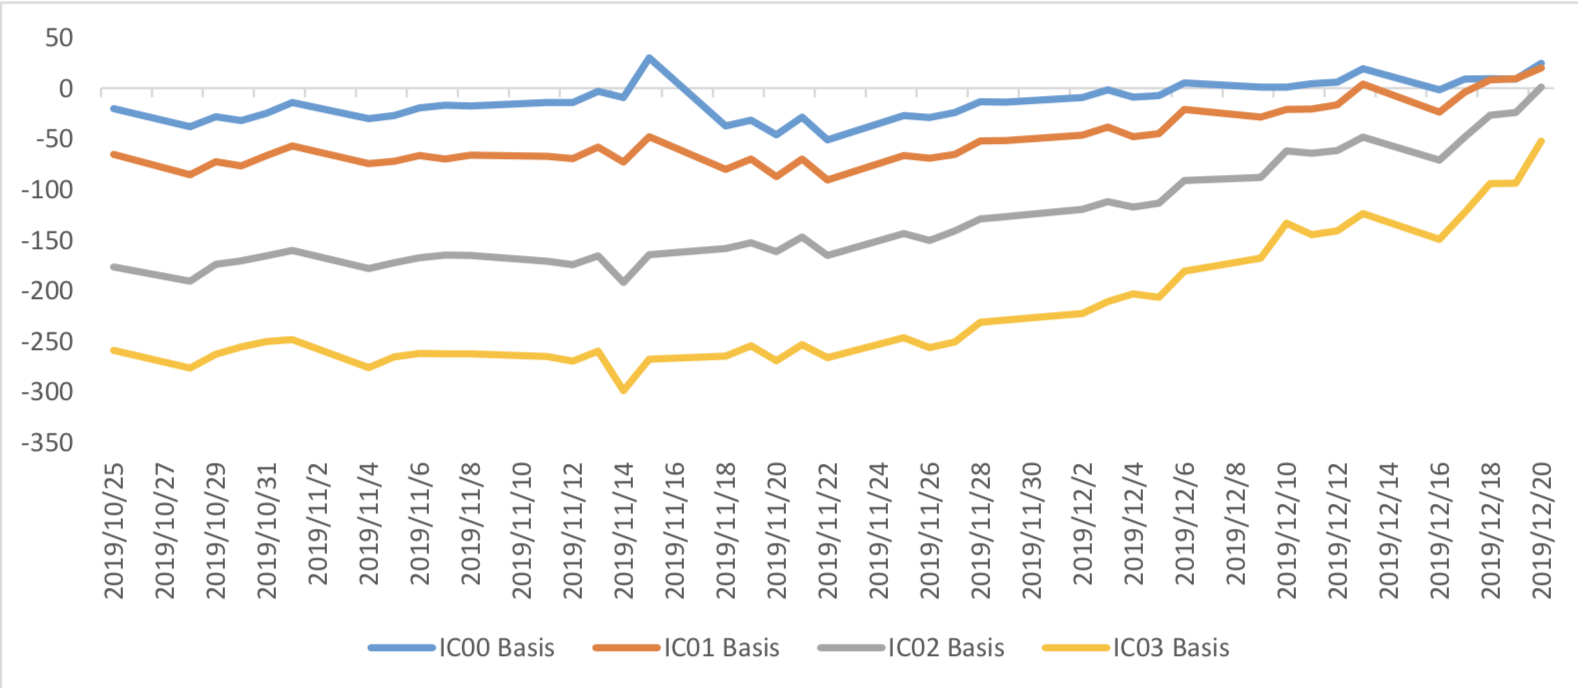
Table 3: IC basis return calculation
3. Financial Markets
(1) Interest Rates
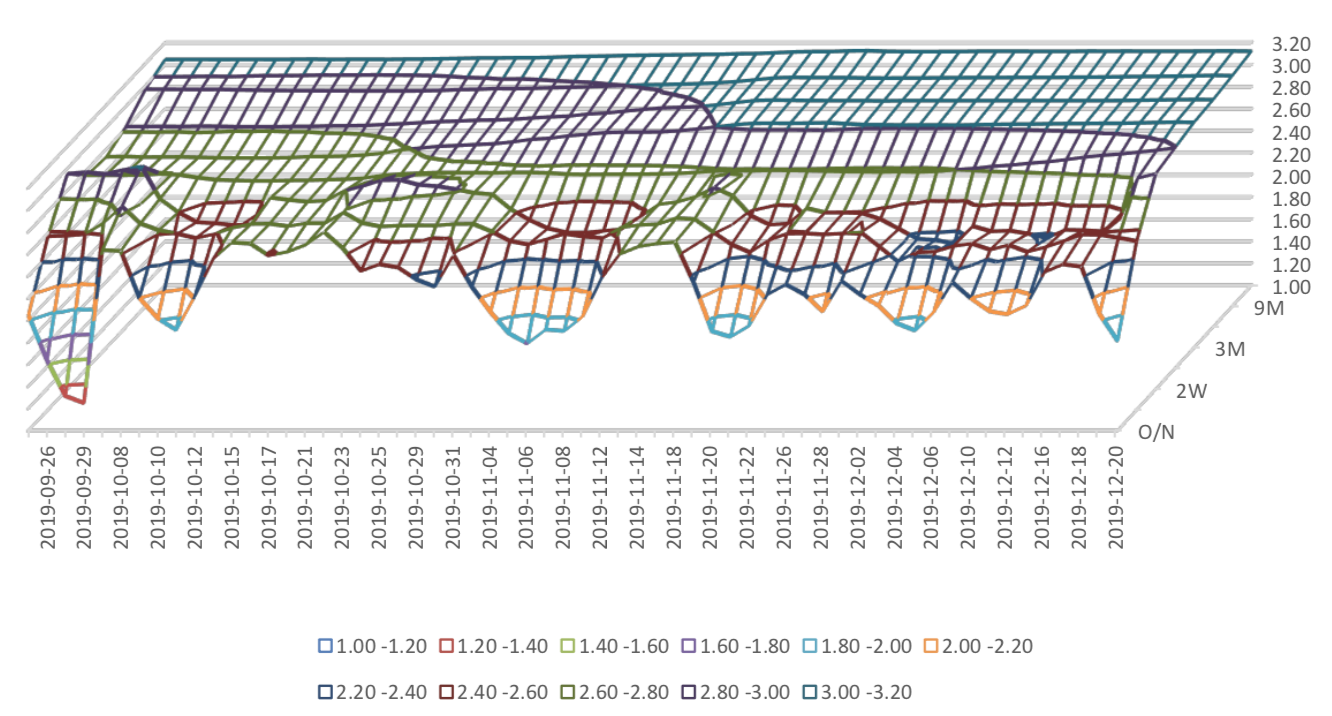
The term structure of treasury bonds’ yields is currently upward sloping in concave shape.
Specifically, last week, short-term yields short term yield of Treasury bond experienced some fluctuation and 3M yield now at 2.4%-2.6% level. Furthermore, as for long-term yield, there is a small drop. 10Y yield is about 3.2%-3.4%.
Graph 36: Term Structure Evolvement of Treasury Bonds Yields During Recent 3 Months (%)

As for Shibor rates, short-term rates experienced significant fluctuation. Specifically, O/N rate experienced obvious fluctuation to 1.8%-2.0% level.
Graph 37: Term Structure Evolvement of Shibor Rates During Recent 3 Months (%)
(2) ExchangeRates
During last week, CNY/USD changed 0.395% to 7.0115 and offshore rate, CNH/USD, changed -0.06% to 7.0011 and USD index changed 0.52%.
Graph 38: USD/CNY, USD/CNH and USD Index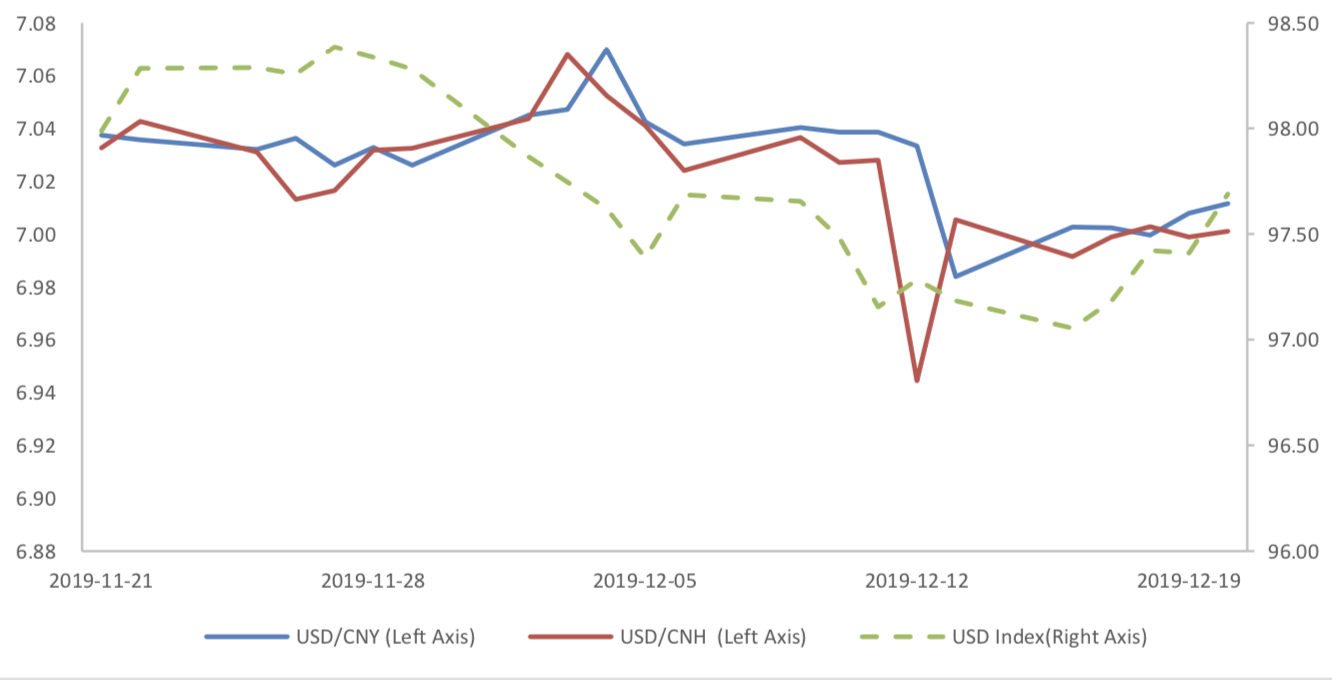
Macroeconomic Topic:
Data released by the National Bureau of Statistics show that in November, the added value of industries above scale increased by 6.2% in terms of monthly year-on-year ratio, with the pre-value of 4.7%; in January-November, the national fixed assets investment increased by 5.2% in nominal terms, with pre-value of 5.2 %; and in November, the total retail sales of consumer goods increased by 8% in terms of monthly year-on-year ratio, with pre-value of 7.2%.
November Economic Data
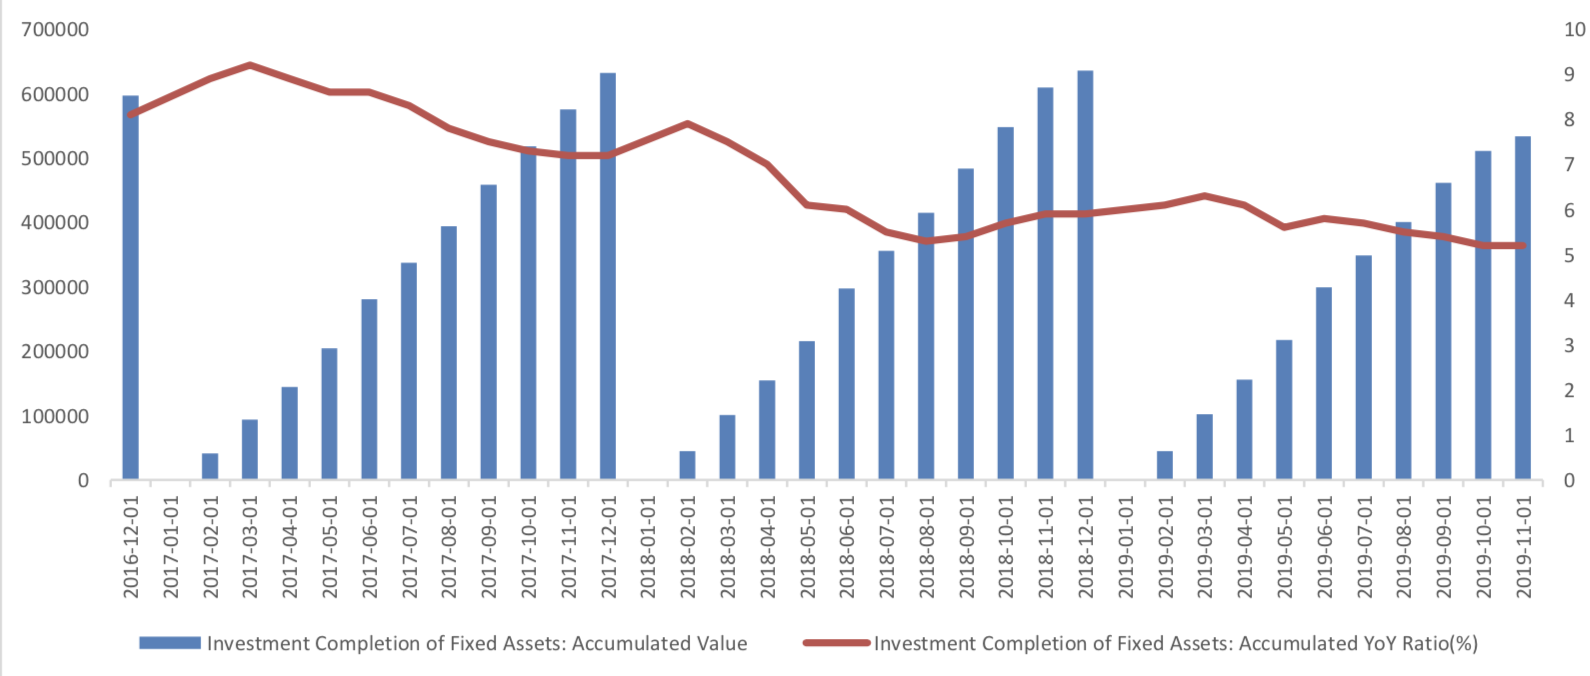
(1) Fixed Assets Investment
From January to November, the cumulative growth rate of fixed assets investment was 6.2% year-on- year, show a rebound. From the structural point of view, the growth rate of real estate investment has slightly decreased, manufacturing investment has slightly decreased, and infrastructure investment has slightly decreased.
Graph A: Investment Completion of Fixed Assets (100m RMB)
Graph B: Investment Completion of Real Estate Development, Manufacturing Industry, Infrastructure Construction
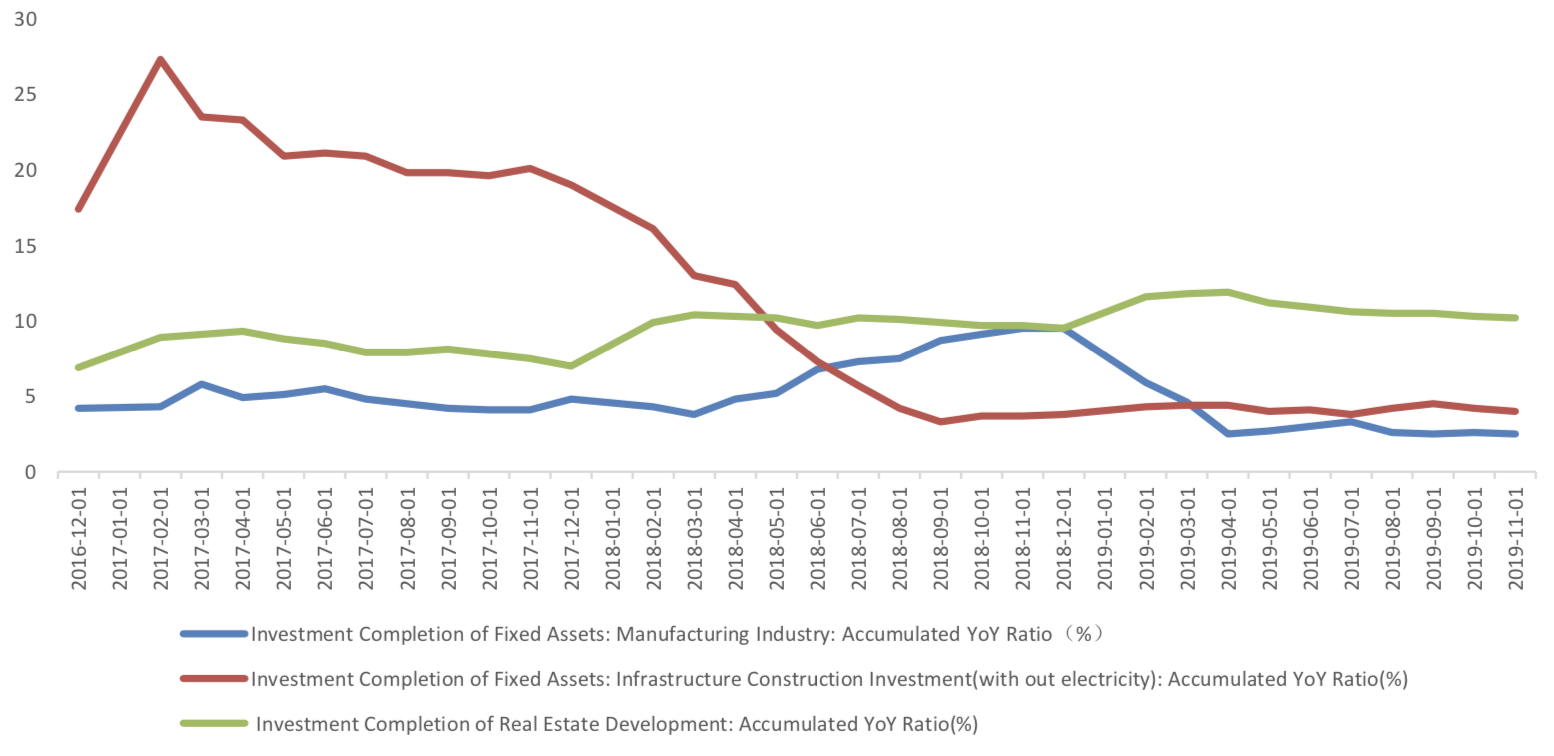
From January to November, investment in infrastructure (excluding electricity) increased by 4.0% year- on-year, with pre-value of 4.2%.
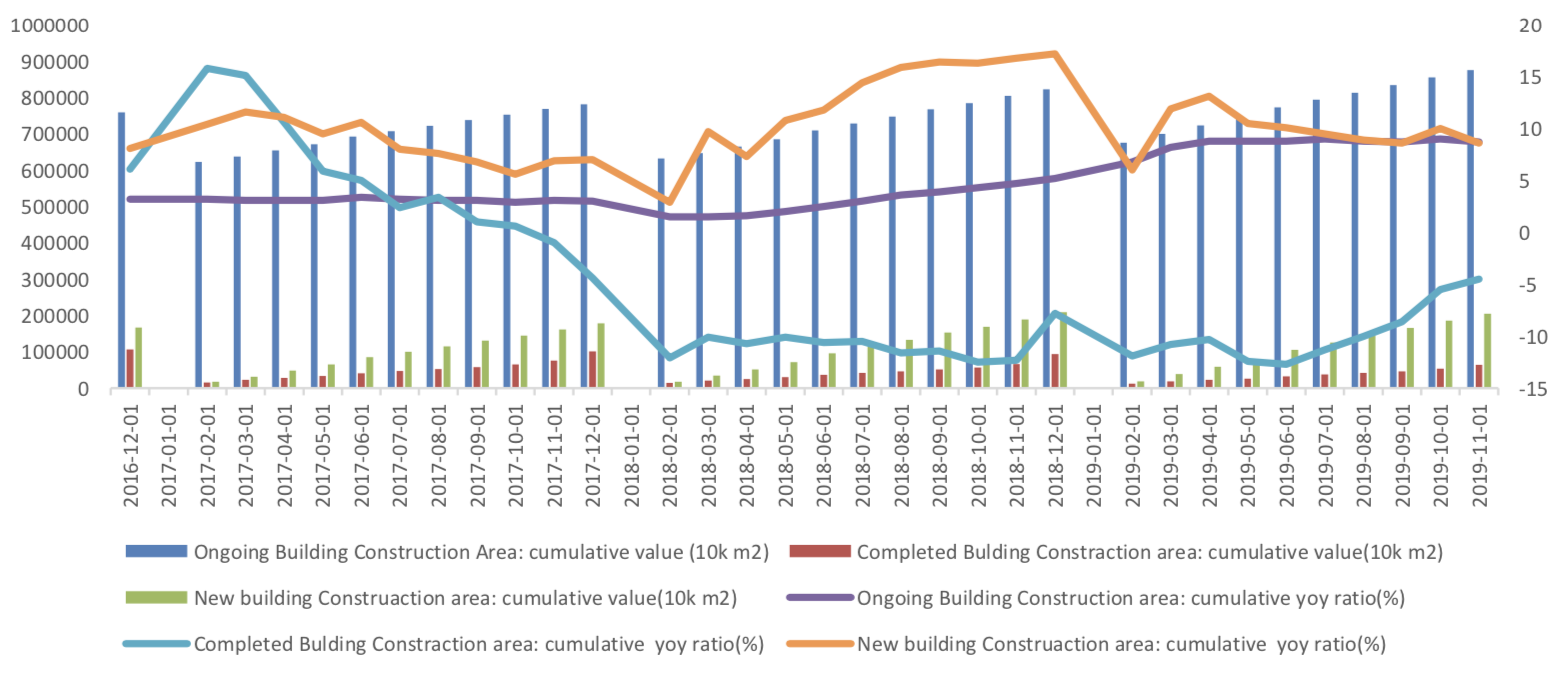
From January to November real estate investment increased by 10.2% year-on-year, 0.1 percentage points slower than the previous value, showed a drop trend. In November, the growth rate of new housing construction area decreased. From January to November, the cumulative growth rate was 8.6% year-on-year, which was lower than the previous value of 10%.
Graph C: Build Construction Data
From January to November, manufacturing investment increased by 2.5% year-on-year, and the growth rate decreased by 0.1 percentage points compared with the previous value.
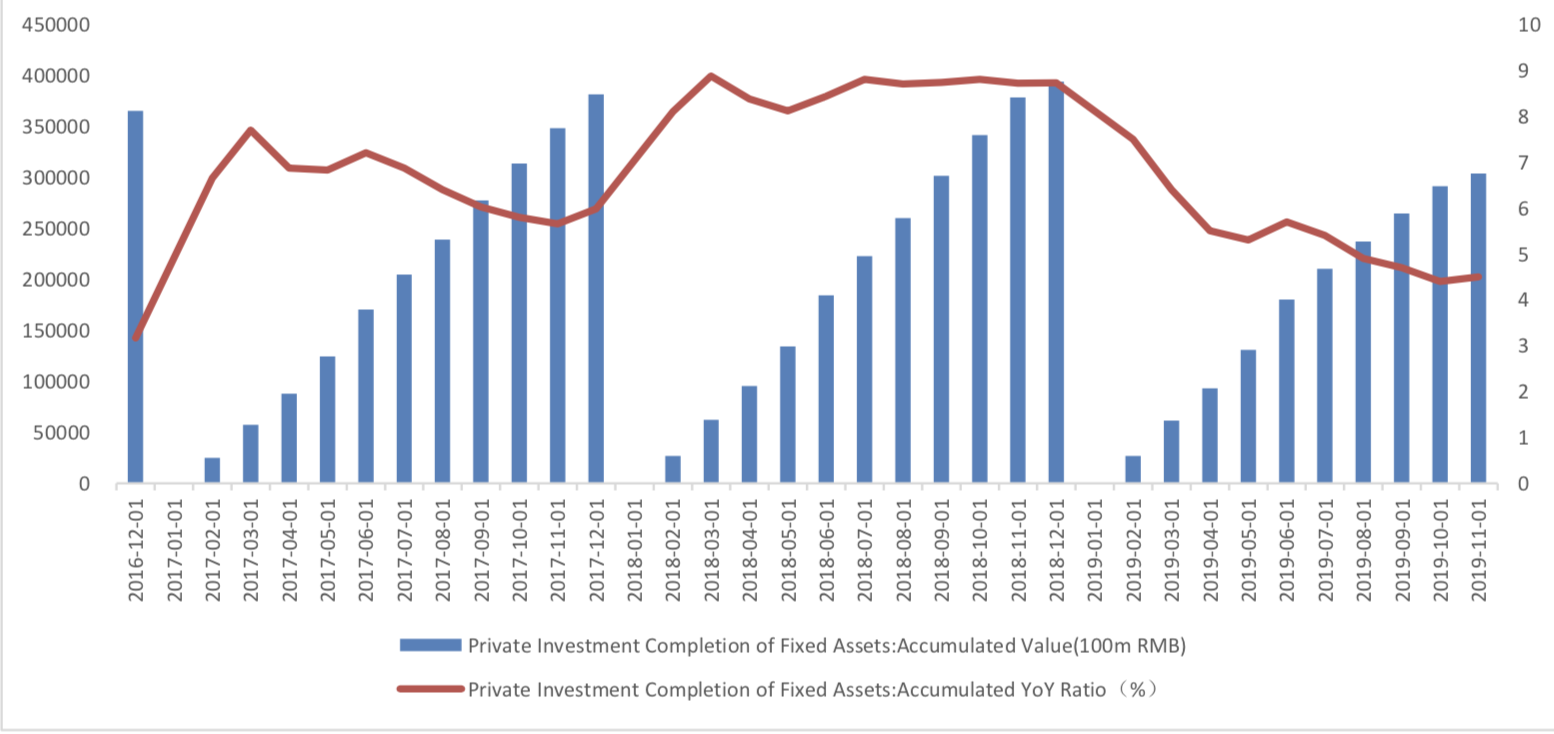
Private investment completion of fixed assets increased. From January to November, the cumulative growth rate of private fixed assets investment was 4.5% year-on-year, which was 0.1 percentage points higher than the previous period.
Graph D: Private Investment Completion of Fixed Assets
(2) Industrial Value Added
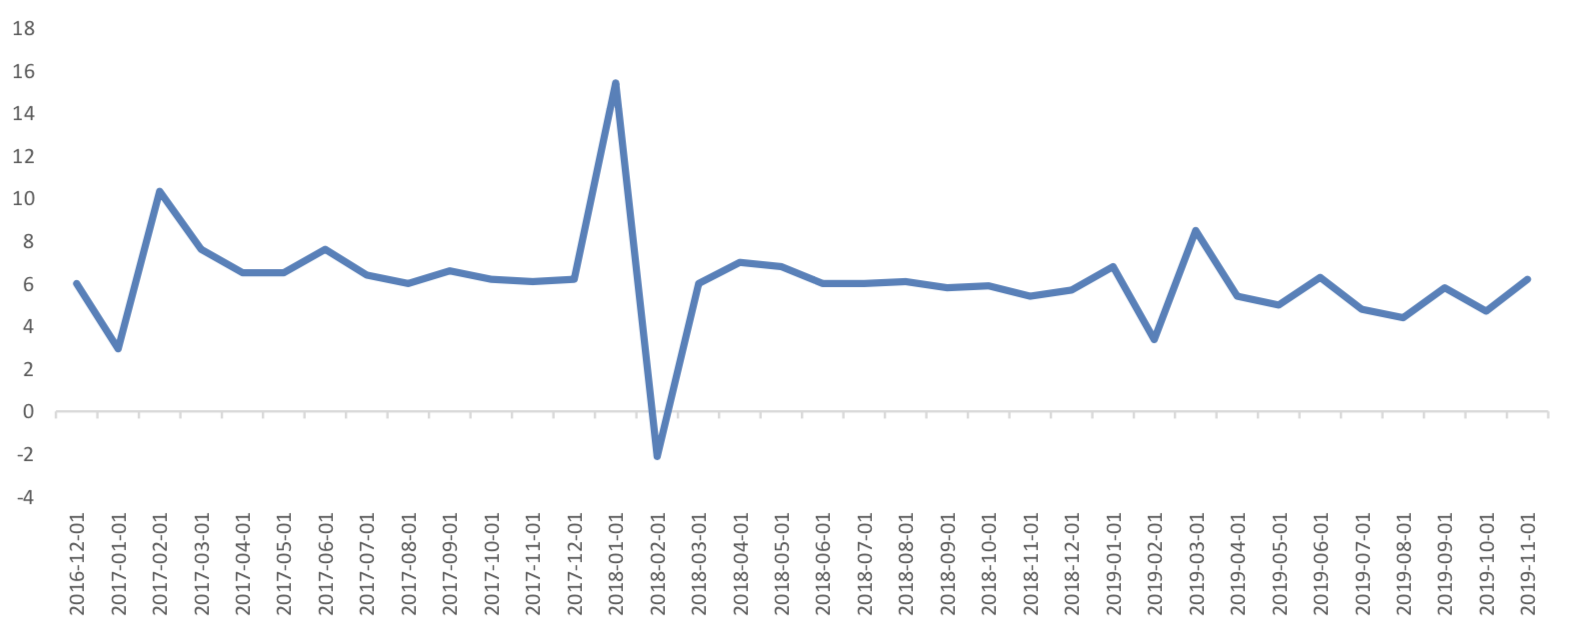
In November, the value added of industries above the designated size increased by 6.2% year on year, and the growth rate increased by 1.5 percentage points compared with the previous month.
Graph E: Industrial added value above designated size: Monthly YoY Ratio (%)
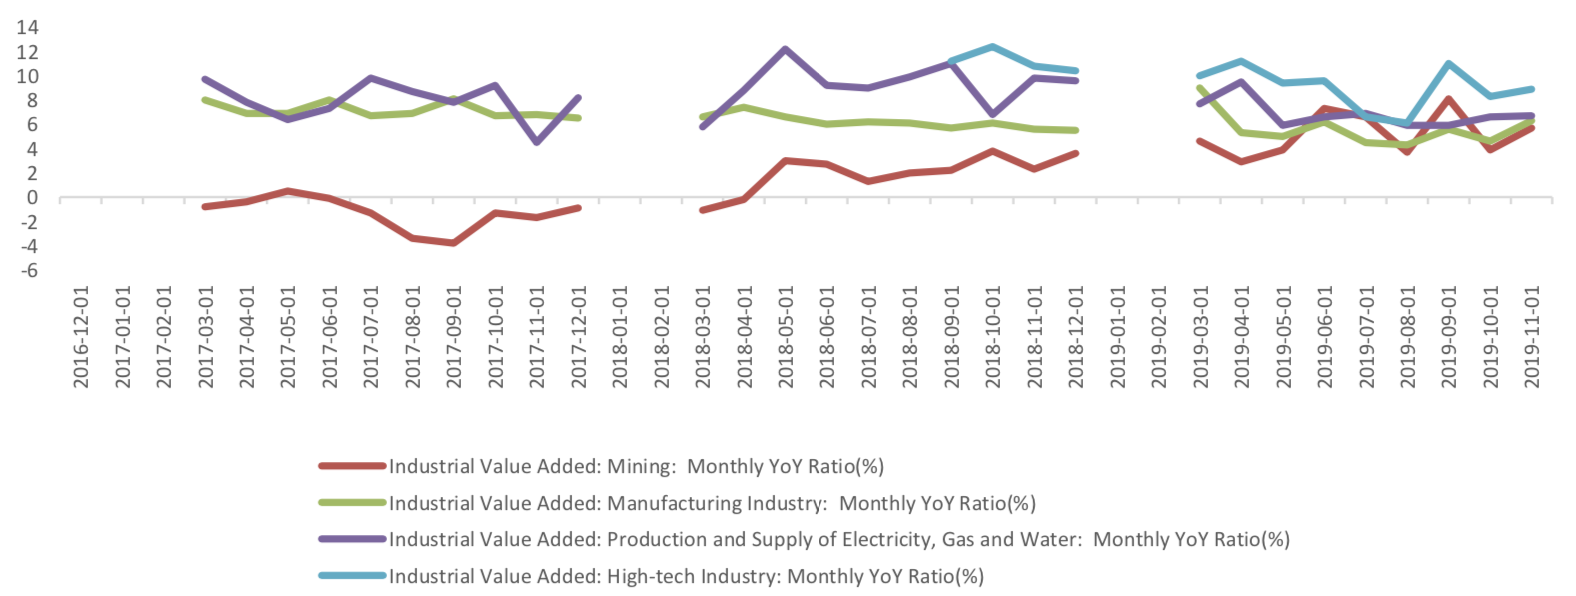
In terms of the 4 categories, all of them rose. The value added of mining industry in November increased by 5.7% year on year, and the growth rate rose by 1.8 percentage points compared with the previous month, which had a great promote on the growth rate of industrial production in that month; the manufacturing industry increased to 6.3% and rose by 1.7 percentage points; the production and supply of electricity, heat, gas and water increased to 6.7% and rose by 0.1 percentage points compared with the previous month. The value added of high-tech industry in November increased by 8.9% year on year, the growth rate increased by 0.6 percentage points compared with the previous month.
Graph F: Industrial added value above designated size: by industry categories
(3) Consumption
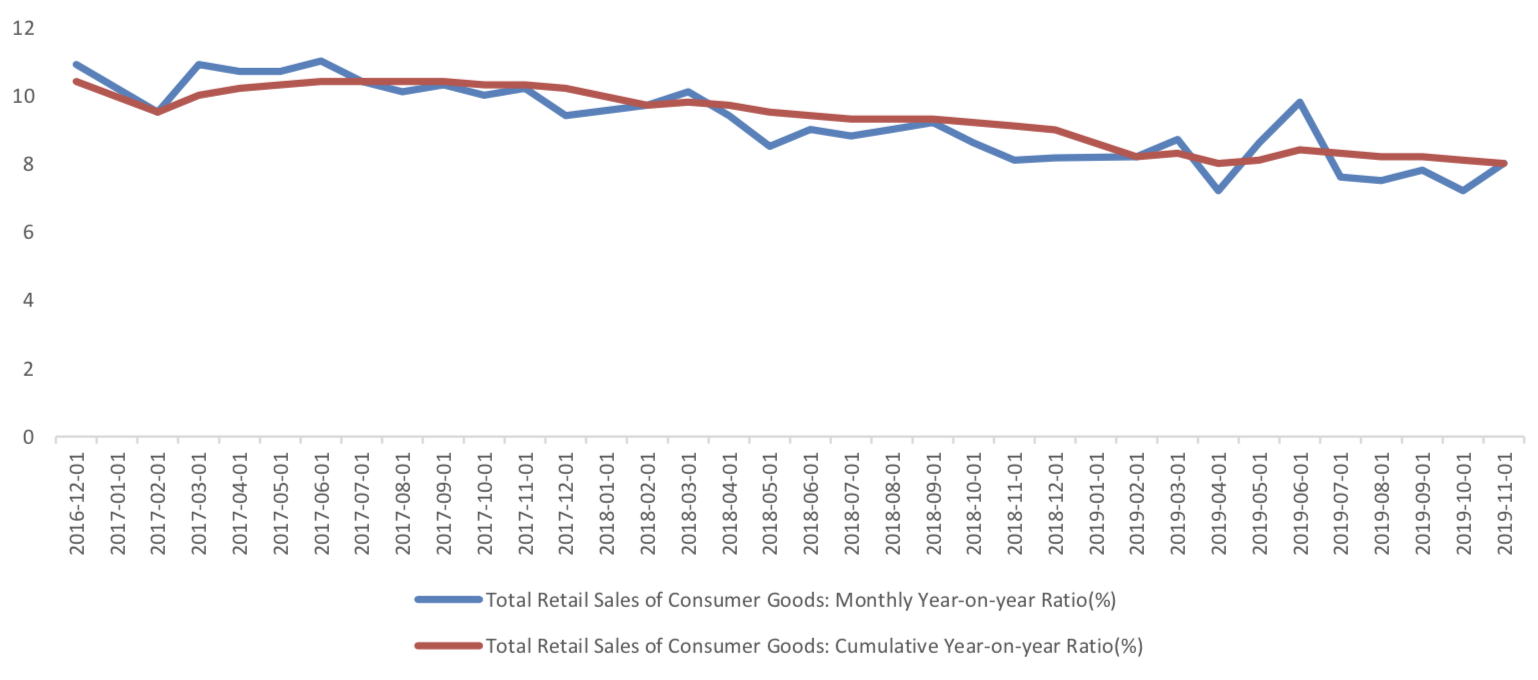
In November, the nominal growth rate of total retail sales of social consumer goods rose to 8% from 7.2% last month, while the cumulative growth rate in January-November slowed by 0.1 percentage points to 8% compared with the previous value.
Graph G:Total Retail Sales of Consumer Goods
Currently no Comments.
Hot Topics
The 13rd China International Future Forum
The Shanghai Derivatives Energy Forum has received extensive attention from relevant industries both within and outside the borders.
Financial institutions deep explore commodity market opportunities, commodity index financial products show full-scale trend
R-Code for analysis: getKDJ
R-Code@June 06, 2016
New indicator to analyze the arbitrage opportunities between sse50 and csi500
Market review: January 11, 2017
The Great China Bubble: Anniversary Lessons and Outlook
Quant Investment in China A-share market
The hedge strategy between SSE50 and A50--Jan 13,2017
The arbitraging strategy between CSI300 and SSE50
Market review: June 17, 2016
Sleepless in London--Enda Homan(Allied Irish Banks Plc)
MSCI Rebuffs Chinese Equities for Third Time in Blow to Xi
Soros, Druckenmiller among hedgies profiting in market plunge