FangQuant › Financial Futures
Market Summary:
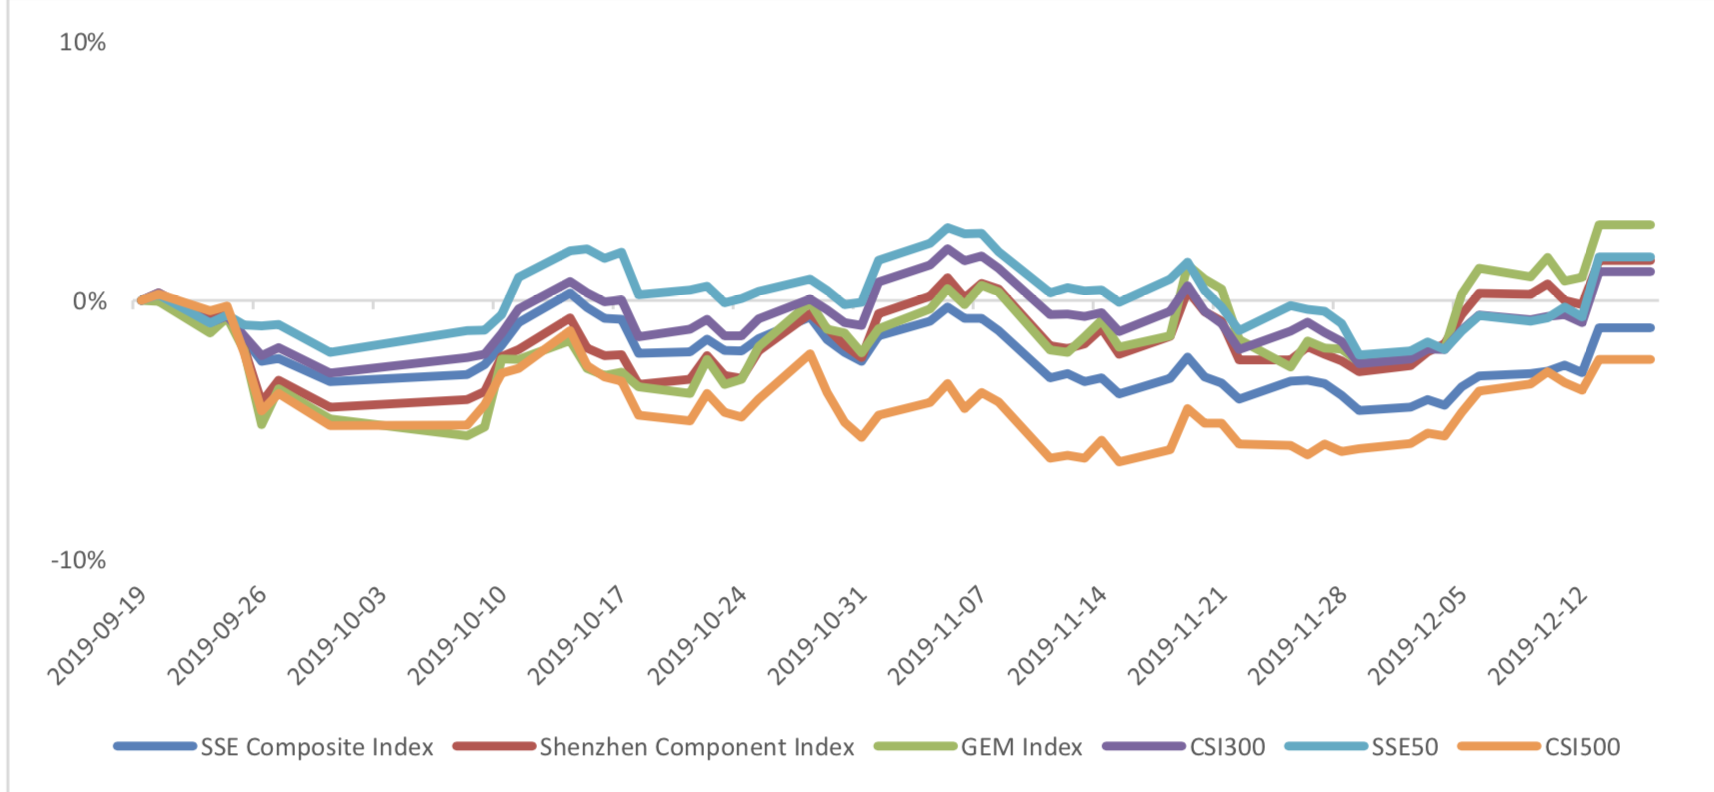
Last week, there was generally increase over the market. Shanghai SE Composite Index (000001.SH) changed 1.91 % to 2967.68. Specifically, large cap shares perform better than small cap shares and we can observe that SSE50 did better than CSI500 (2.26% vs 1.26%). The average daily turnover of the whole market during past 5 trading days is 481.69 billion CNY, it increased 28.19% compared with the previous 5-trading day period.
China and the United States reached an agreement on the text of the first phase of the economic and trade agreement, and the United States will lift tariffs on products to China in stages. On Friday, CCTV News reported that it had reached an agreement on the text of the first phase of the economic and trade agreement between China and the United States. The text of the agreement includes nine chapters: intellectual property rights, technology transfer, food and agricultural products, financial services, exchange rate and transparency. At the same time, the two sides reached an agreement that the United States will fulfill the relevant commitments of phasing out the imposition of tariffs on China's products, and realize the change from increasing to reducing the tariffs. This greatly boosts market confidence and A-share should be benefit from this.
Foreign funds kept flowing in A-shares. During last week the total foreign fund flow via Stock Connect is 20.51 billion RMB, and the cumulative inflows was 961.54 billion RMB, creating a new high.
As for arbitrage opportunity, all futures current-month contracts show some room for arbitrage opportunities. No price spread for next-month/current month contracts show room for arbitrage.
News:
1、Deputy Director of Development and Reform Commission, Ning Jichen: he said that next year will be the year when the comprehensive construction of a well-off society and the 13th Five-Year Plan will be completed. It is necessary to keep the economic operation within a reasonable range and ensure that the total amount of economic growth is reasonably increased and the quality is steadily improved. Economic operation in a reasonable range includes not only efforts to achieve quality and profitable high-speed growth, but also continuous employment expansion, overall price stability, resident income growth, and ecology surroundings to gradually improve.
2、Central Bank Vice President Chen Yulu said that while continuing to implement a stable monetary policy, maintaining macro leverage and the overall health and stability of the financial system, the solid implementation of the announced opening-up measures. And steadily expand the capital project convertibility, increase the degree of free use of the renminbi, and strive to further open the financial industry to a higher level.
3、The National Development of and Reform Working Conference requires that we pay attention to supplementing the shortcomings and improving the quality of the weakest items, do a good job of people's livelihood, do everything possible to stabilize employment, comprehensively win the battle against poverty, and ensure the supply of key agricultural products at a stable price.science compiles the "Fourteenth Five- Year Plan", drafts the "Outline" of the "Fourteenth Five-Year Plan" with high quality the study, and does a good job of summing up and evaluating the implementation of the "13th Five-Year Plan".
4、The Ministry of Finance and the State Administration of Taxation issued the "Announcement on the Relevant Policy Issues Concerning the Payment of Individual Income (benefit) expense Comprehensive". It is clear that the annual comprehensive income does not exceed 0.12 million yuan or the annual settlement and payment of additional taxes Individuals not exceeding 400 yuan are exempt from the individual income tax (benefit) expense Comprehensive income settlement and settlement.
5、Foreign Minister Wang Yi said that the conclusion of a phased Economic and trade agreement between China and the United States does not target or affect the legitimate rights and interests of third parties, but is good news for all countries and the world. Sino-US trading cooperation will be based on WTO rules, and Chinese companies will import more competitive products and services from the United States and other countries in accordance with the principles of marketization and businessization.
6、 CFFEx The release of the CSI 300stock index option contract and related business rules marked the formal completion of the CSI 300stock index option contract and rules. Next step, CFFEx Under the unified leadership of the China Securities Regulatory Commission, with the guidance of "four awe and one joint effort", we will do a good job in the listing of the CSI 300 stock index option to ensure the smooth launch and stable operation of our products.
7、The CSRC officially issued "Several Provisions on the Pilot Pilot Program for Spin-off of Subsidiaries of Public Companies"Up to now, nine A share companies have clearly stated that they will spin-off their subsidiaries to be listed on SSE STAR MARKET. The spin-off of the listing rules will relax a number of core thresholds, which will inevitably encourage more companies to formulate spin-off plans and report successively.
1. StockMarket(1) Indices Performance
During last week, Shanghai SE Composite Index (000001.SH) changed 1.91 % to 2967.68, Shenzhen Component Index (399001.SZ) changed 1.28 % to 10004.62, ChiNext Price Index (399006.SZ) changed 1.66 % to 1755.41, CSI 300 INDEX (000300.SH) changed 1.69 % to 3968.22, CSI SmallCap 500 index (000905.SH) changed 1.26 % to 5073.69, SSE 50 Index (000016.SH) changed 2.26 % to 3006.31.
Graph 1: Indices Performance over past 3 months
The average daily turnover of the whole market during past 5 trading days is 486.91 billion CNY, it increased 21.90% compared with the previous 5-trading day period.
Graph 2: Market turnover

(2) Sectors Performance
In the view of sectors, during last week (from 2019-12-06 to 2019-12-13), 24 of 24 Wind Level- 2 sector(s) increased while 0 sector(s) dropped. Specifically, Semiconductors & Semiconductor Equipment (6.34%), Software & Services(4.25%) and Diversified Financials(3.73%) did the best performance while Food, Beverage & Tobacco(0.46%), Utilities (1.01%) and Energy (1.02%) did the worst performance.
Graph 3: Sectors performance under Wind Level-2 classification (%)

(3) Indices Valuation (TTM)
The current PE for SSE Composite Index, Shenzhen Component Index, GEM Index, CSI300, SSE50, CSI500 are 12.8510, 24.1407, 53.6588, 12.0122, 9.6517, 26.5536respectively; and these indices are at 17.30%, 33.30%, 66.60%, 29.60%, 29.60%, 33.80% percent rank level of their historic data, respectively
Graph 4: PE of 6 indices

Graph 5: PE percent rank of 6 indices (calculated by data of past 1200 trading days, only 1Y data is presented on the graph)

The current PB for SSE Composite Index, Shenzhen Component Index, GEM Index, CSI300, SSE50, CSI500 are 1.3773,2.5380,4.8631,1.4457,1.1832, 1.8302respectively, and these indices are at 12.50%, 25.10%, 53.70%, 25.50%, 26.50%, 19.10% percent rank level of their historic data, respectively.
Graph 6: PB of 6 indices

Graph 7: PB percent rank of 6 indices (calculated by data of past 1200 trading days, only 1Y data is presented on the graph)

(4) Foreign Fund Flow
Last week, there were 5 trading days for northward channel open for stock connect programs. During last week the total foreign fund flow via Stock Connect is 20.51 billion RMB, and the cumulative inflows was 961.54 billion RMB. Specifically, the fund flow via Shanghai-Hong Kong Stock Connect is 13.33 billion RMB and the fund flow via Shenzhen-Hong Kong Stock Connect is 7.18 billion RMB.
Graph 8: Fund flow via both Shanghai and Shenzhen-Hong Kong Stock Connect in past 1M (100 million CNY)

Graph 9: Fund flow via Shenzhen-Hong Kong Stock Connect in past 1M (100 million CNY)

Graph 10: Fund flow via both Shanghai-Hong Kong Stock Connect in past 1M (100 million CNY)

(5) Margin Trading
According to the newest data, the margin financing balance is 968.21 billion, securities borrowing is
13.33 billion, totally 981.54 billion.
Graph 11: Margin Trading(100m RMB)

2. Index Futures
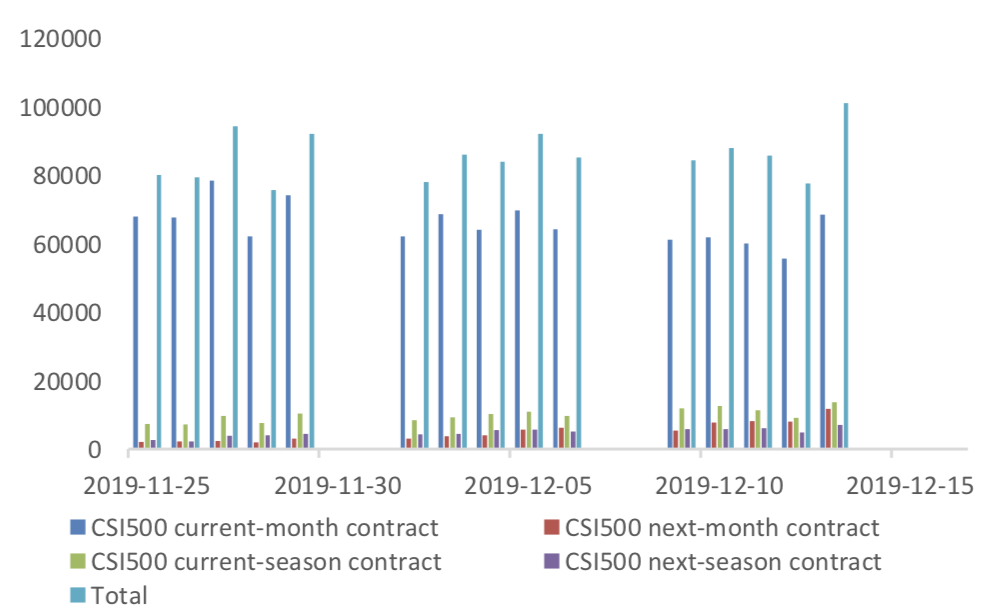
(1) Trading Volume and Open Interests
During past 5 trading days the average trading volume for CSI300(IF), SSE50(IH), CSI500(IC) contracts
are 60617 (-21.61%, the previous 5-trading day period),22611 (-17.49%),70437 (-18.35%) lots, respectively. On the last trading day, the total open interests for them are 129900 (13.92%),63734 (8.42%),177290 (3.17%) lots respectively.
Graph 12: CSI300 Index futures’ trading volume

Graph 13: CSI300 Index futures’ open interests

Graph 14:SSE50 Index futures’ trading volume

Graph 15: SSE50 Index futures’ open interests

Graph 16: CSI500 Index futures’ trading volume
Graph 17: CSI500 Index futures’ open interests

(2) Roll Level Bid-Ask Distribution
There are 5 trading days during last week, so the distribution is worked out with 36005 data points for each contract pair.
Graph 18: CSI300 Current/Next Month Contract Roll Spread Distribution (2s frequency)

Graph 19: SSE50 Current/Next Month Contract Roll Spread Distribution (2s frequency)

Graph 20: CSI500 Current/Next Month Contract Roll Spread Distribution (2s frequency)

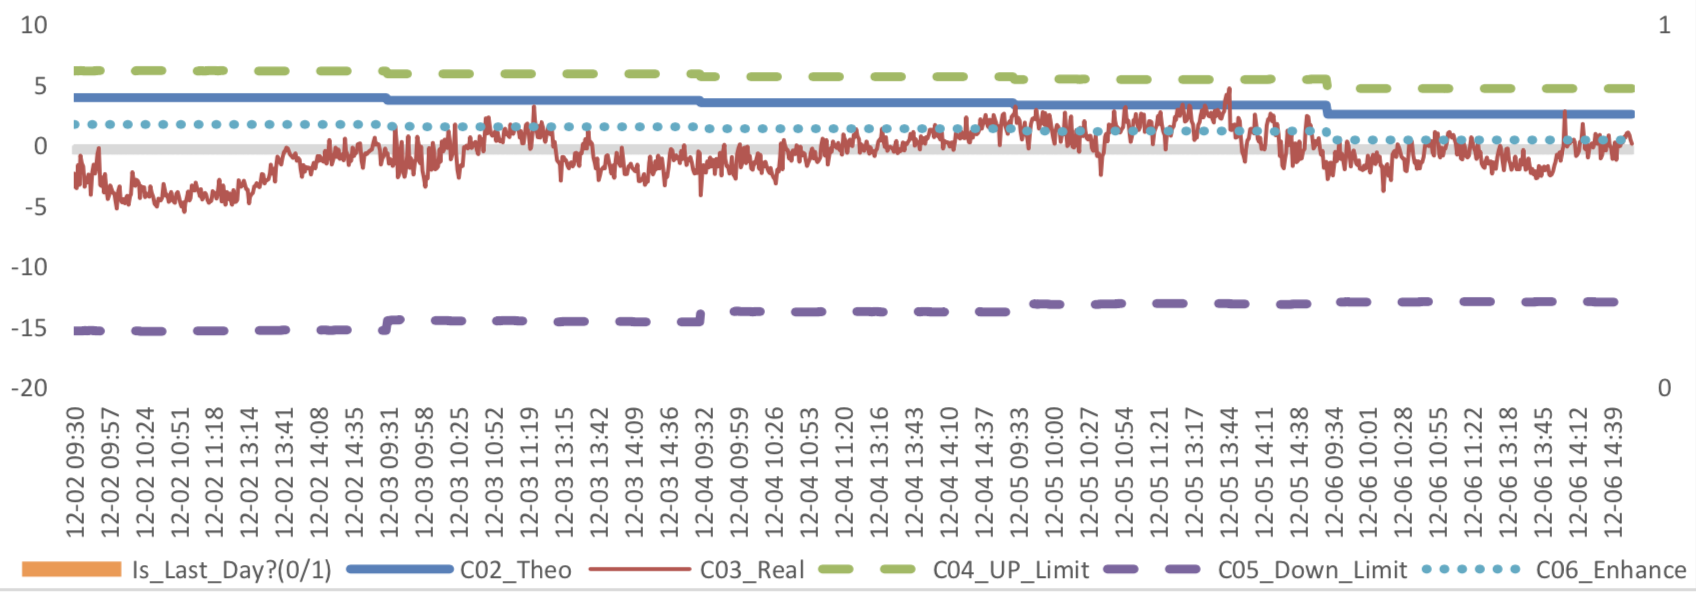
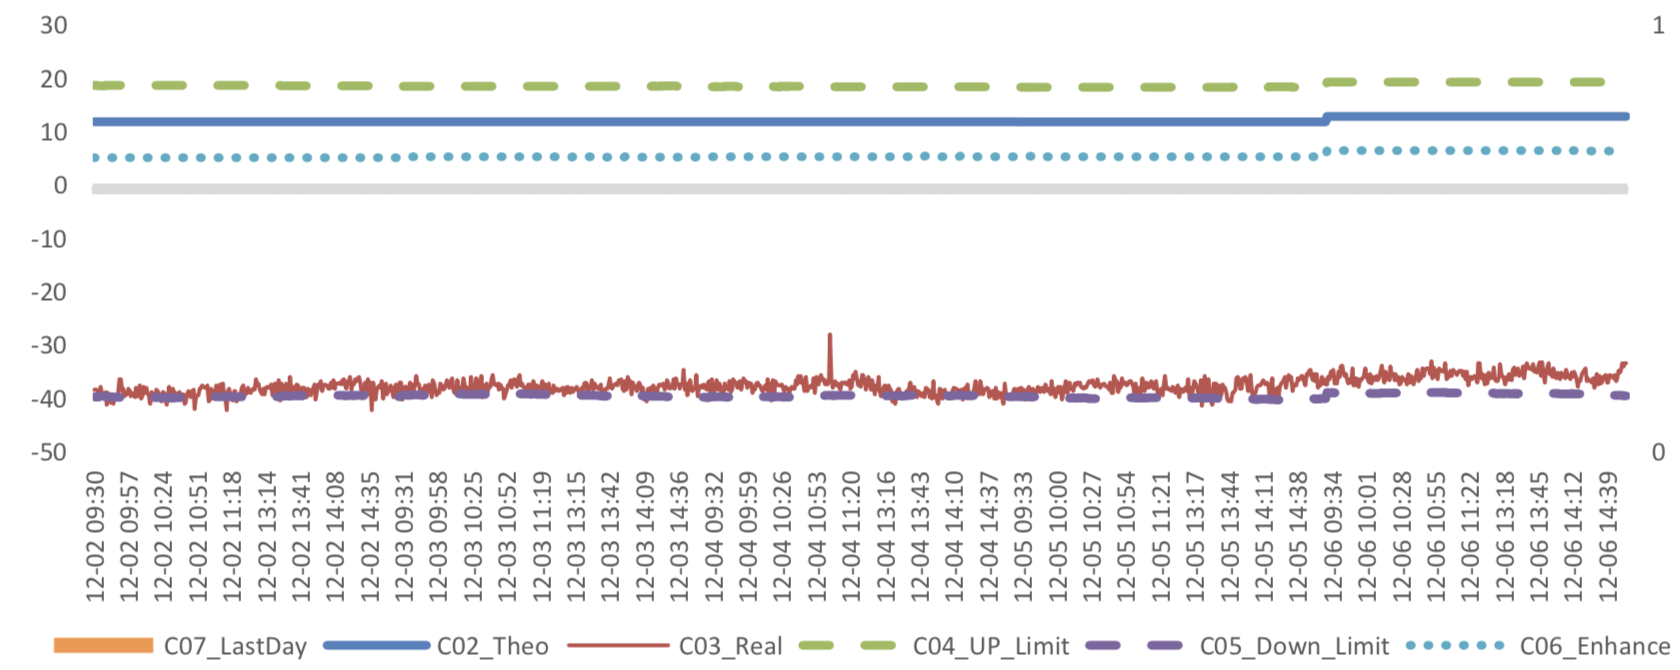
(3) Weekly Review of Future/Spot Arbitrage Opportunity
Assumption: risk-free rate: 3%; security borrowing cost: 8%; trading expense for spot: 0.025%; trading expense for futures: 0.005%; margin rates for futures contracts: 0.11 for CSI300 and SSE50, 0.13 for CSI500; margin rate for security borrowing: 0.3 (or 130% maintain rate).
When real price spread is out of theoretical range (calculated by our assumption), there exists absolute future-spot arbitrage opportunity.
Graph 21: Future (Current Month)-Spot Arbitrage Opportunity for CSI300 contract (in the view of price difference)

Graph 22: Future (Current Month)-Spot Arbitrage Opportunity for SSE50 contract (in the view of price difference)
Graph 23: Future (Current Month)-Spot Arbitrage Opportunity for CSI500 contract (in the view of price difference)

Graph 24: Future (Next Month-Current Month) Arbitrage Opportunity for CSI300 contract (in the view of price difference)

Graph 25: Future (Next Month-Current Month) Arbitrage Opportunity for SSE50 contract (in the view of price difference)

Graph 26: Future (Next Month-Current Month) Arbitrage Opportunity for CSI500 contract (in the view of price
difference)
(4) Roll Spread of Stock Index Futures Tracking
Calculated as the contract price of the current month minus the contract price of the following month, for the long roll, the positive calculation results are gains, the negative calculation results are losses. Code 00 in the figure represents the current month contract, 01 the next month contract, 02 the current quarter contract, 03 the next quarter contract.
(a)IF
Up to2019/12/13,the best roll plan is IF00-IF03,annualized roll yield in monthly term is0.22%。
Graph 27: IF Current month contract roll yield comparison (index point)

Graph 28: IF Current month contract roll yield comparison (annualized return)

(b)IH
Up to 2019/12/13,the best roll plan is IH00-IH01,annualized roll yield in monthly term is0.65%。
Graph 29: IH Current month contract roll yield comparison (index point)

Graph 30: IH Current month contract roll yield comparison (annualized return)

(c)IC
Up to2019/12/13,the best roll plan isIC00-IC03,annualized roll yield in monthly term is5.64%。
Graph 31: IC Current month contract roll yield comparison (index point)

Graph 32: IC Current month contract roll yield comparison (annualized return)

(5) Basis Tracking of Stock Index Futures
For long side, if the base difference is positive, the change of the base difference brings losses, and if the base difference is negative, the change of the base difference brings profits.
(a)IF
For long side hedge, up to 2019/12/13,all IF contracts were in premium. Here IF next month contract basis return annualized yield is -2.64%。
Graph 33: IF contracts basis

Table 1: IF basis return calculation

(b)IH
For long side hedge, up to 2019/12/13,all IH contracts were in discount. Here IH next month
contract basis return annualized yield is 0.49%。
Graph 34: IH contracts basis

Table 2: IH basis return calculation

(c)IC
For long side hedge, up to 2019/12/13,IC00 and IC01 were in premium, other IC contracts were in
discount.. Here IC next month contract basis return annualized yield is -0.79%。
Graph 35: IC contracts basis

Table 3: IC basis return calculation

3. Financial Markets
(1) Interest Rates
The term structure of treasury bonds’ yields is currently upward sloping in concave shape.
Specifically, last week, short-term yields short term yield of Treasury bond experienced some fluctuation and 3M yield now at 2.4%-2.6% level. Furthermore, as for long-term yield, there is a small drop. 10Y yield is about 3.2%-3.4%.
Graph 36: Term Structure Evolvement of Treasury Bonds Yields During Recent 3 Months (%)

As for Shibor rates, short-term rates experienced significant fluctuation. Specifically, O/N rate experienced obvious fluctuation to 1.8%-2.0% level.
Graph 37: Term Structure Evolvement of Shibor Rates During Recent 3 Months (%)

(2) ExchangeRates
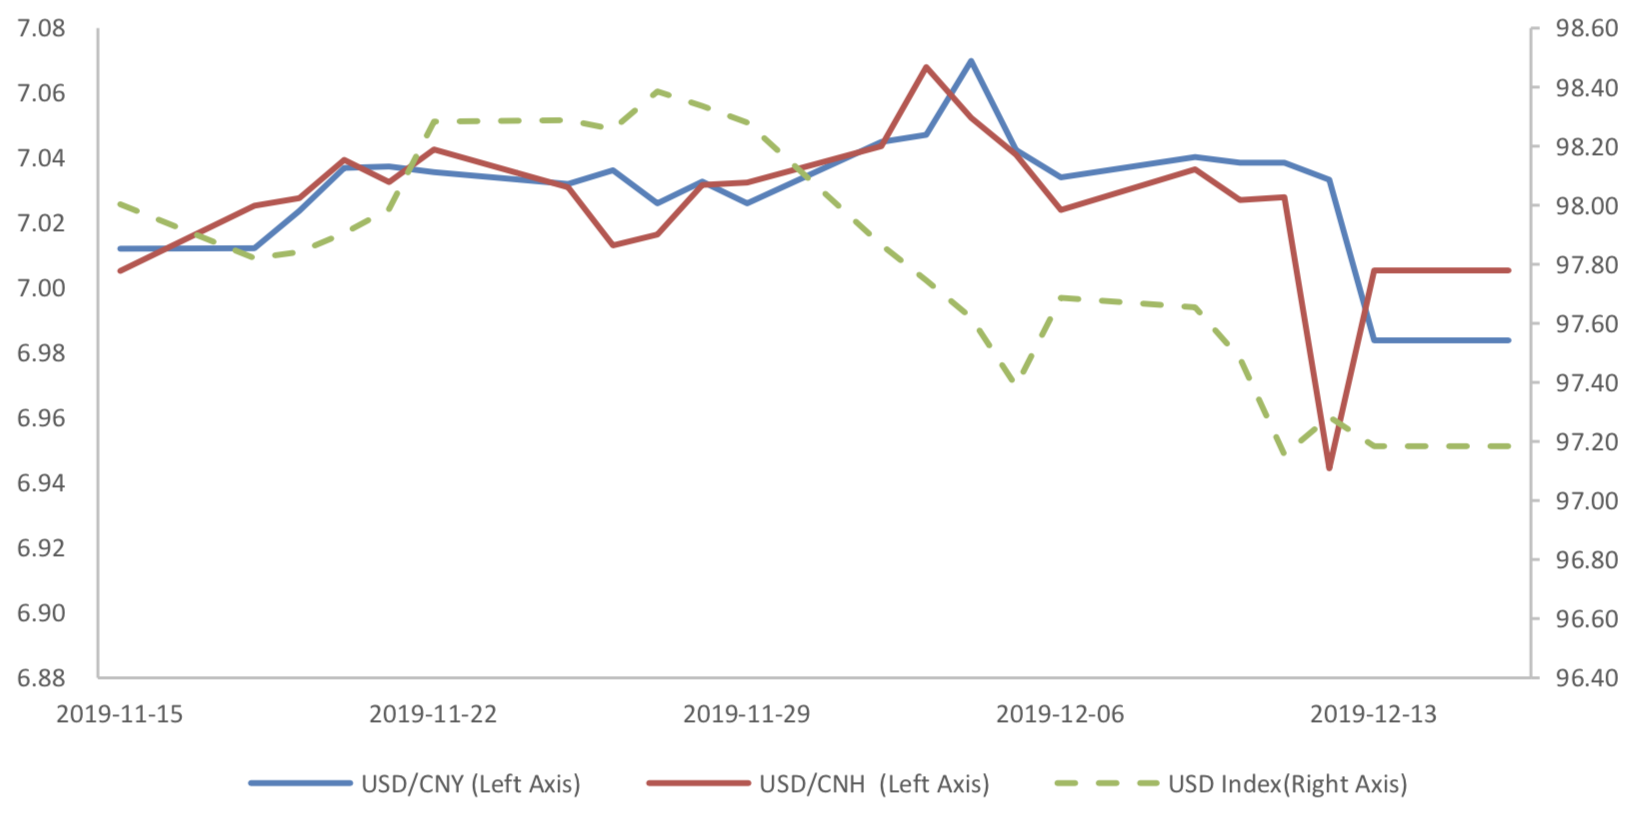
During last week, CNY/USD changed -0.801% to 6.9839 and offshore rate, CNH/USD, changed - 0.44% to 7.0054 and USD index changed -0.48%.
Graph 38: USD/CNY, USD/CNH and USD Index
Macroeconomic Topic(1):
The data show that, in November, the scale of new social financing increased, reached 1754.7 billion yuan, compared with the previous value of 618.9 billion yuan. And the month on month increase was obvious, an increase of 83.5%
November Finance Data
(1) Social Financing Data
Graph A: Total Social Financing Data(100m RMB)

In on-balance-sheet financing, in terms of RMB loans, 1335.1 billion yuan was added in November, rose from 547 billion yuan from last month, and also above than value, 1151 billion, at the same period of last year. New RMB loans accounted for 77.5% of the new social financing scale.
Graph B: On-balance-sheet Financing Data(100m RMB)

From the perspective of new off-balance sheet financing, it still faced an obvious contraction in November. Contraction speed down. In November it report – 106.1 billion yuan, the previous value is – 234.
Graph C: Off-balance-sheet Financing Data(100m RMB)

In terms of the direct financing, the direct financing of enterprises was 322 billion yuan, obviously lower compared with the same period last year, 412 billion, but with the ring ratio increased substantially, 78.7%, mainly because of the increase in corporate bond financing.
Graph D: Direct Financing Data(100m RMB)

(2) Monetary Data
In November, M2 dropped to 8.2%, and M1 dropped from 3.4% to 3.5%, and the difference between M2 and M1 decrease from 5.1% to 4.7%.
Graph E: M1 and M2 data

(3) Summary
In November, the scale of social financing increase while money supply drop in term of M2, the effect of counter-cycle adjustment is obvious. It is worth noting that the deposit of non-bank financial enterprises has improved in the near future, which should be a positive factor for the capital market.
Macroeconomic Topic(2):
According to the released price data by the national bureau of statistics. The data showed that year-on- year CPI kept in high position. PPI is still in deflation region. The data showed that the year-on-year and ring ratio CPI were 4.5 percent and 0.4 percent, respectively, compared with pre value of 3.8 percent and 0.9 percent, respectively. Year-on-year and ring ratio PPI were -1.4 percent and -0.1 percent, respectively, compared with the previous figures of -1.6 percent and 0.1 percent, respectively.
November Price Data
(3) CPI Data
Graph A: CPI Data

The main reason for CPI to reach a new high is still food. Food CPI increased by 19.1% year-on-year, while non-food CPI increased by 1%; while food CPI continued to rise due to the rise of pig price, which rose by 110.2% and reached a new high. However, the price of fresh fruits fell, and the price of eggs and fresh vegetables also rose significantly. Although CPI has reached a new high, the core CPI has remained flat for several months, and the R & D report / macro special report issued in November is now down to 1.4%, with the previous value of 1.5%.
Graph B: year-on-year CPI: by Food, Non-Food, Core, Services, Consumer Goods (%)

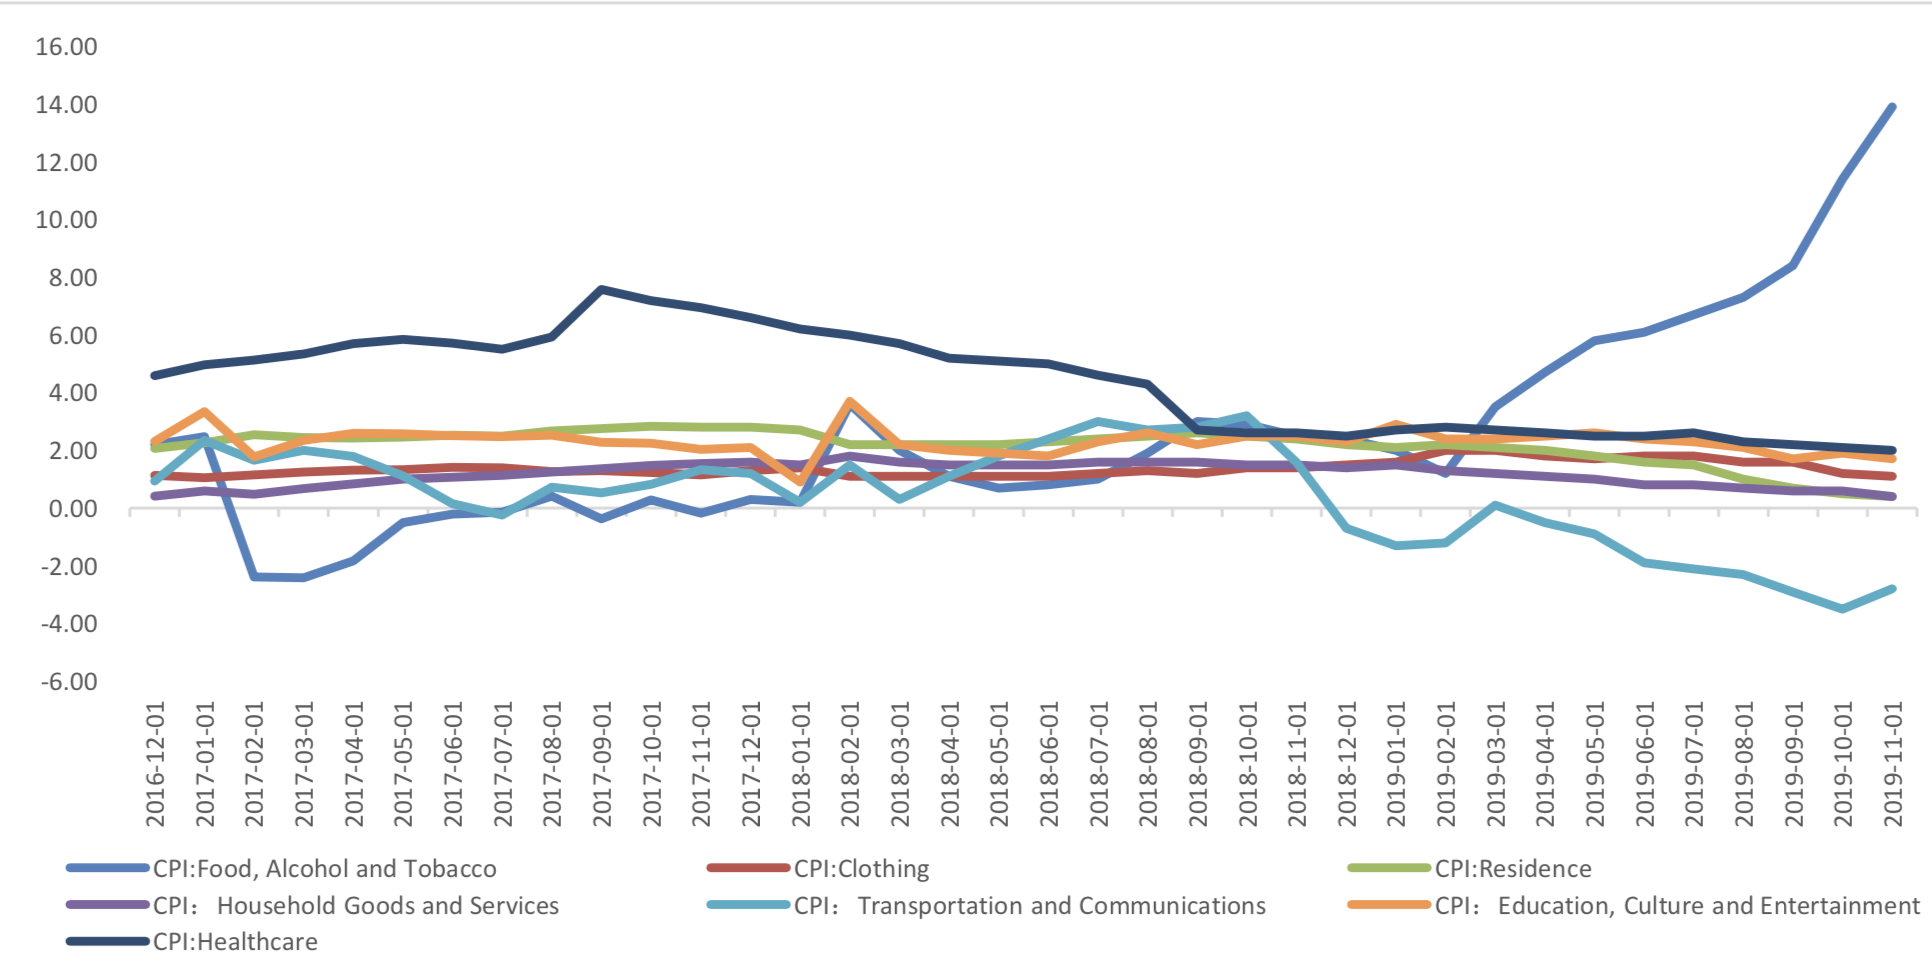
Residence, education, culture and entertainment, healthcare, household goods and service prices rose slightly, with growth rates of 0.4%, 1.7%, 2.0% and 0.4% respectively. Transportation and communication dropped 2.8%
Graph C: year-on-year CPI: by Food Alcohol and Tobacco, Clothing, Residence, Household Goods & Services, Transportation & Communications, Education, Culture & Entertainment, Healthcare (%)
(4) PPI Data
Graph D: PPI Data (%)

The means of production PPI was -2.5 percent year-on-year, increased 0.1 percentage point from the previous month. The means of livelihoods PPI, was 1.6 percent, compared with the previous value of 1.4 percent.
Graph E: PPI Data, by means of production and means of livelihoods

(3) Summary
Prices hit a new high in November, which is still a situation of pig price disruption. However, the core CPI fell and PPI continued to fall. The price problem should not constitute the main fetter of countercyclical regulation. As the Spring Festival is approaching, the price of pigs will remain high. In the short term, we should pay attention to the transmission effect of pig price on other prices. The new formulation of "maintaining stability" put forward at the recent meeting of the Political Bureau of the Central Committee may have the intention of maintaining price stability as well as social stability.
Currently no Comments.
Hot Topics
The 13rd China International Future Forum
The Shanghai Derivatives Energy Forum has received extensive attention from relevant industries both within and outside the borders.
Financial institutions deep explore commodity market opportunities, commodity index financial products show full-scale trend
R-Code for analysis: getKDJ
R-Code@June 06, 2016
New indicator to analyze the arbitrage opportunities between sse50 and csi500
Market review: January 11, 2017
The Great China Bubble: Anniversary Lessons and Outlook
Quant Investment in China A-share market
The hedge strategy between SSE50 and A50--Jan 13,2017
The arbitraging strategy between CSI300 and SSE50
Market review: June 17, 2016
Sleepless in London--Enda Homan(Allied Irish Banks Plc)
MSCI Rebuffs Chinese Equities for Third Time in Blow to Xi
Soros, Druckenmiller among hedgies profiting in market plunge