FangQuant › Financial Futures
Market Summary:
Last week, there was generally increase over the market. SSE Composite Index (000001.SH) changed 1.39 % to 2912.01. Specifically, small cap shares perform better than large cap shares and we can observe that CSI500 did better than SSE50 (2.36% vs 1.56%). The average daily turnover of the whole market during past 5 trading days is 375.77 billion CNY, it increased 2.75% compared with the previous 5-trading day period.
In November, the foreign exchange reserve was 3095.591 billion US dollars, the former value was 3105.16 billion US dollars, a decrease of 9.569 billion US dollars on a month on month basis; at the end of November, the gold reserve was 62.64 million ounces (about 1948.32 tons), the same as last month. According to SAFE: in November, the supply and demand of China's foreign exchange market remained basically balanced, and the market was expected to be generally stable. The scale of foreign exchange reserves increased by 22.9 billion US dollars, or 0.7% compared with the beginning of the year. Valuation factors such as exchange rate conversion and asset price changes were the main factors affecting the scale of foreign exchange reserves in that month.
Foreign funds kept flowing in A-shares. During last week the total foreign fund flow via Stock Connect is 20.55 billion RMB, and the cumulative inflows was 941.03 billion RMB, creating a new high.
As for arbitrage opportunity, CSI300 futures current-month contracts show some room for arbitrage opportunities. Price spread for CSI500 next-month/current month contracts show room for arbitrage.
News:
(1) Securities Daily: in recent years, the delisting system of China's A-share market has been continuously improved. At present, * ST Boyuan, Xintai electric and * ST Changsheng have been delisted. With the deepening reform of the capital market, the market ecology of entry and exit is gradually forming.
(2) Securities Times: the introduction of MOM policy will introduce more medium and long-term funds to the capital market, promote the division and cooperation of capital management institutions, and have positive significance in reducing the threshold of investors' diversified asset allocation.
(3) 21st century economic report: a number of financial practitioners said that the recent increase in the publicity of deposit insurance by the regulatory authorities is also related to the recent increase in the risk of financial markets in some regions, especially the frequent rumors of difficulties in cashing in some small and medium-sized banks. Strengthening the publicity of deposit insurance plays a positive role in stabilizing market sentiment and improving market confidence.
(4) Shenzhen Stock Exchange's stock options pilot trading rules make it clear that when stocks are selected as the subject matter of contracts, they should meet five major conditions: they belong to the underlying of margin trading published by Shenzhen Stock Exchange; the listing time is not less than six months; the daily average fluctuation range of the last six months is not more than three times the daily average fluctuation range of the benchmark index; the daily average number of shareholding accounts in the last six months is not less than 4000 Other conditions stipulated by SZSE.
(5) CSDCC issued the detailed rules for the implementation of the stock option pilot settlement business of Shenzhen Stock Exchange. If an operating institution directly participates in the options settlement business of the company, it shall first apply for the qualification of multilateral net guarantee settlement business. If a non securities company operating institution applies for the qualification of multilateral net guarantee settlement business, it shall not only meet the relevant regulations on the management of settlement participants of the company, but also meet the conditions that the net capital is not less than 300 million yuan.
(6) in November, China's exports (in U.S. dollars) fell 1.1% year-on-year, with an expected increase of 0.6% and a decrease of 0.9% in the previous value; its imports increased by 0.3%, with an expected decrease of 1.7% and a decrease of 6.4% in the previous value; its trade surplus was 38.73 billion US dollars, with a previous value of 42.81 billion US dollars. In November, China's exports (in RMB) increased 1.3% year-on- year, with an expected increase of 1.9% and a previous increase of 2.1%; imports increased 2.5%, with an expected increase of 0.9% and a previous decrease of 3.5%; and the trade surplus was 274.21 billion yuan, narrowed by 4.1%. General Administration of Customs: since this year, the growth of international economic and trade has slowed down, China's economic operation has been generally stable, steady and progressive, and foreign trade has maintained a good resilience. In November, the growth rate of China's import and export has accelerated by 2.2 percentage points compared with that in October, among which the import has increased from a decline to a rise, with a growth rate of 2.5% in that month, reflecting the improvement of domestic demand. In the first 11 months, the EU, ASEAN and the United States were the top three trading partners of our country, among which the total value of foreign trade between China and the EU and ASEAN was 4.4 trillion yuan and 3.98 trillion yuan, up 7.7% and 12.7% year on year respectively, and the total value of trade between China and the United States was 3.4 trillion yuan, down 11.1% year on year.
1. StockMarket
(1) Indices Performance
During last week, SSE Composite Index (000001.SH) changed 1.39 % to 2912.01, Shenzhen Component Index (399001.SZ) changed 3.09 % to 9878.62, ChiNext Price Index (399006.SZ) changed 3.72 % to 1726.80, CSI 300 INDEX (000300.SH) changed 1.93 % to 3902.39, CSI SmallCap 500 index (000905.SH) changed 2.36 % to 5010.51, SSE 50 Index (000016.SH) changed 1.56 % to 2939.82.
Graph 1: Indices Performance over past 3 months

The average daily turnover of the whole market during past 5 trading days is 375.77 billion CNY, it increased 2.75% compared with the previous 5-trading day period.
Graph 2: Market turnover

(2) Sectors Performance
In the view of sectors, during last week (from 2019-11-29 to 2019-12-06), 18 of 24 Wind Level- 2 sector(s) increased while 6 sector(s) dropped. Specifically, Semiconductors & Semiconductor Equipment (8.90%), Technology Hardware & Equipment(5.16%) and Software & Services(4.07%) did the best performance while Health Care Equipment & Services(-1.00%), Pharmaceuticals & Biotechnology(-0.77%) and Food & Staples Retailing (-0.38%) did the worst performance.
Graph 3: Sectors performance under Wind Level-2 classification (%)

(3) Indices Valuation (TTM)
The current PE for SSE Composite Index, Shenzhen Component Index, GEM Index, CSI300, SSE50, CSI500 are 12.6743, 23.8658, 52.7665, 11.7937, 9.4339, 26.2152respectively; and these indices are at 14.10%, 30.80%, 63.40%, 20.50%, 18.20%, 31.00% percent rank level of their historic data, respectively
Graph 4: PE of 6 indices

Graph 5: PE percent rank of 6 indices (calculated by data of past 1200 trading days, only 1Y data is presented on the graph)

The current PB for SSE Composite Index, Shenzhen Component Index, GEM Index, CSI300, SSE50, CSI500 are 1.5185,2.6827,4.7397,1.5190,1.2443, 2.0682respectively, and these indices are at 32.10%, 30.10%, 38.60%, 52.20%, 55.70%, 15.30% percent rank level of their historic data, respectively.
Graph 6: PB of 6 indices

Graph 7: PB percent rank of 6 indices (calculated by data of past 1200 trading days, only 1Y data is presented on the graph)

(4) Foreign Fund Flow
Last week, there were 5 trading days for northward channel open for stock connect programs. During last week the total foreign fund flow via Stock Connect is 20.55 billion RMB, and the cumulative inflows was 941.03 billion RMB. Specifically, the fund flow via Shanghai-Hong Kong Stock Connect is 7.54 billion RMB and the fund flow via Shenzhen-Hong Kong Stock Connect is 13.01 billion RMB.
Graph 8: Fund flow via both Shanghai and Shenzhen-Hong Kong Stock Connect in past 1M (100 million CNY)

Graph 9: Fund flow via Shenzhen-Hong Kong Stock Connect in past 1M (100 million CNY)

Graph 10: Fund flow via both Shanghai-Hong Kong Stock Connect in past 1M (100 million CNY)

2. Index Futures
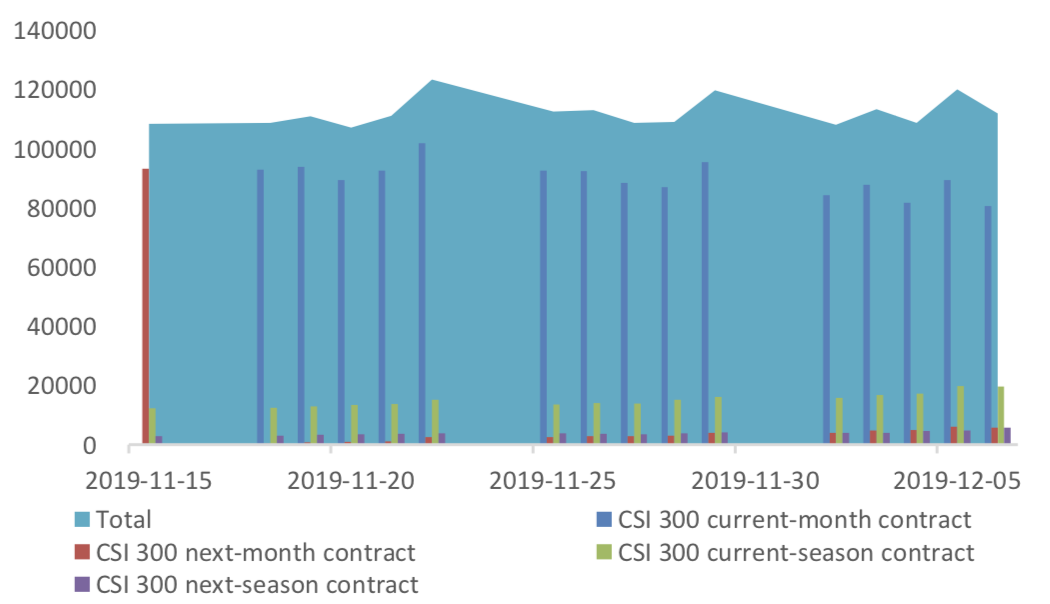
(1) Trading Volume and Open Interests
During past 5 trading days the average trading volume for CSI300(IF), SSE50(IH), CSI500(IC) contracts
are 75467 (-5.06%, the previous 5-trading day period),27255 (-13.26%),84989 (0.86%) lots, respectively. On the last trading day, the total open interests for them are 111866 (-6.58%),56210 (-12.28%),170954 (0.62%) lots respectively.
Graph 11: CSI300 Index futures’ trading volume

Graph 12: CSI300 Index futures’ open interests
Graph 13:SSE50 Index futures’ trading volume

Graph 14: SSE50 Index futures’ open interests

Graph 15: CSI500 Index futures’ trading volume

Graph 16: CSI500 Index futures’ open interests

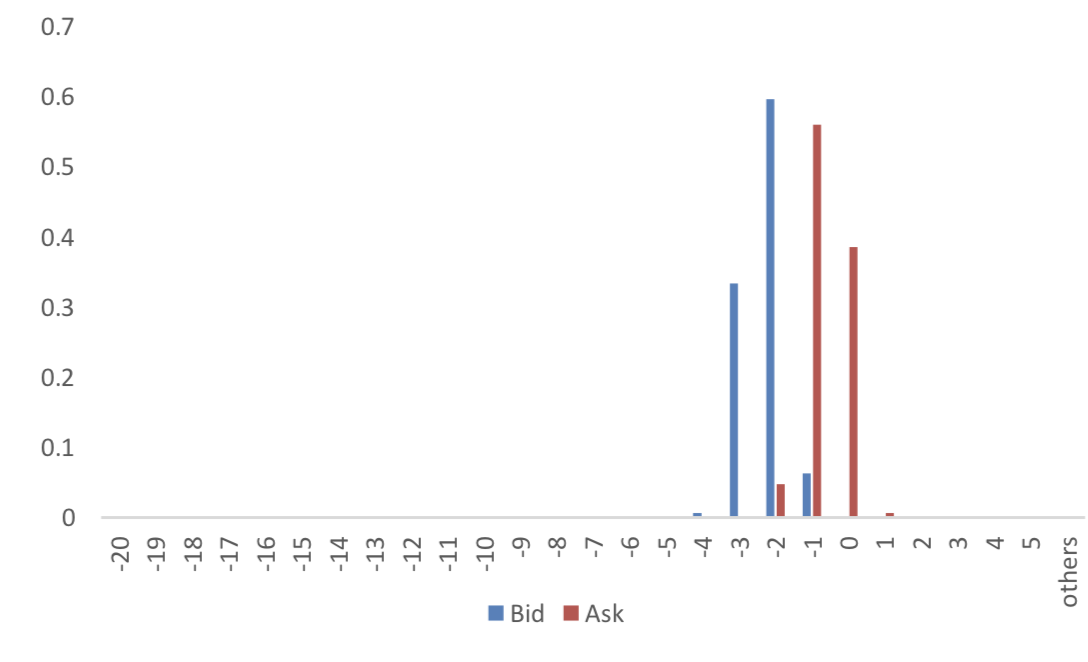
(2) Roll Level Bid-Ask Distribution
There are 5 trading days during last week, so the distribution is worked out with 36005 data points for each contract pair.
Graph 17: CSI300 Current/Next Month Contract Roll Spread Distribution (2s frequency)

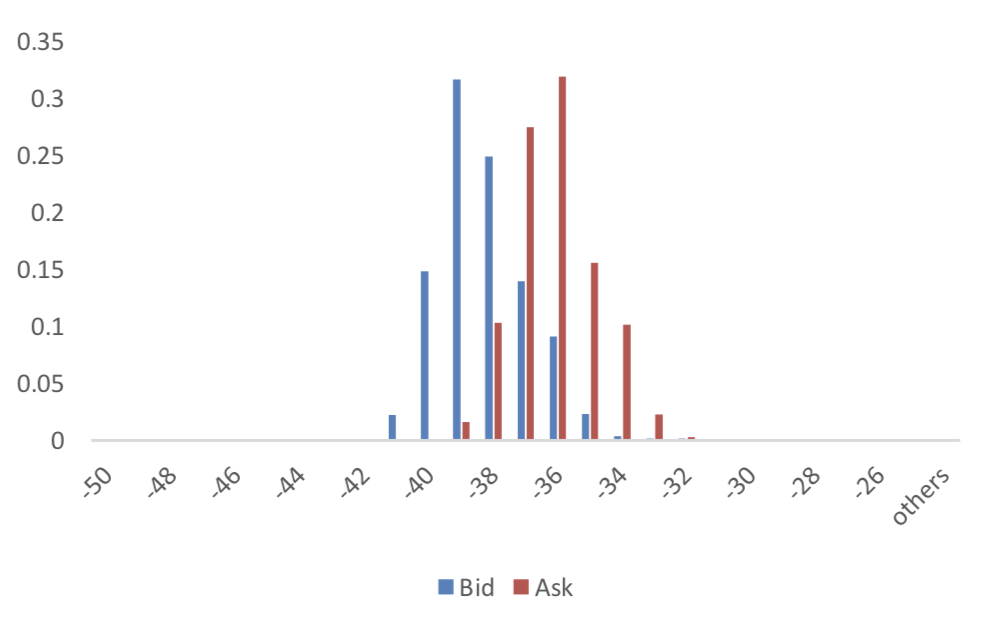
Graph 18: SSE50 Current/Next Month Contract Roll Spread Distribution (2s frequency)
Graph 19: CSI500 Current/Next Month Contract Roll Spread Distribution (2s frequency)
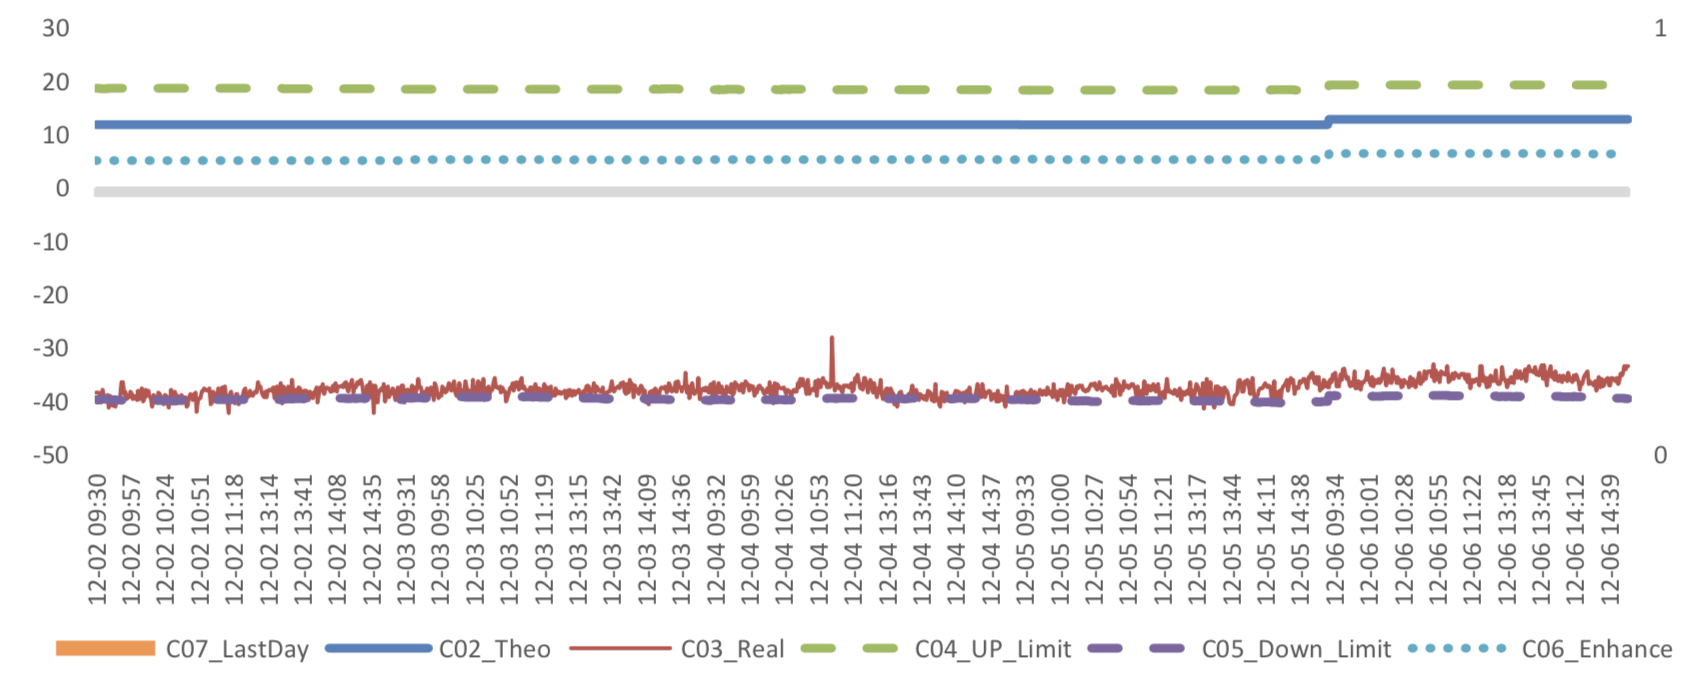
(3) Weekly Review of Future/Spot Arbitrage Opportunity
Assumption: risk-free rate: 3%; security borrowing cost: 8%; trading expense for spot: 0.025%; trading expense for futures: 0.005%; margin rates for futures contracts: 0.11 for CSI300 and SSE50, 0.13 for CSI500; margin rate for security borrowing: 0.3 (or 130% maintain rate).
When real price spread is out of theoretical range (calculated by our assumption), there exists absolute future-spot arbitrage opportunity.
Graph 20: Future (Current Month)-Spot Arbitrage Opportunity for CSI300 contract (in the view of price difference)

Graph 21: Future (Current Month)-Spot Arbitrage Opportunity for SSE50 contract (in the view of price difference)

Graph 22: Future (Current Month)-Spot Arbitrage Opportunity for CSI500 contract (in the view of price difference)

Graph 23: Future (Next Month-Current Month) Arbitrage Opportunity for CSI300 contract (in the view of price difference)

Graph 24: Future (Next Month-Current Month) Arbitrage Opportunity for SSE50 contract (in the view of price difference)

Graph 25: Future (Next Month-Current Month) Arbitrage Opportunity for CSI500 contract (in the view of price
difference)
(4) Roll Spread of Stock Index Futures Tracking
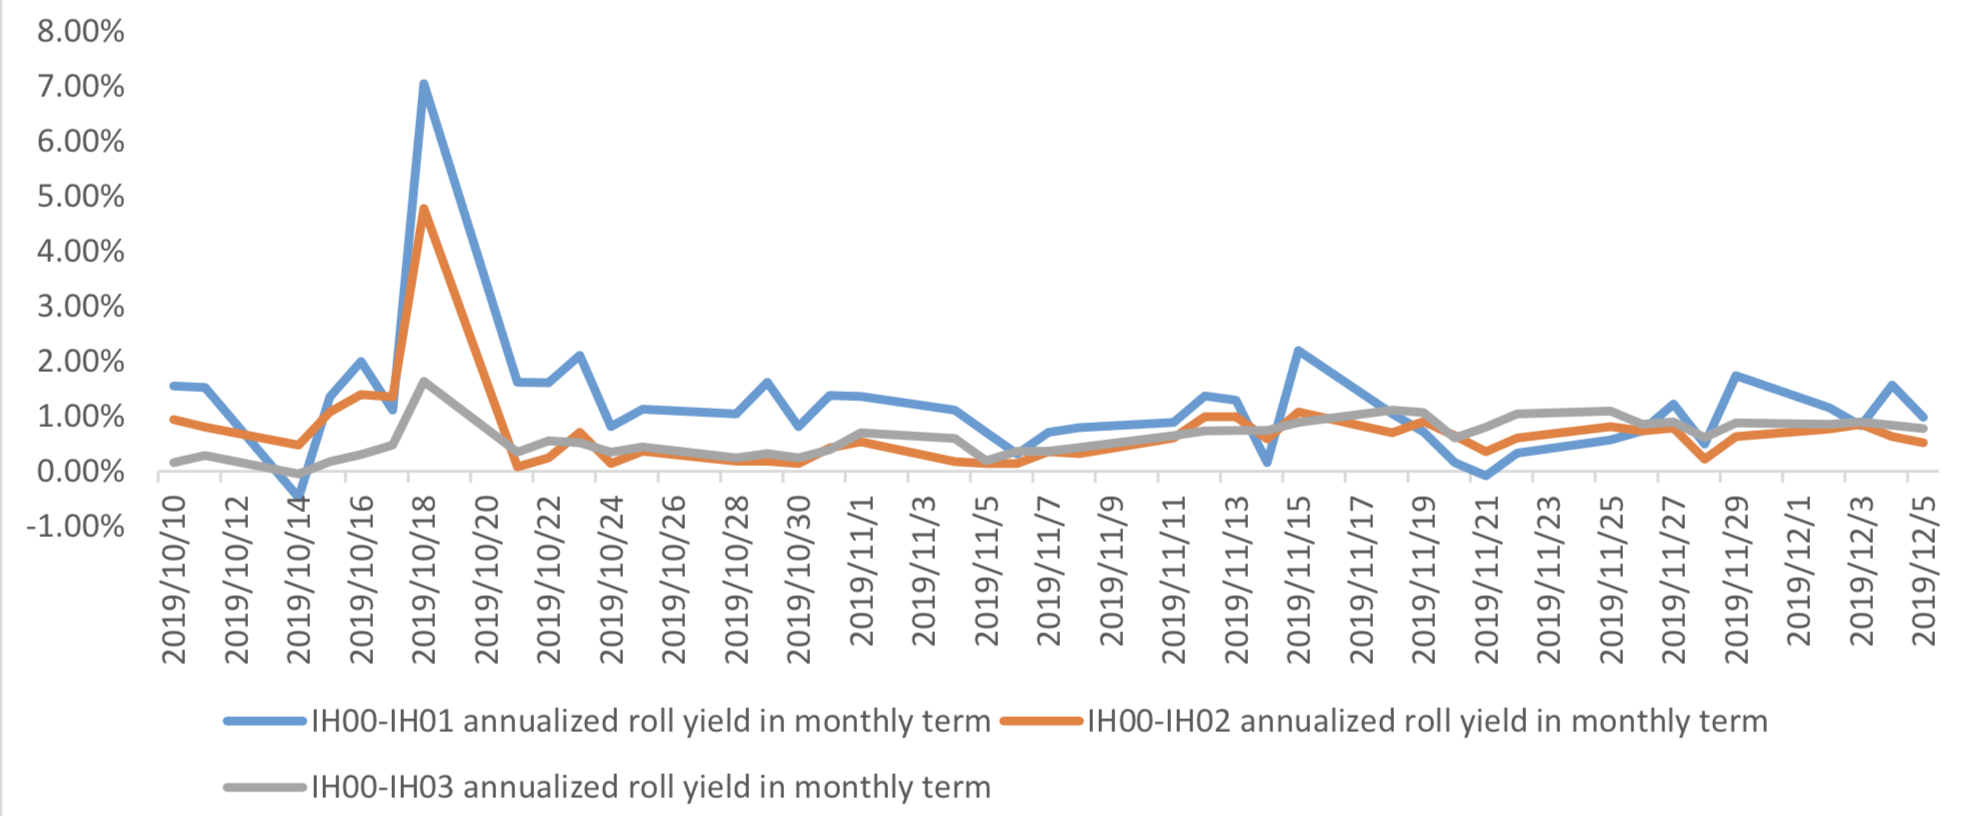
Calculated as the contract price of the current month minus the contract price of the following month, for the long roll, the positive calculation results are gains, the negative calculation results are losses. Code 00 in the figure represents the current month contract, 01 the next month contract, 02 the current quarter contract, 03 the next quarter contract.
(a)IF
Up to2019/12/5,the best roll plan is IF00-IF03,annualized roll yield in monthly term is0.67%.
Graph 26: IF Current month contract roll yield comparison (index point)

Graph 27: IF Current month contract roll yield comparison (annualized return)

(b)IH
Up to 2019/12/5,the best roll plan is IH00-IH01,annualized roll yield in monthly term is0.99%。
Graph 28: IH Current month contract roll yield comparison (index point)

Graph 29: IH Current month contract roll yield comparison (annualized return)
(c)IC
Up to2019/12/5,the best roll plan isIC00-IC01,annualized roll yield in monthly term is9.03%。
Graph 30: IC Current month contract roll yield comparison (index point)

Graph 31: IC Current month contract roll yield comparison (annualized return)

(5) Basis Tracking of Stock Index Futures
For long side, if the base difference is positive, the change of the base difference brings losses, and if the base difference is negative, the change of the base difference brings profits.
(a)IF
For long side hedge, up to 2019/12/5,IF00 and IF01 are in premium, other IF contracts were in discount. Here IF next month contract basis return annualized yield is -0.13%。
Graph 32: IF contracts basis
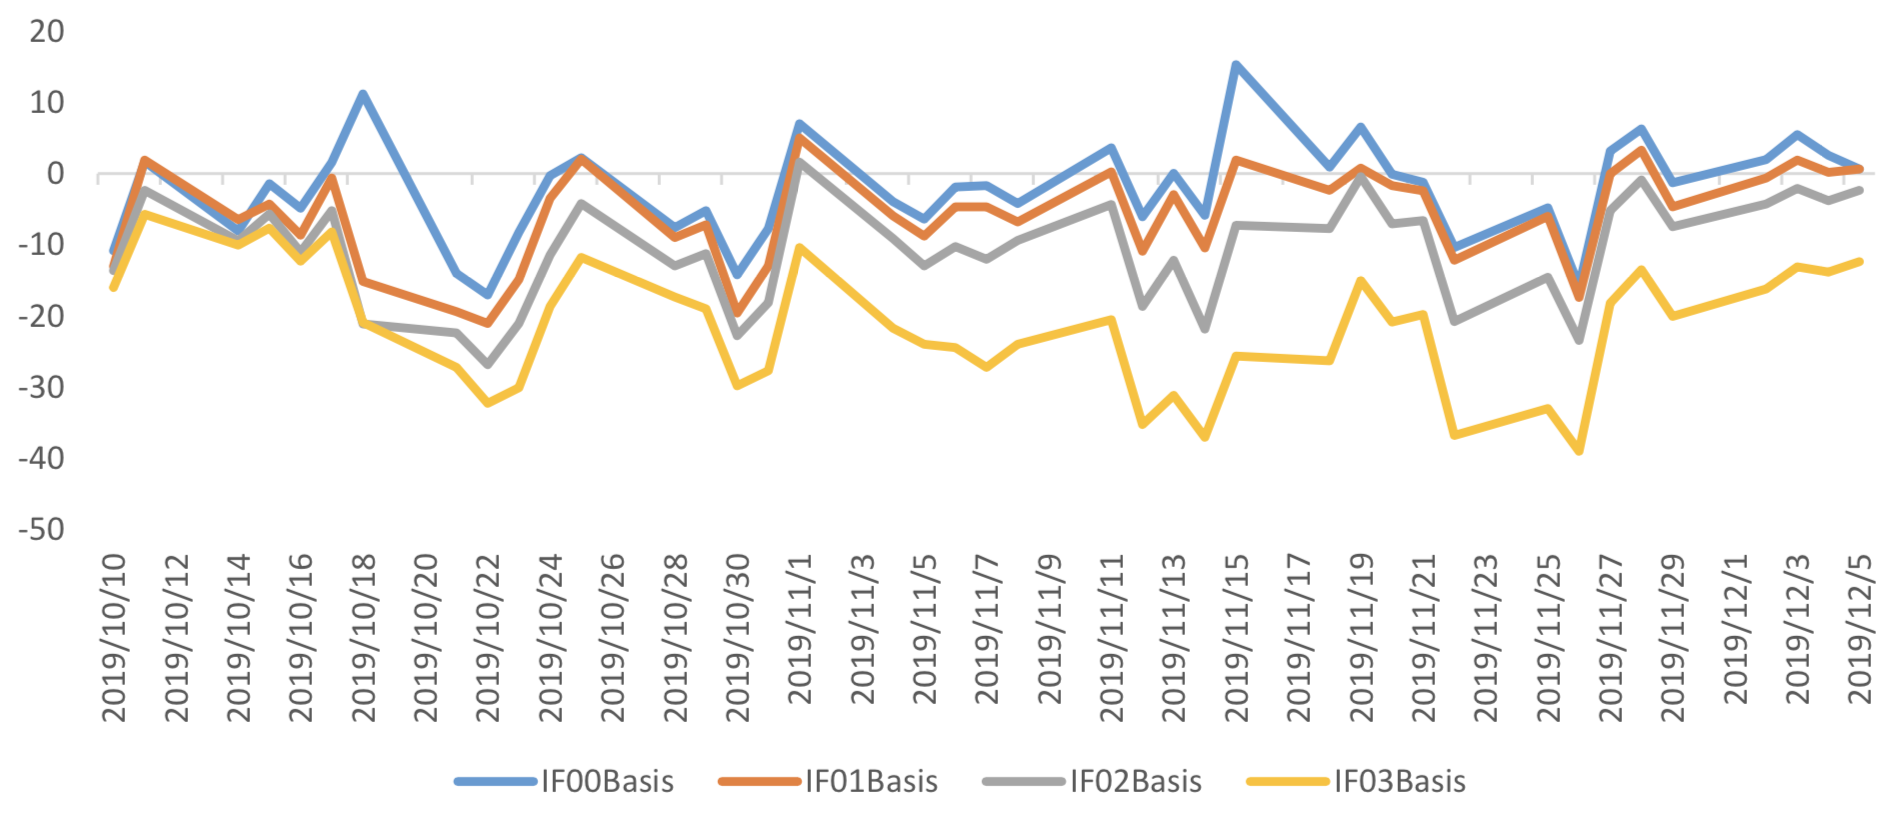
Table 1: IF basis return calculation

(b)IH
For long side hedge, up to 2019/12/5,all IH contracts were in discount. Here IH next month contract
basis return annualized yield is 1.03%。
Graph 33: IH contracts basis
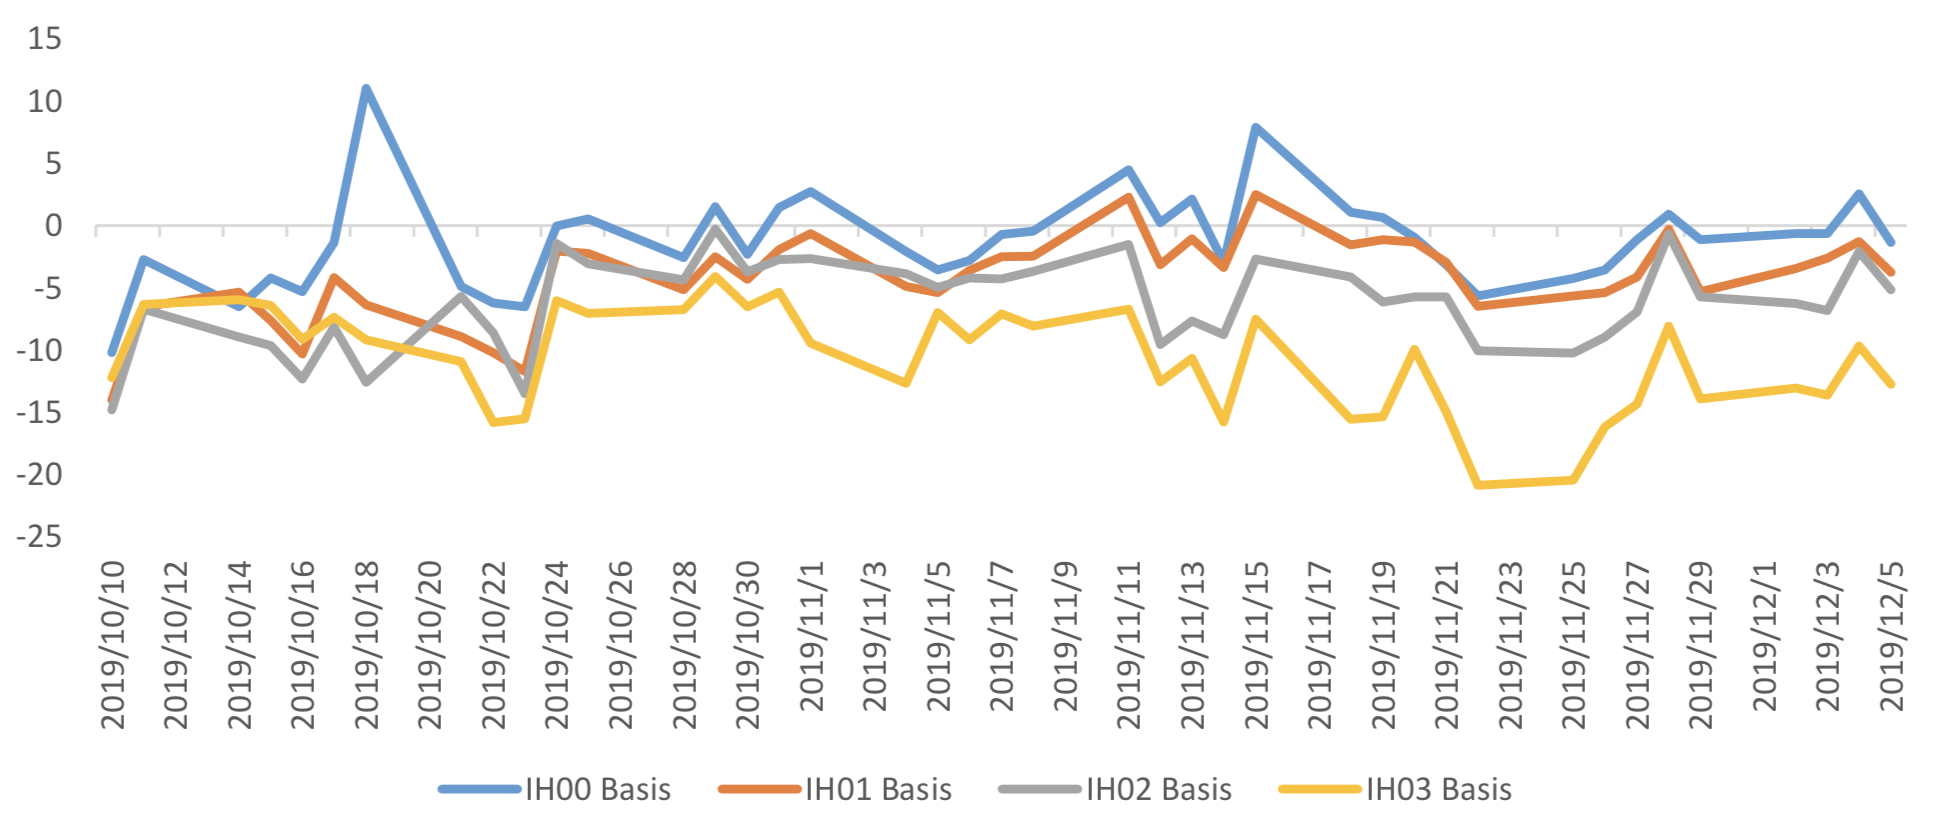
Table 2: IH basis return calculation

(c)IC
For long side hedge, up to 2019/12/5,all IC contracts were in discount.. Here IC next month contract
basis return annualized yield is 7.22%。
Graph 34: IC contracts basis

Table 3: IC basis return calculation

3. Financial Markets
(1) Interest Rates
The term structure of treasury bonds’ yields is currently upward sloping in concave shape.
Specifically, last week, short-term yields short term yield of Treasury bond experienced some fluctuation and 3M yield now at 2.4%-2.6% level. Furthermore, as for long-term yield, there is a small drop. 10Y yield is about 3.2%-3.4%.
Graph 35: Term Structure Evolvement of Treasury Bonds Yields During Recent 3 Months (%)

As for Shibor rates, short-term rates experienced significant fluctuation. Specifically, O/N rate experienced obvious fluctuation to 1.8%-2.0% level.
Graph 36: Term Structure Evolvement of Shibor Rates During Recent 3 Months (%)

(2) ExchangeRates
During last week, CNY/USD changed 0.112% to 7.0340 and offshore rate, CNH/USD, changed -0.12% to 7.0240 and USD index changed -0.60%.
Graph 37: USD/CNY, USD/CNH and USD Index

Currently no Comments.
Hot Topics
The 13rd China International Future Forum
The Shanghai Derivatives Energy Forum has received extensive attention from relevant industries both within and outside the borders.
Financial institutions deep explore commodity market opportunities, commodity index financial products show full-scale trend
R-Code for analysis: getKDJ
R-Code@June 06, 2016
New indicator to analyze the arbitrage opportunities between sse50 and csi500
Market review: January 11, 2017
The Great China Bubble: Anniversary Lessons and Outlook
Quant Investment in China A-share market
The hedge strategy between SSE50 and A50--Jan 13,2017
The arbitraging strategy between CSI300 and SSE50
Market review: June 17, 2016
Sleepless in London--Enda Homan(Allied Irish Banks Plc)
MSCI Rebuffs Chinese Equities for Third Time in Blow to Xi
Soros, Druckenmiller among hedgies profiting in market plunge