FangQuant › Financial Futures
Market Summary:
Last week, there was generally decrease over the market. SSE Composite Index (000001.SH) changed -0.46 % to 2871.98. Specifically, small cap shares perform better than large cap shares and we can observe that CSI500 did better than SSE50 (-0.19% vs -0.94%). The average daily turnover of the whole market during past 5 trading days is 365.73 billion CNY, it decreased 10.38% compared with the previous 5-trading day period.
Foreign funds kept flowing in A-shares. Affected by the formal effect of MSCI expansion, the total net purchase of northbound funds this week was 31.896 billion yuan, the second largest weekly net purchase in history, and also the net purchase for 15 consecutive weeks. In November, northbound capital bought 60.437 billion yuan, the third largest month in history. Though there is some drop over the A-shares, foreign funds still show confidence on it.
As for arbitrage opportunity, CSI500 futures current-month contracts show some room for arbitrage opportunities. Price spread for CSI500 next-month/current month contracts show room for arbitrage.
News:
(1) China Securities Network: Jessie Pak, managing director of FTSE Russell Asia Pacific: the inclusion of China in the global stock index is based on the long-term communication between FTSE Russell and index users, and the analysis made on this basis. FTSE Russell continues to communicate with regulators on the inclusion of a shares after the first stage.
(2) China Securities Journal: Li Zhengqiang, chairman of the board of directors of DCE: we will accelerate the opening up of palm oil, yellow soybean No.1, LLDPE, PP and other varieties, and continue to explore and expand the overseas strategic layout of the exchange; overseas mines and traders have begun to use the price of DCE iron ore futures, gradually carry out the RMB business of iron ore, and take the price of iron ore futures as the pricing benchmark.
(3) China Securities Network: Wang Fenghai, general manager of Shanghai Futures Exchange, said that SHFE would launch low sulfur fuel oil futures in the first quarter of next year; alumina, ferrochrome, refined oil, natural gas and non-ferrous metal index futures are also actively expanding; in terms of options, SHFE should accelerate the launch of options on mature commodity futures, and strive for the launch of crude oil, zinc and aluminum options in the next year; there are futures and options of the color metal index should be listed together.
(4) Xinhua News Agency: Fang Xinghai, vice chairman of China Securities Regulatory Commission: in December, there will also be soda ash futures, PTA, methanol, iron ore, gold options and other five varieties listed; plus 6 commodity futures and 3 commodity options listed in the first 11 months, the number of new varieties listed in 2019 will reach 14, which is the most in China's futures market over the years.
(5) Yi Gang, governor of the people's Bank of China, wrote in the Journal of seeking truth that China's economic growth is still in a reasonable range, inflation as a whole remains at a moderate level, and with the institutional advantages of the socialist market economy, we should maintain normal monetary policy for as long as possible. Even if the monetary policy of the world's major economies approaches to zero interest rate, we should adhere to the principle of seeking progress in stability, making precise efforts, not engaging in competitive zero interest rate or quantitative easing policies, and always adhere to the original mission of monetary policy to maintain the stability of currency value and protect the well-being of the overwhelming majority of the people.
(6) China Securities Journal: Li Haichao, deputy general manager of CFFEX: continue to promote the supply and reserve of more new products, do a solid job in all business preparations and risk control before the listing of stock index options; continue to vigorously develop institutional investors, continue to optimize the policies of commercial banks, public funds, pension funds, QFII and RQFII to participate in the financial futures market; promote the reform of trading mechanism and rule optimization.
1. StockMarket
(1) Indices Performance
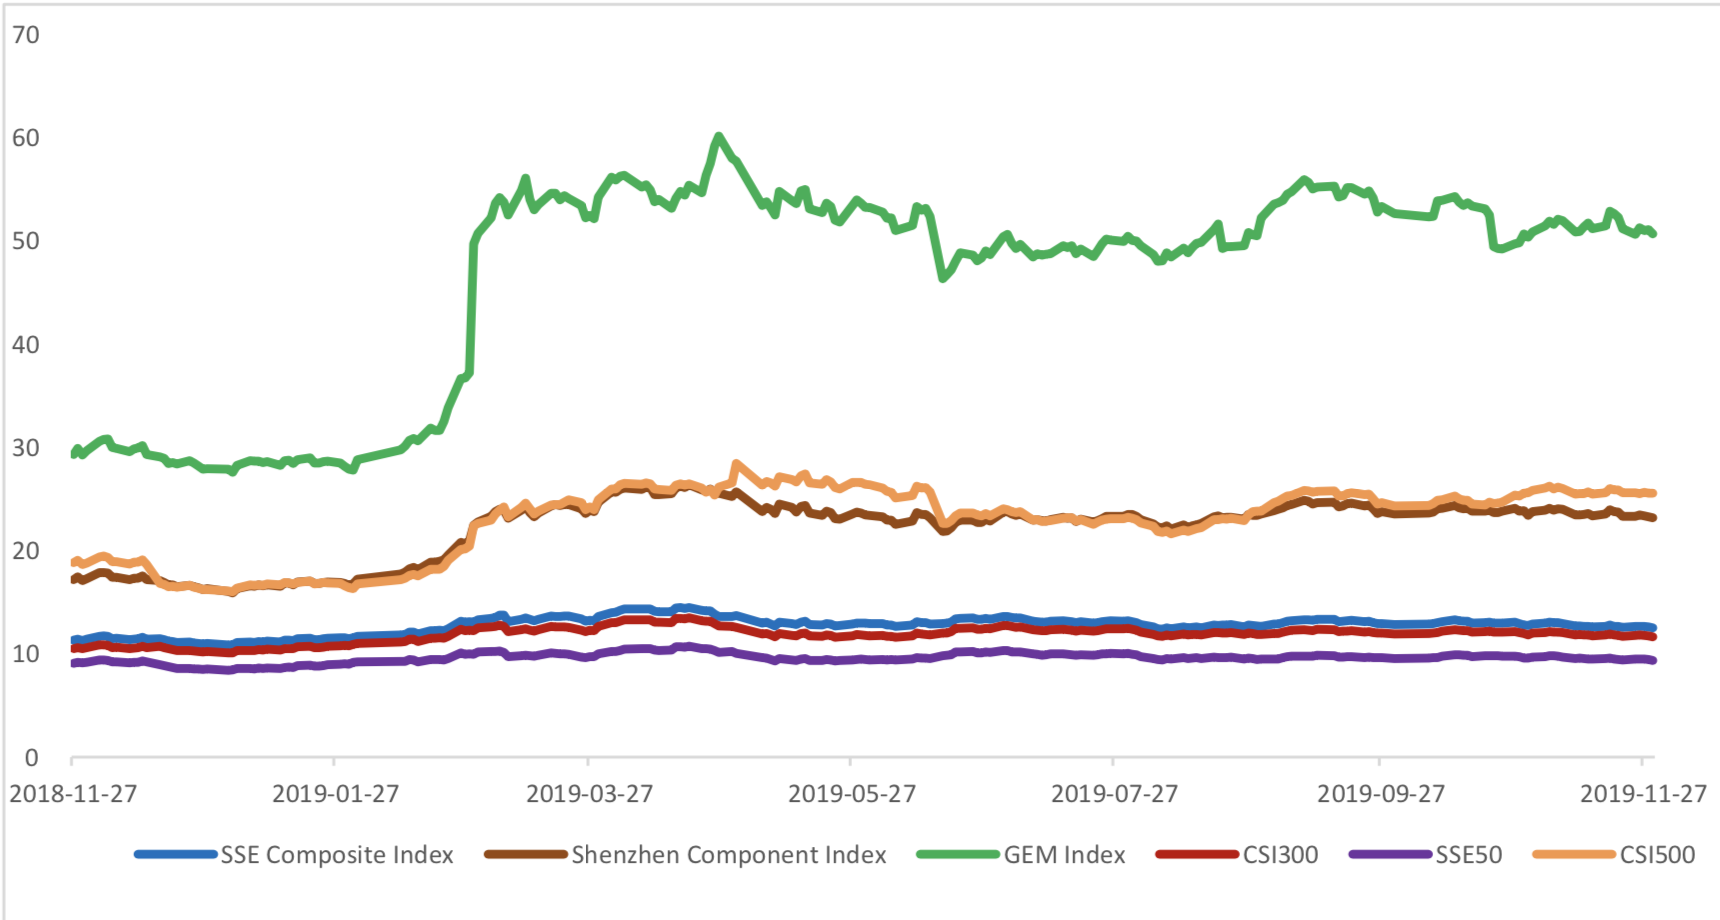
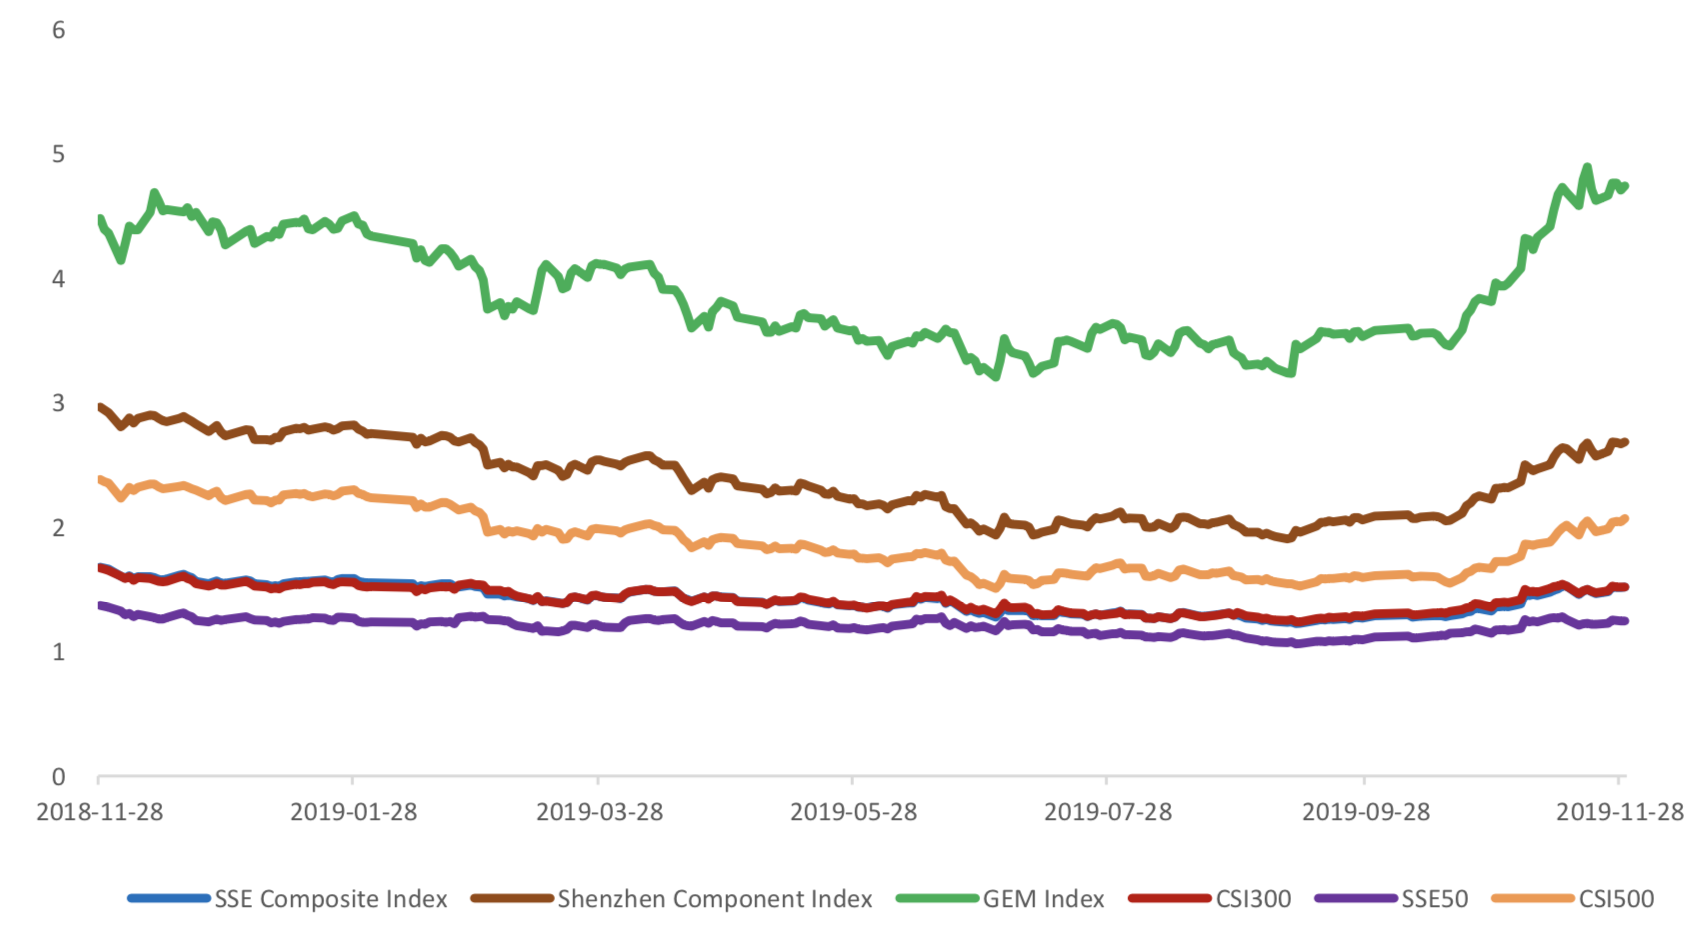
During last week, Shanghai SE Composite Index (000001.SH) changed -0.46 % to 2871.98, Shenzhen Component Index (399001.SZ) changed -0.46 % to 9582.16, ChiNext Price Index (399006.SZ) changed - 0.89 % to 1664.90, CSI 300 INDEX (000300.SH) changed -0.55 % to 3828.67, CSI SmallCap 500 index (000905.SH) changed -0.19 % to 4894.94, SSE 50 Index (000016.SH) changed -0.94 % to 2894.72.
Graph 1: Indices Performance over past 3 months

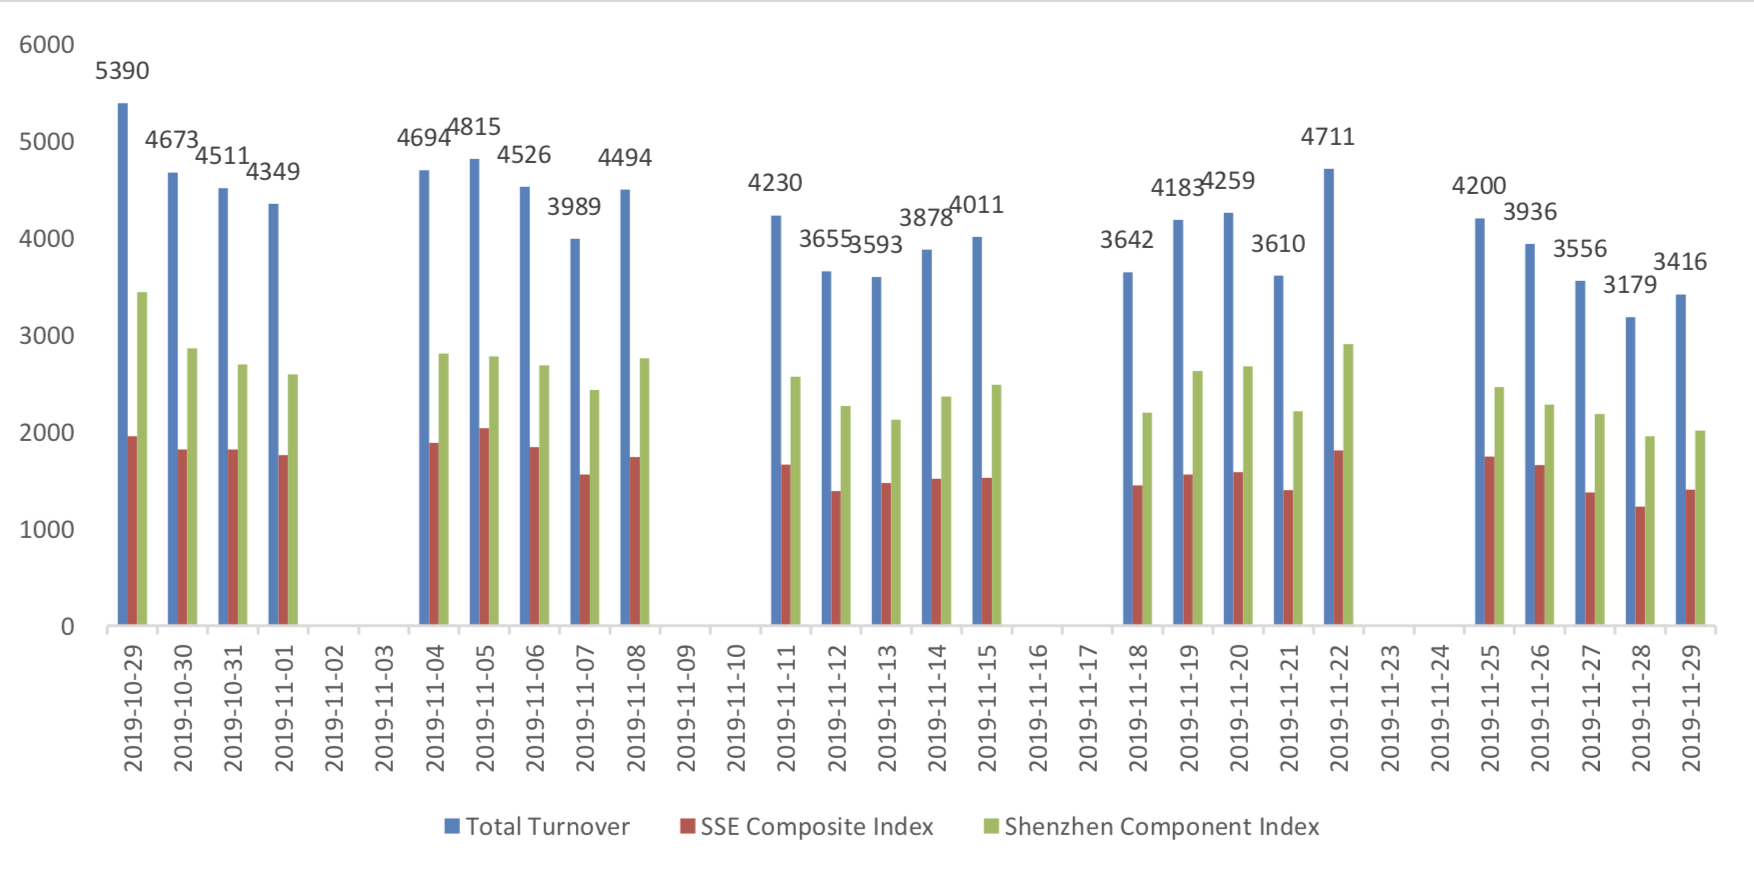
The average daily turnover of the whole market during past 5 trading days is 365.73 billion CNY, it decreased 10.38% compared with the previous 5-trading day period.
Graph 2: Market turnover
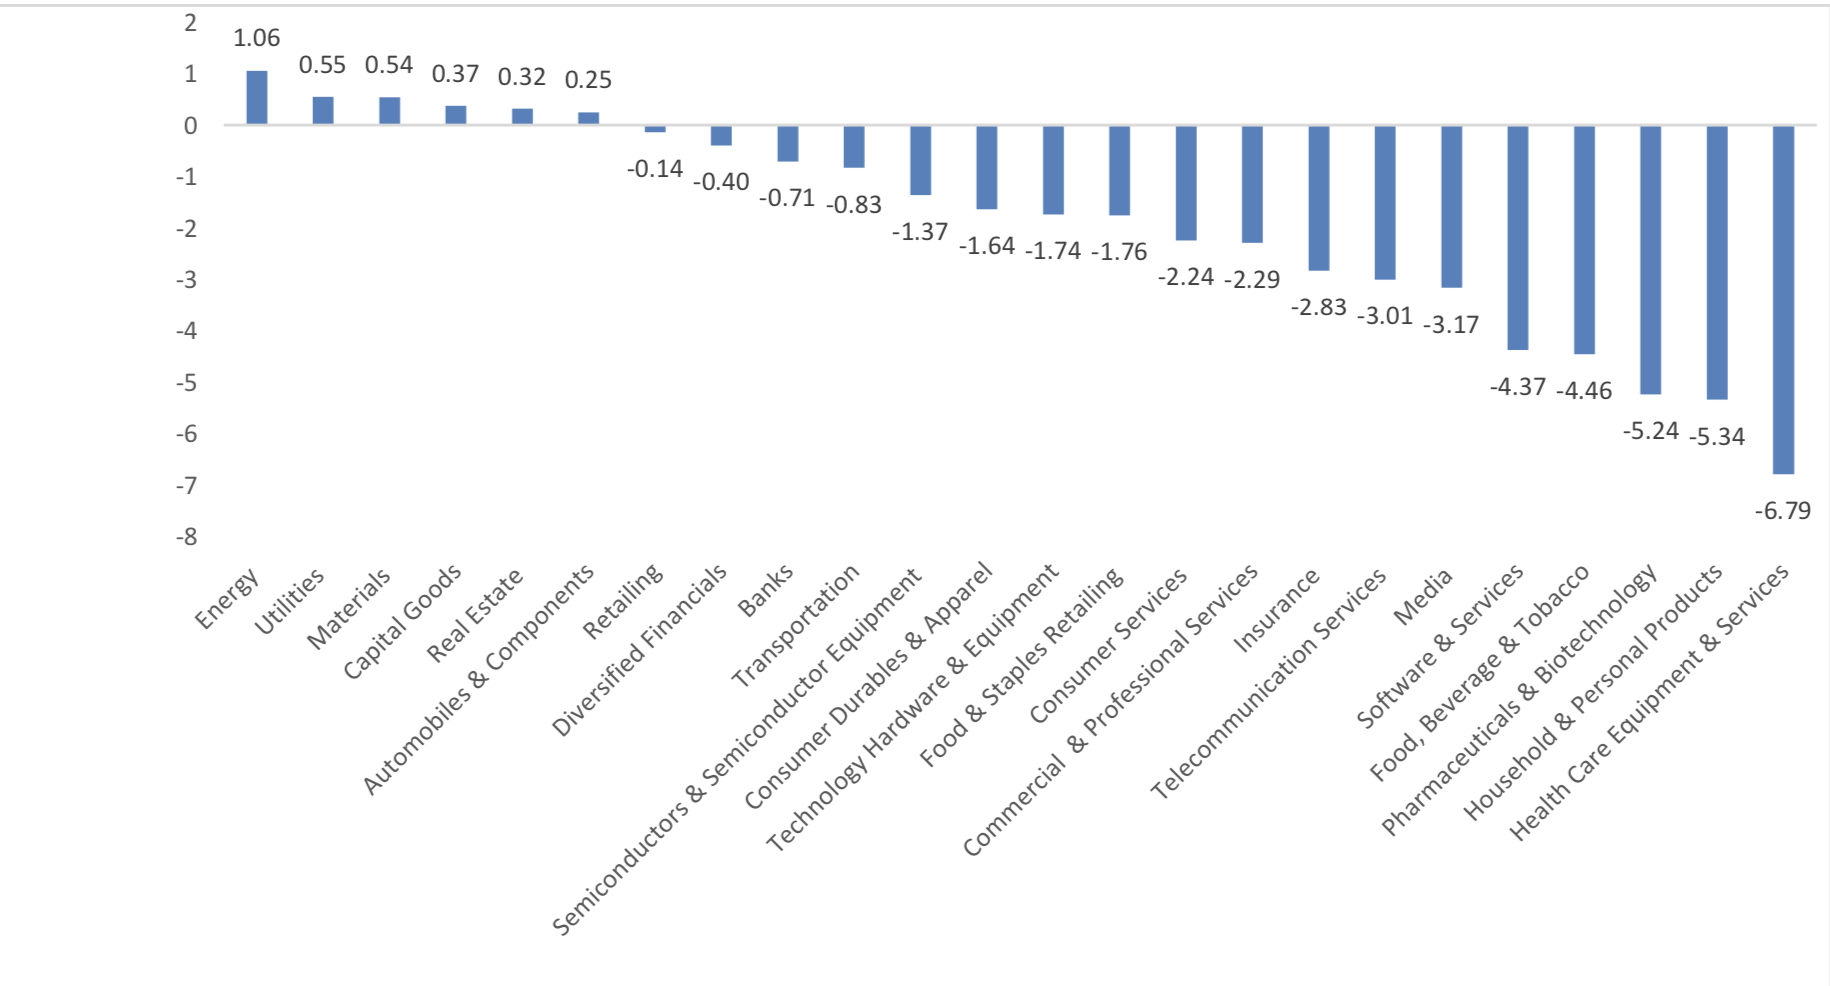
In the view of sectors, during last week (from 2019-11-08 to 2019-11-15), 1 of 24 Wind Level-2 sector(s) increased while 23 sector(s) dropped. Specifically, Semiconductors & Semiconductor Equipment (2.06%), Health Care Equipment & Services(-0.78%) and Pharmaceuticals & Biotechnology(-
1.43%) did the best performance while Consumer Durables & Apparel(-4.99%), Financials(-4.94%) and Retailing(-4.84%) did the worst performance.
Graph 3: Sectors performance under Wind Level-2 classification (%)
(3) Indices Valuation (TTM)
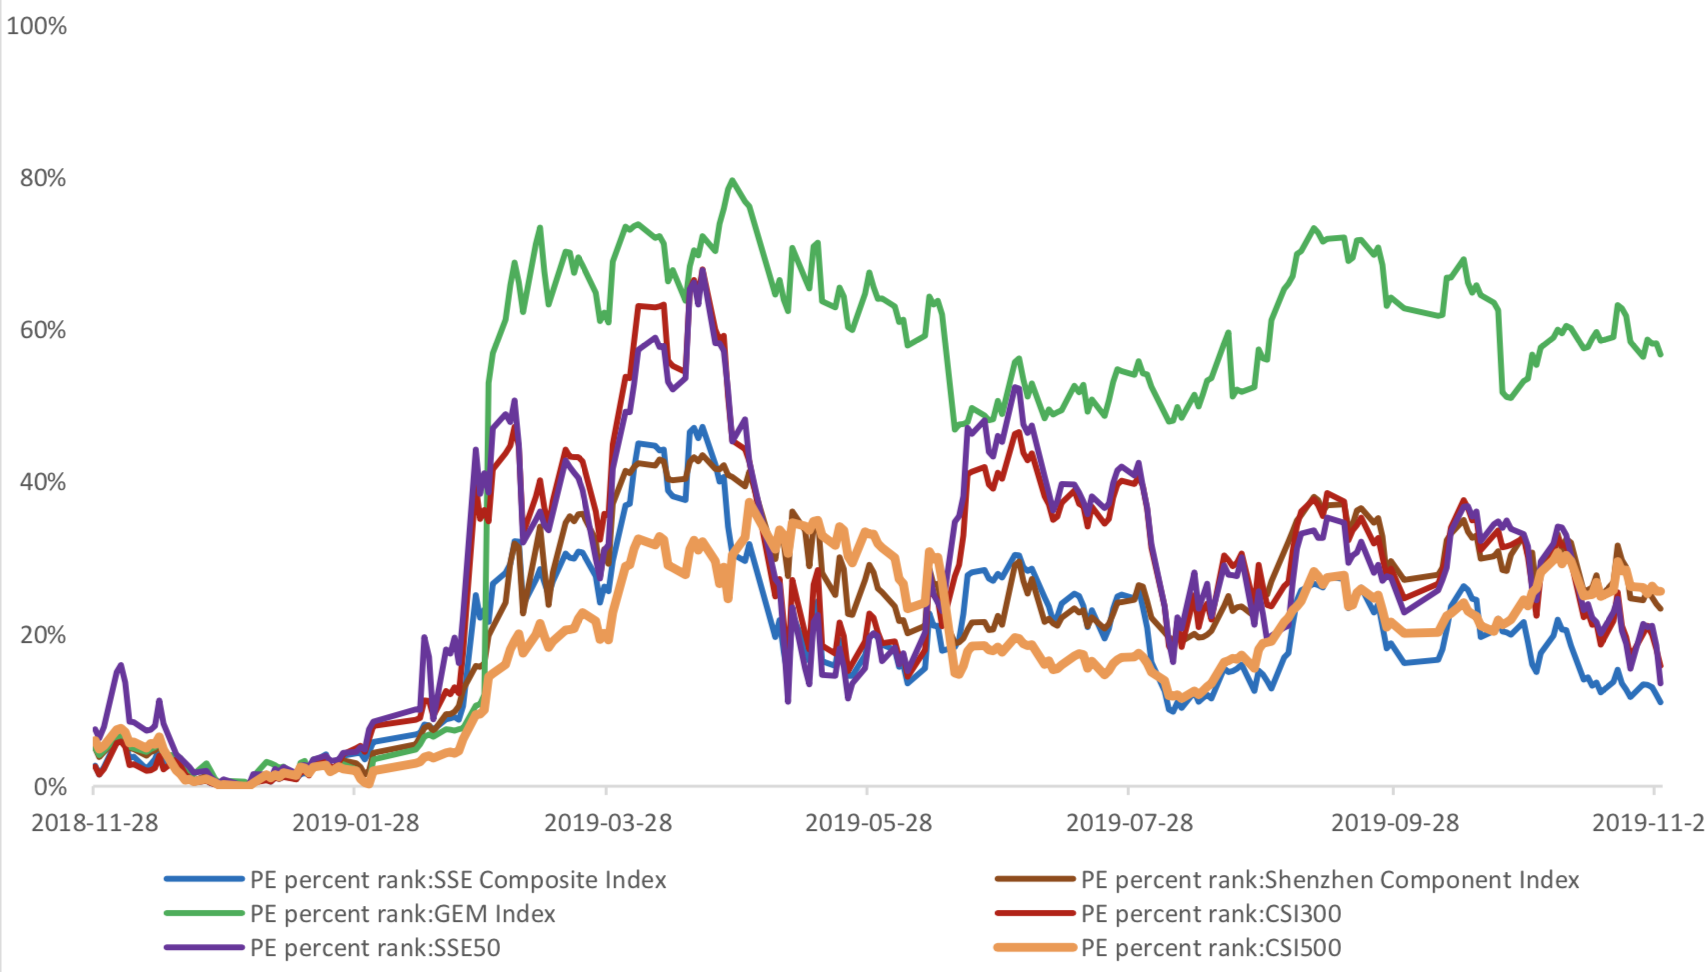
The current PE for SSE Composite Index, Shenzhen Component Index, GEM Index, CSI300, SSE50, CSI500 are 12.5117, 23.1829, 50.6562, 11.6345, 9.3490, 25.5659respectively; and these indices are at 11.00%, 23.30%, 56.70%, 15.80%, 13.50%, 25.60% percent rank level of their historic data, respectively
Graph 4: PE of 6 indices
Graph 5: PE percent rank of 6 indices (calculated by data of past 1200 trading days, only 1Y data is presented on the graph)
The current PB for SSE Composite Index, Shenzhen Component Index, GEM Index, CSI300, SSE50, CSI500 are 1.5185,2.6827,4.7397,1.5190,1.2443, 2.0682respectively, and these indices are at 32.10%, 30.10%, 38.60%, 52.20%, 55.70%, 15.30% percent rank level of their historic data, respectively.
Graph 6: PB of 6 indices
Graph 7: PB percent rank of 6 indices (calculated by data of past 1200 trading days, only 1Y data is presented on the graph)

(4) Foreign Fund Flow
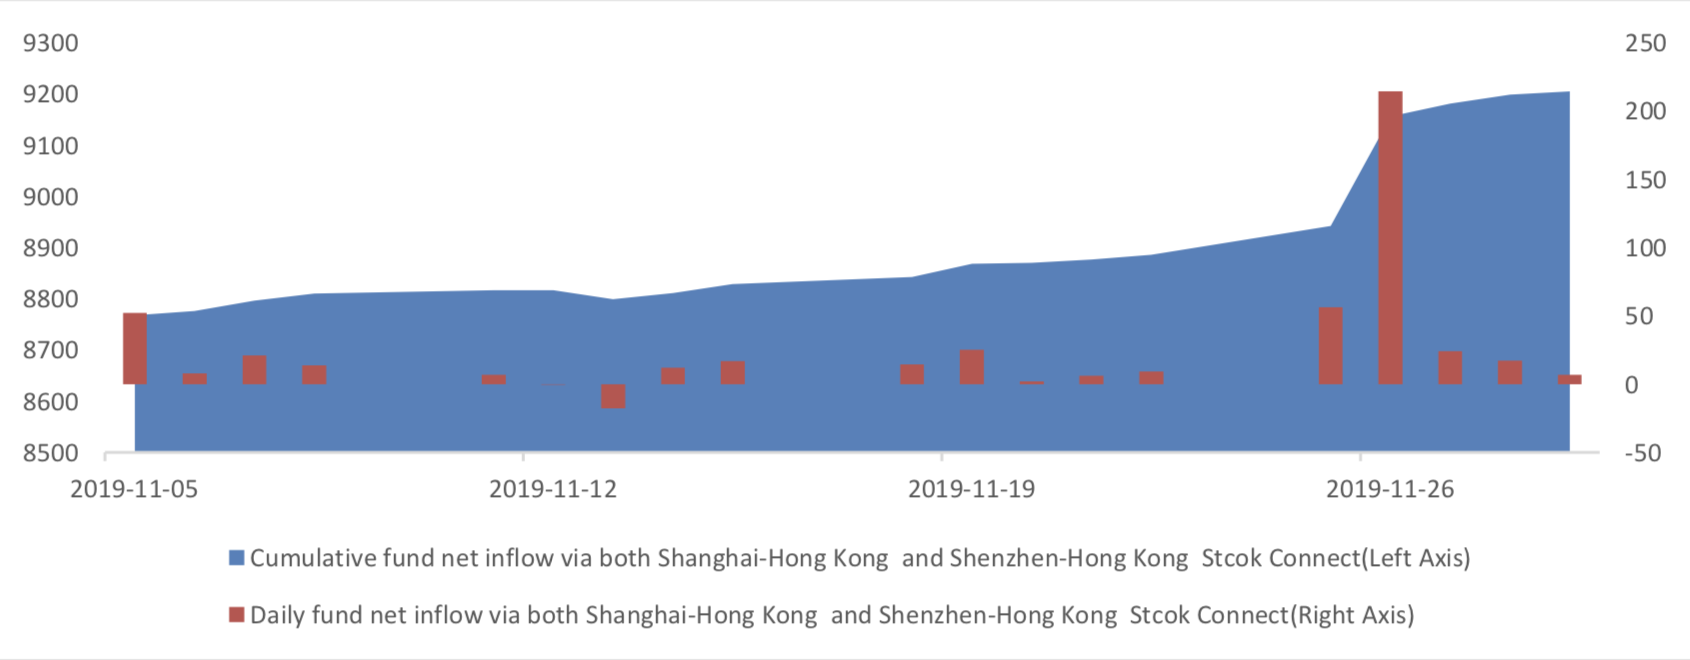
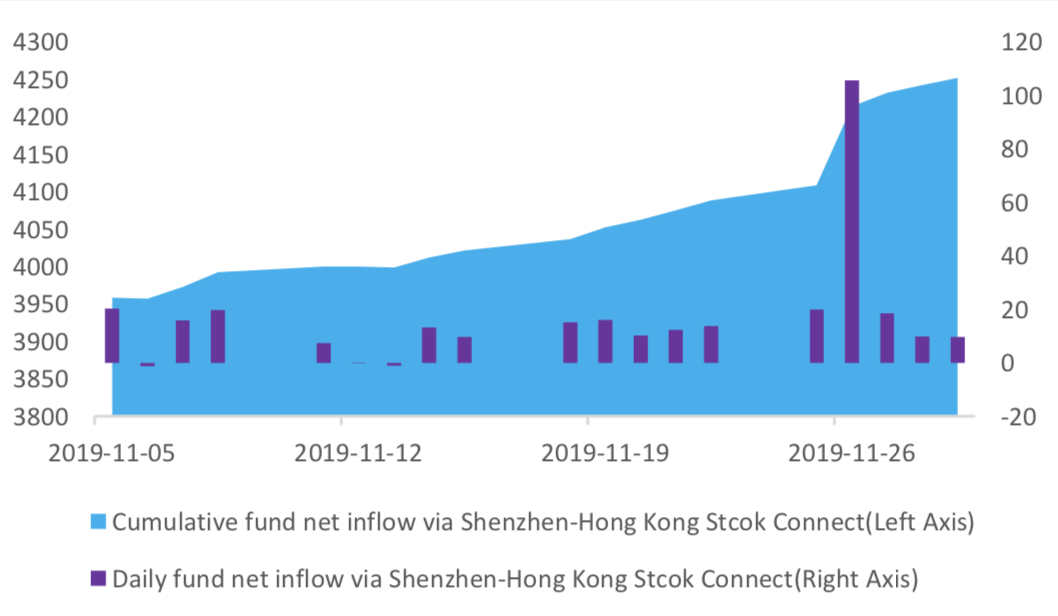
Last week, there were 5 trading days for northward channel open for stock connect programs. During last week the total foreign fund flow via Stock Connect is 31.90 billion RMB, and the cumulative inflows was 920.48 billion RMB. Specifically, the fund flow via Shanghai-Hong Kong Stock Connect is 15.57 billion RMB and the fund flow via Shenzhen-Hong Kong Stock Connect is 16.32 billion RMB.
Graph 8: Fund flow via both Shanghai and Shenzhen-Hong Kong Stock Connect in past 1M (100 million CNY)
Graph 9: Fund flow via Shenzhen-Hong Kong Stock Connect in past 1M (100 million CNY)
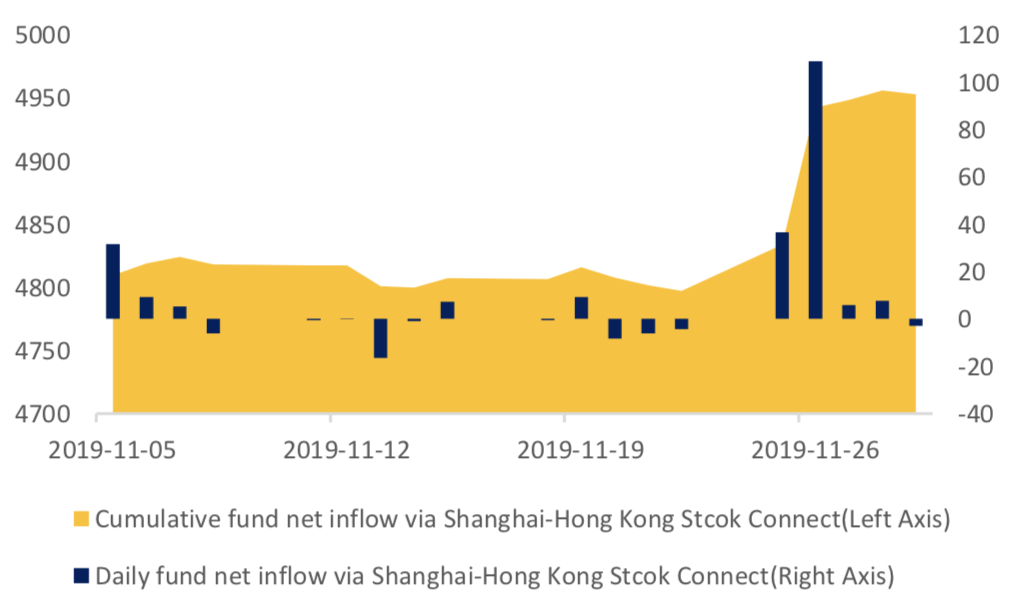
Graph 10: Fund flow via both Shanghai-Hong Kong Stock Connect in past 1M (100 million CNY)
2. Index Futures
(1) Trading Volume and Open Interests
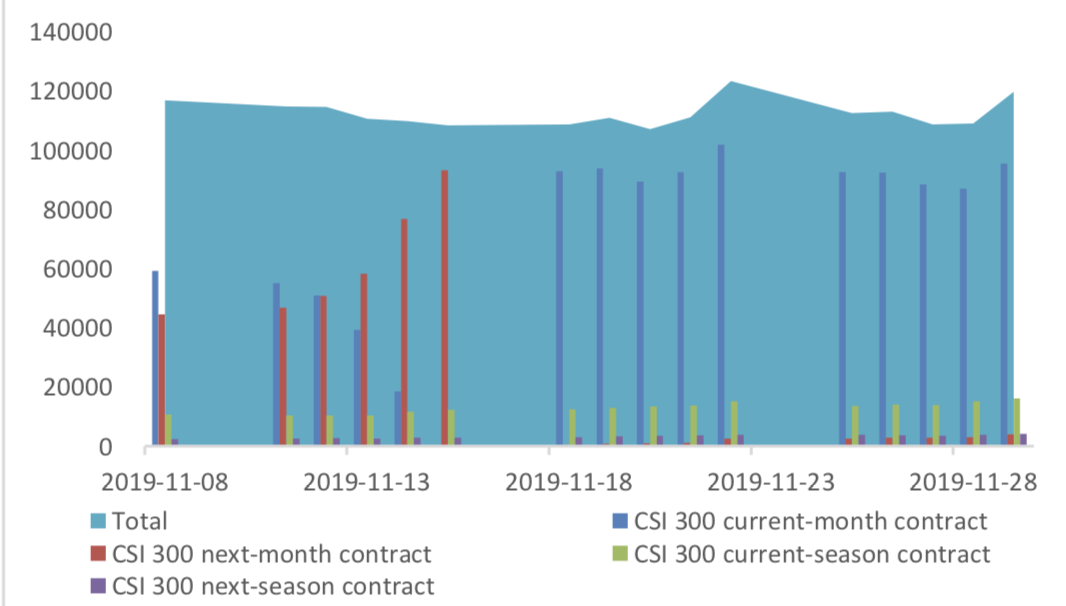
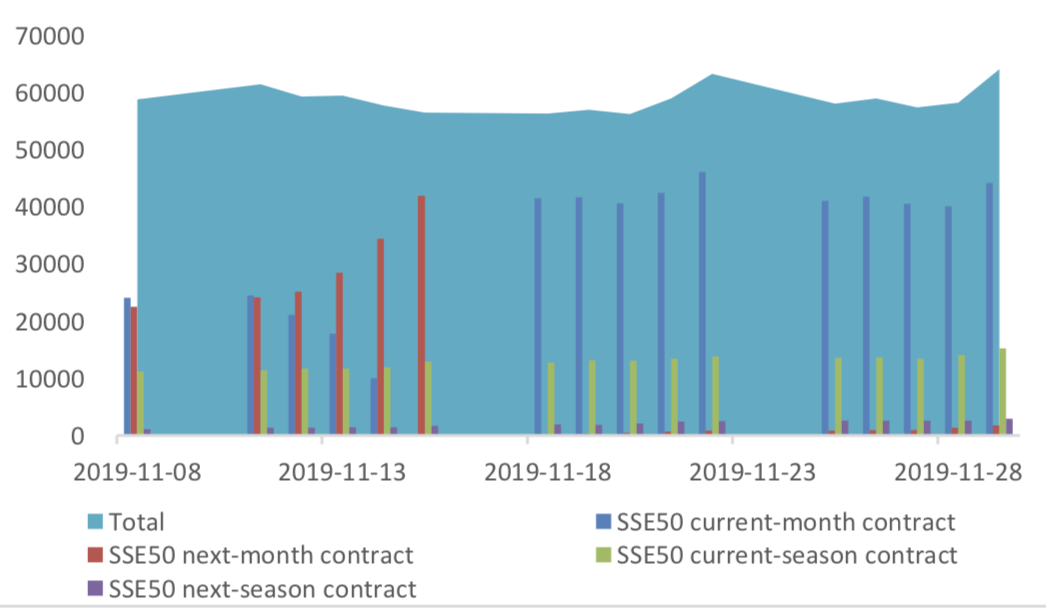
During past 5 trading days the average trading volume for CSI300(IF), SSE50(IH), CSI500(IC) contracts
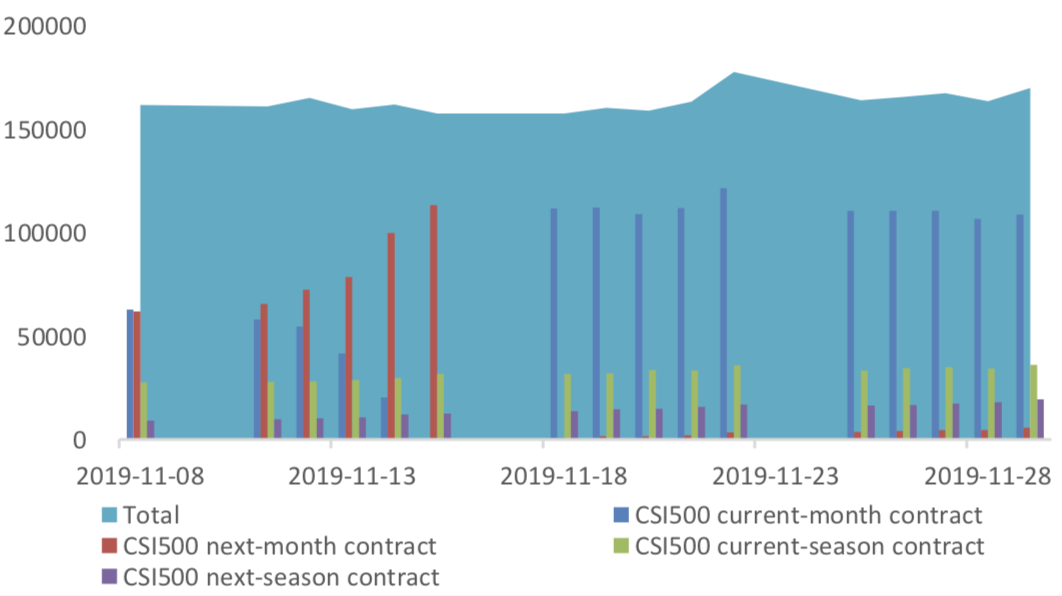
are 79491 (-3.96%, the previous 5-trading day period),31423 (-0.01%),84265 (-2.78%) lots, respectively. On the last trading day, the total open interests for them are 119741 (-2.95%),64078 (1.34%),169894 (- 4.37%) lots respectively.
Graph 11: CSI300 Index futures’ trading volume
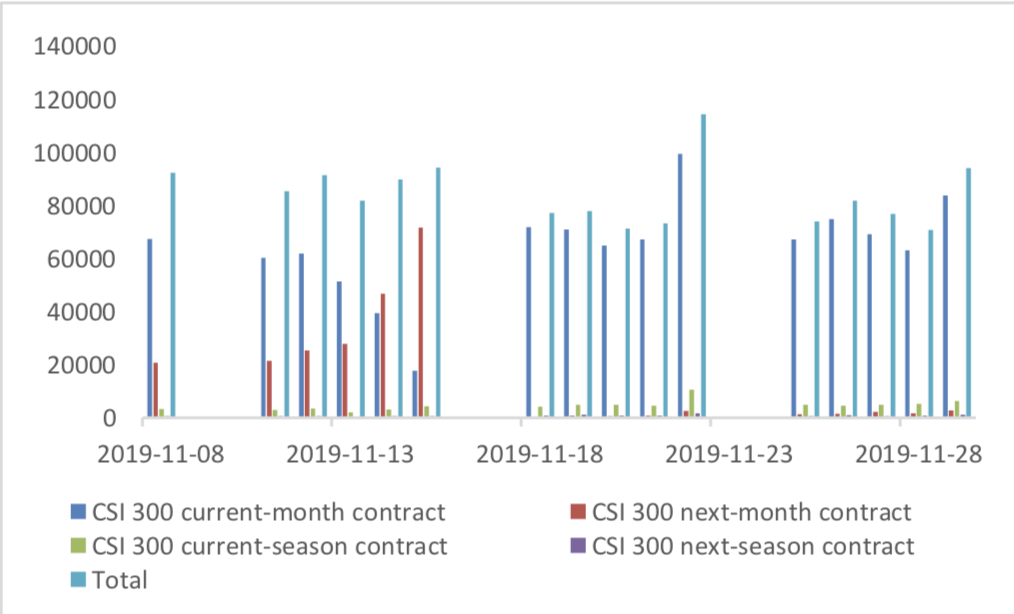
Graph 12: CSI300 Index futures’ open interests
Graph 13:SSE50 Index futures’ trading volume
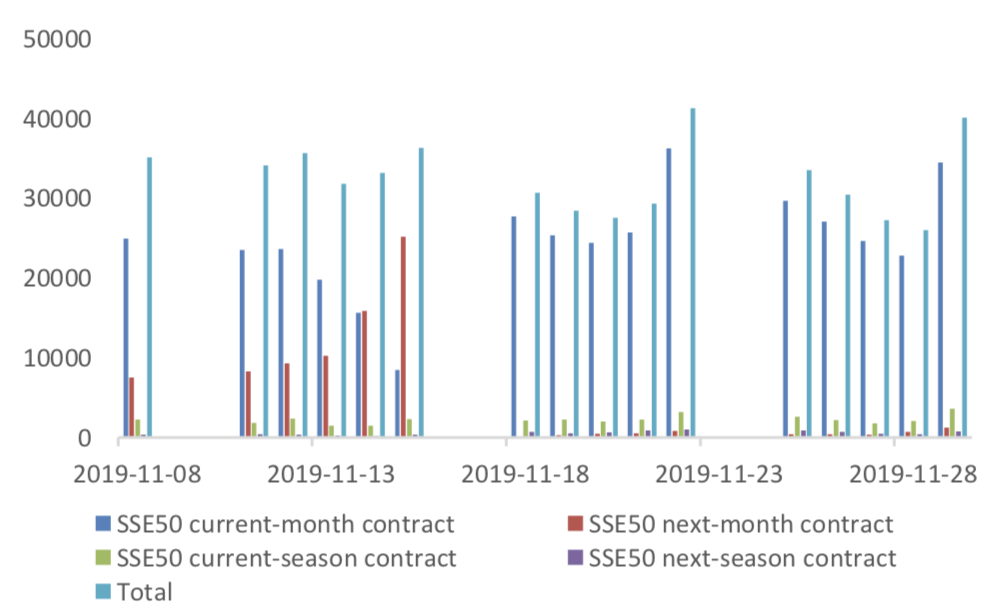
Graph 14: SSE50 Index futures’ open interests
Graph 15: CSI500 Index futures’ trading volume
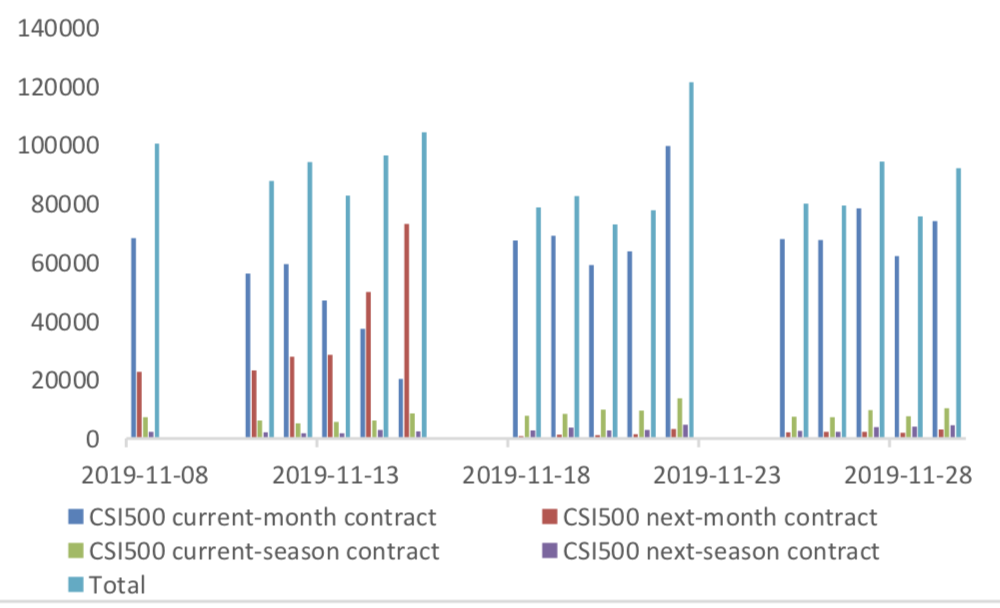
Graph 16: CSI500 Index futures’ open interests
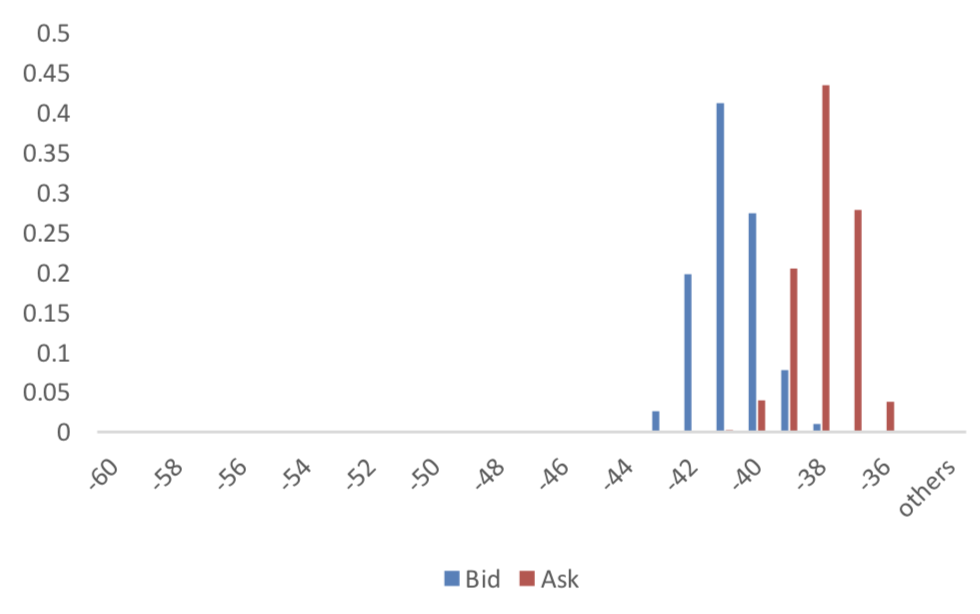
(2) Roll Level Bid-Ask Distribution
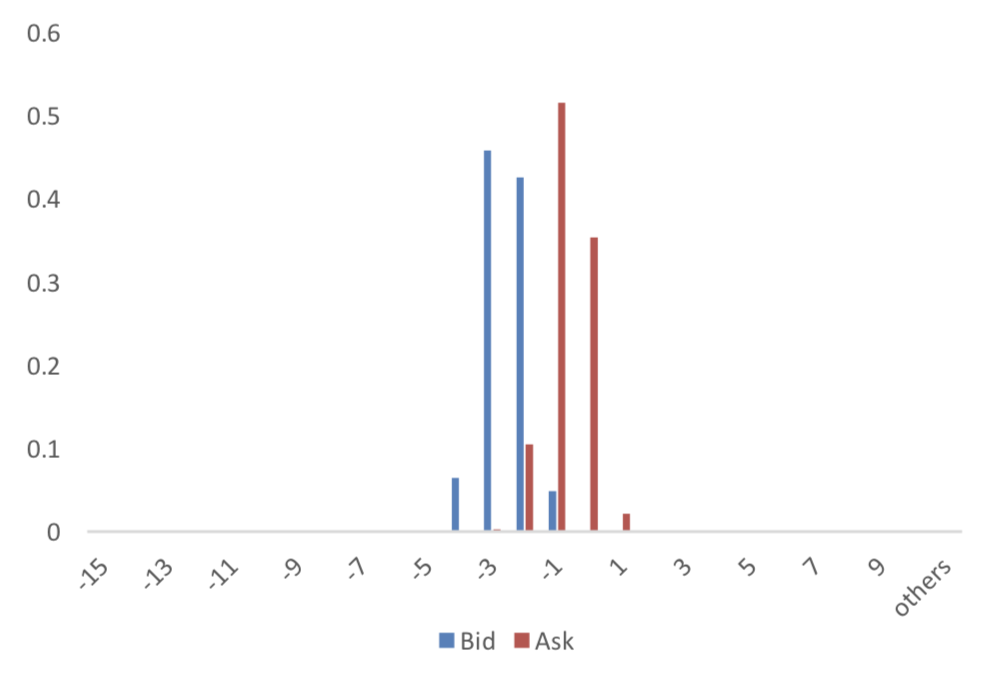
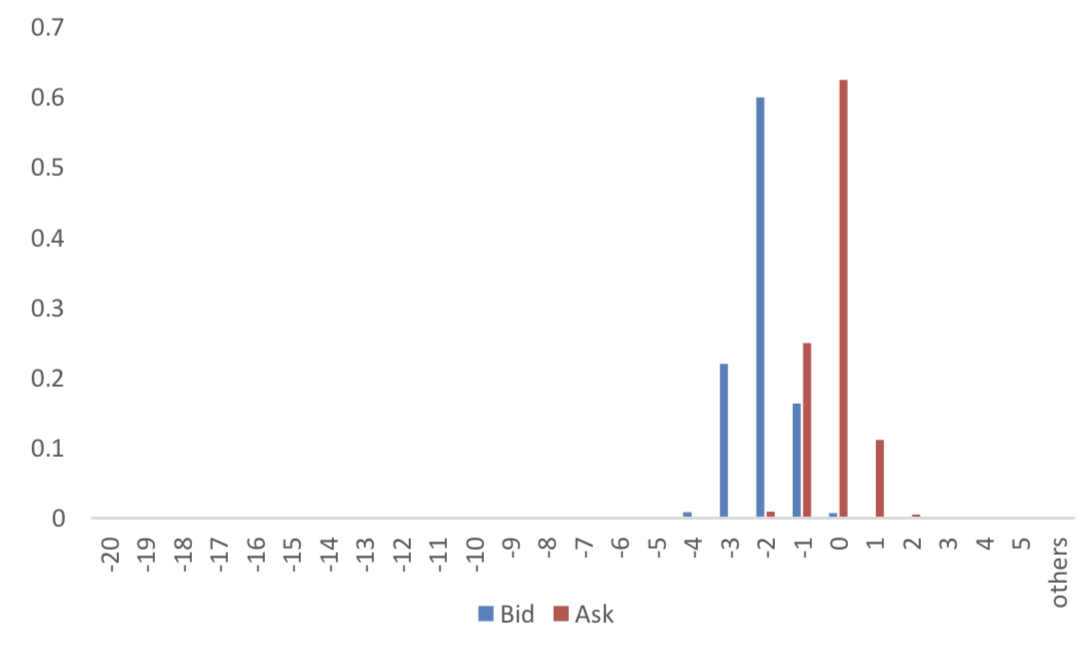
There are 5 trading days during last week, so the distribution is worked out with 36005 data points for each contract pair.
Graph 17: CSI300 Current/Next Month Contract Roll Spread Distribution (2s frequency)
Graph 18: SSE50 Current/Next Month Contract Roll Spread Distribution (2s frequency)
Graph 19: CSI500 Current/Next Month Contract Roll Spread Distribution (2s frequency)
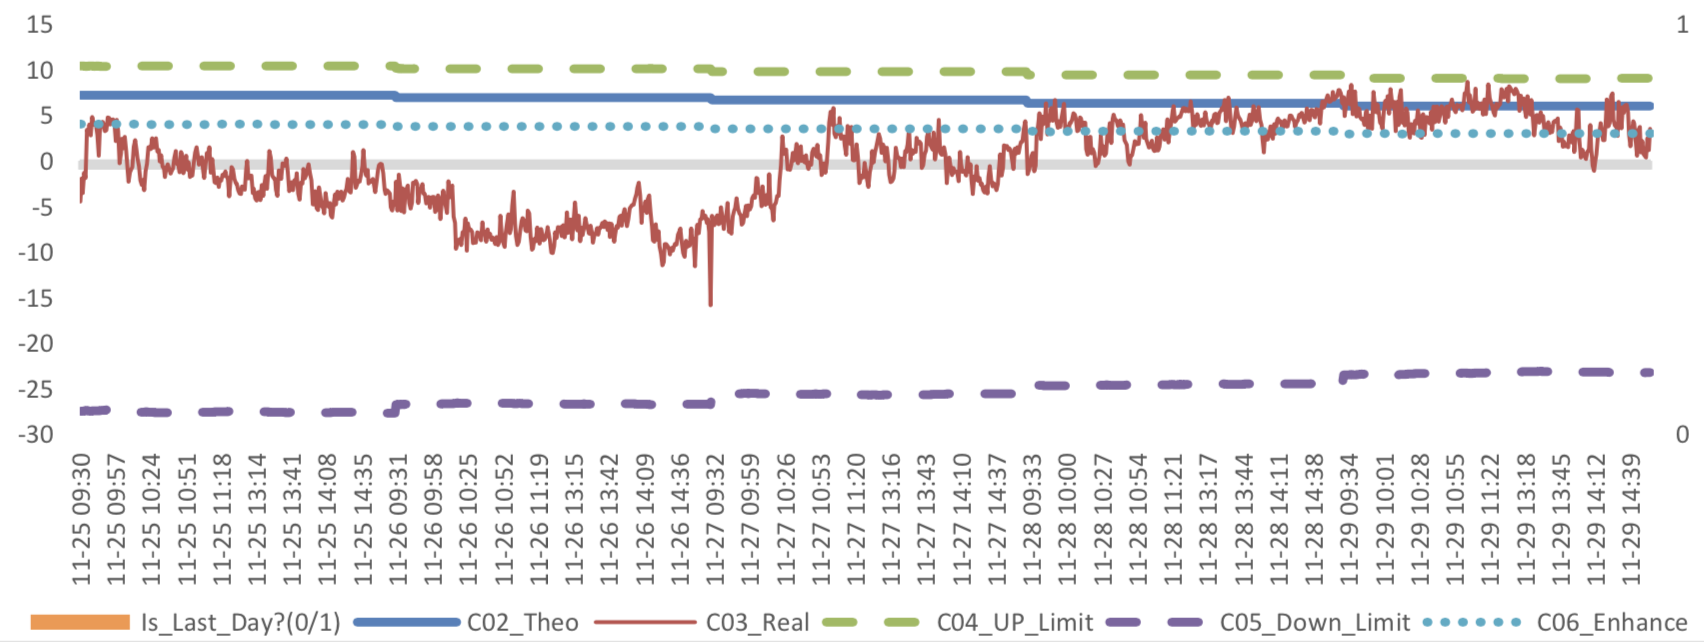
Assumption: risk-free rate: 3%; security borrowing cost: 8%; trading expense for spot: 0.025%; trading expense for futures: 0.005%; margin rates for futures contracts: 0.11 for CSI300 and SSE50, 0.13 for CSI500; margin rate for security borrowing: 0.3 (or 130% maintain rate).
When real price spread is out of theoretical range (calculated by our assumption), there exists absolute future-spot arbitrage opportunity.
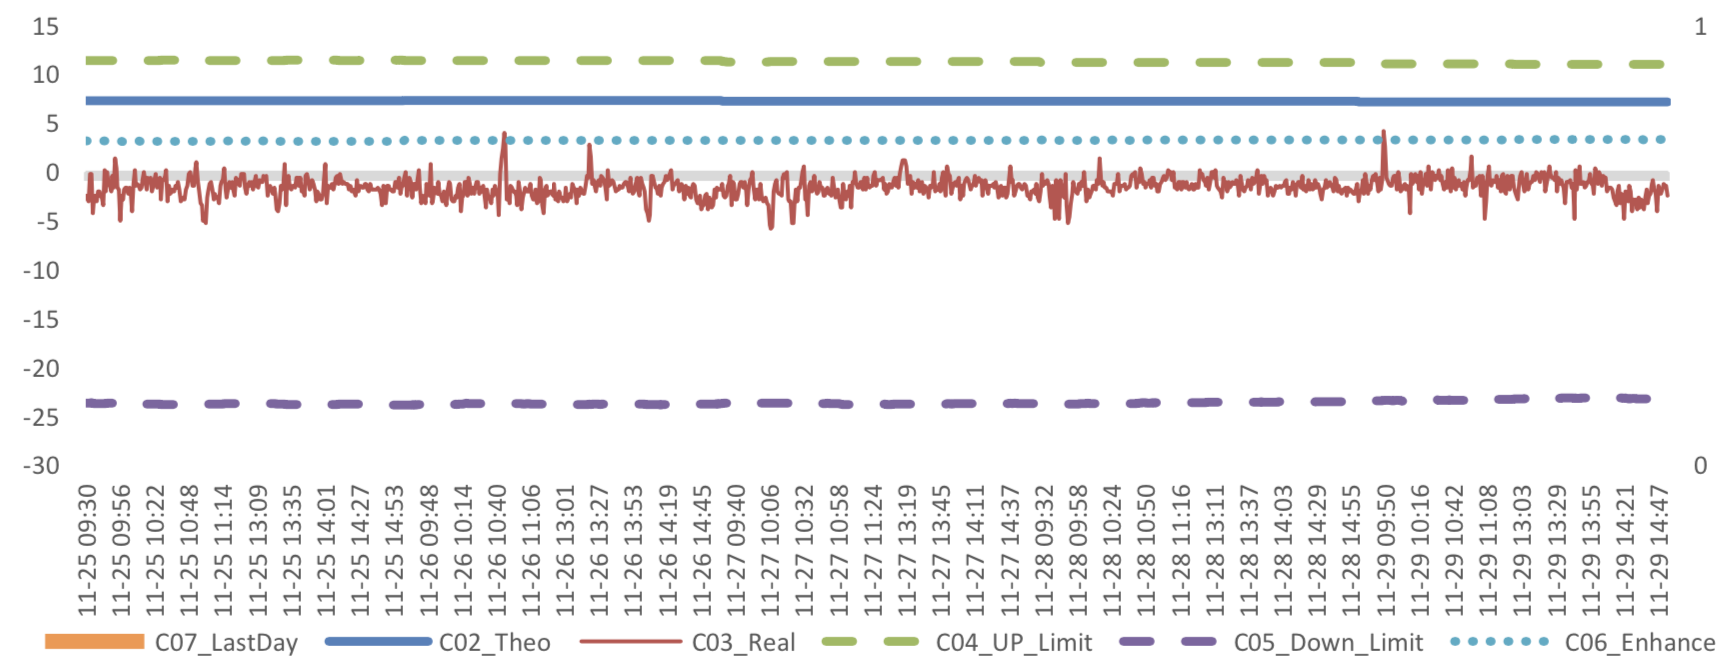
Graph 20: Future (Current Month)-Spot Arbitrage Opportunity for CSI300 contract (in the view of price difference)
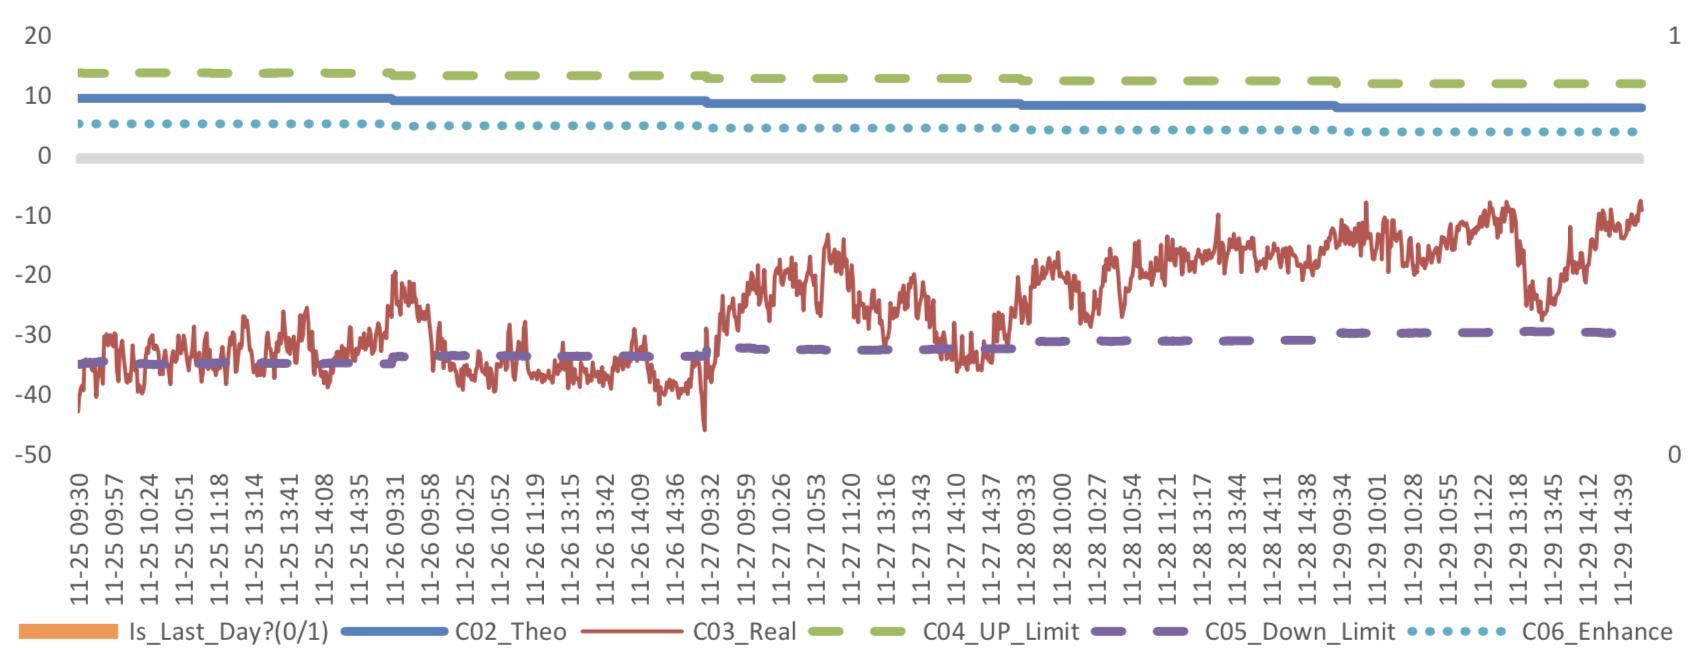
Graph 21: Future (Current Month)-Spot Arbitrage Opportunity for SSE50 contract (in the view of price difference)

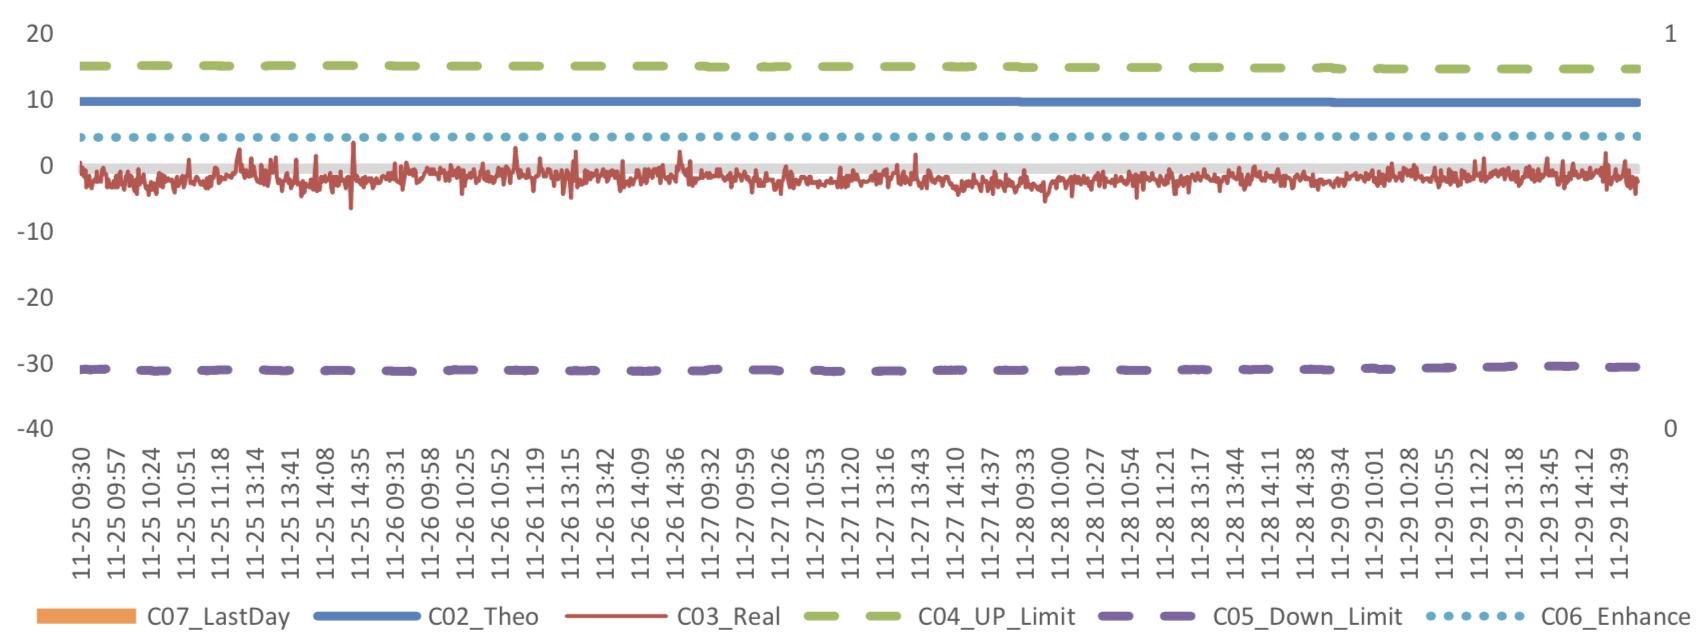
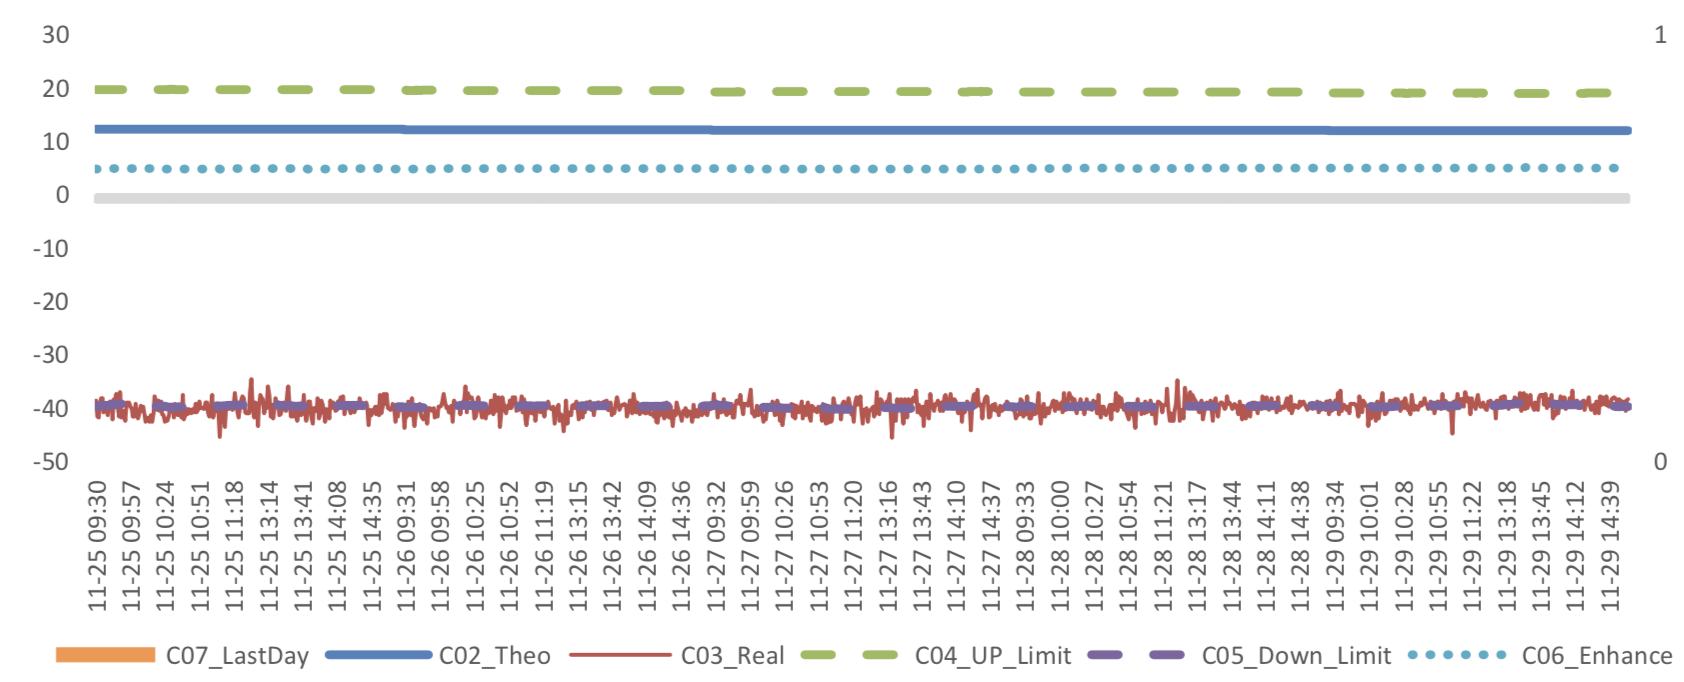
Graph 22: Future (Current Month)-Spot Arbitrage Opportunity for CSI500 contract (in the view of price difference)
Graph 23: Future (Next Month-Current Month) Arbitrage Opportunity for CSI300 contract (in the view of price difference)
Graph 24: Future (Next Month-Current Month) Arbitrage Opportunity for SSE50 contract (in the view of price difference)
Graph 25: Future (Next Month-Current Month) Arbitrage Opportunity for CSI500 contract (in the view of price
difference)
(4) Roll Spread of Stock Index Futures Tracking
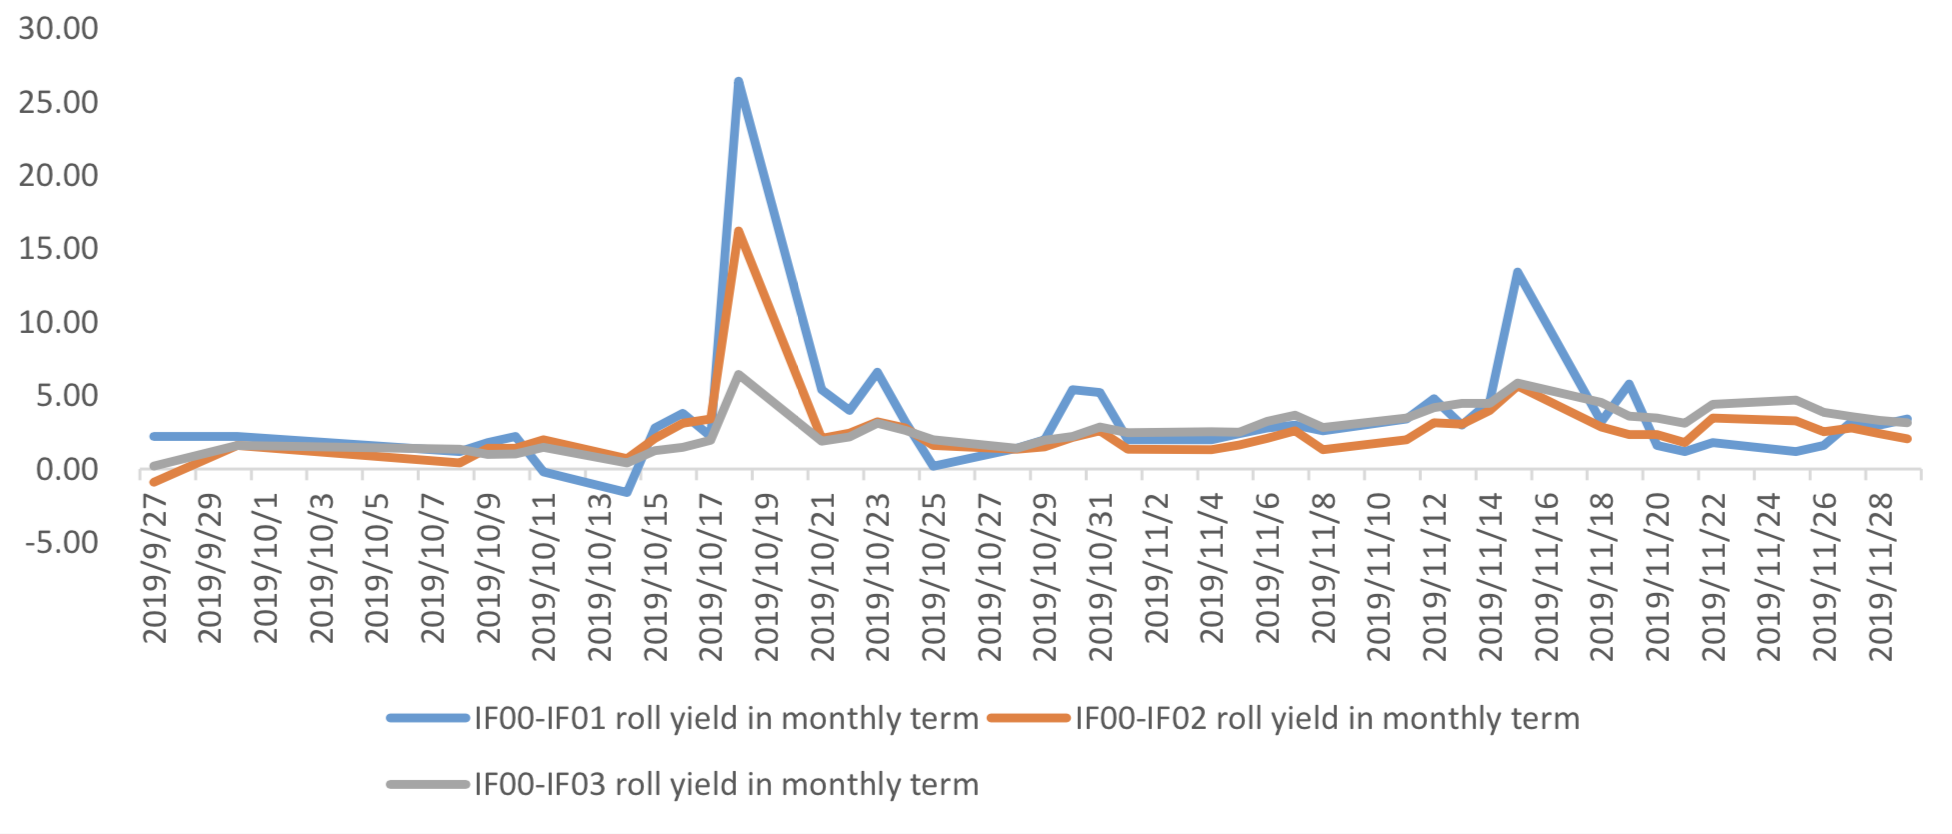
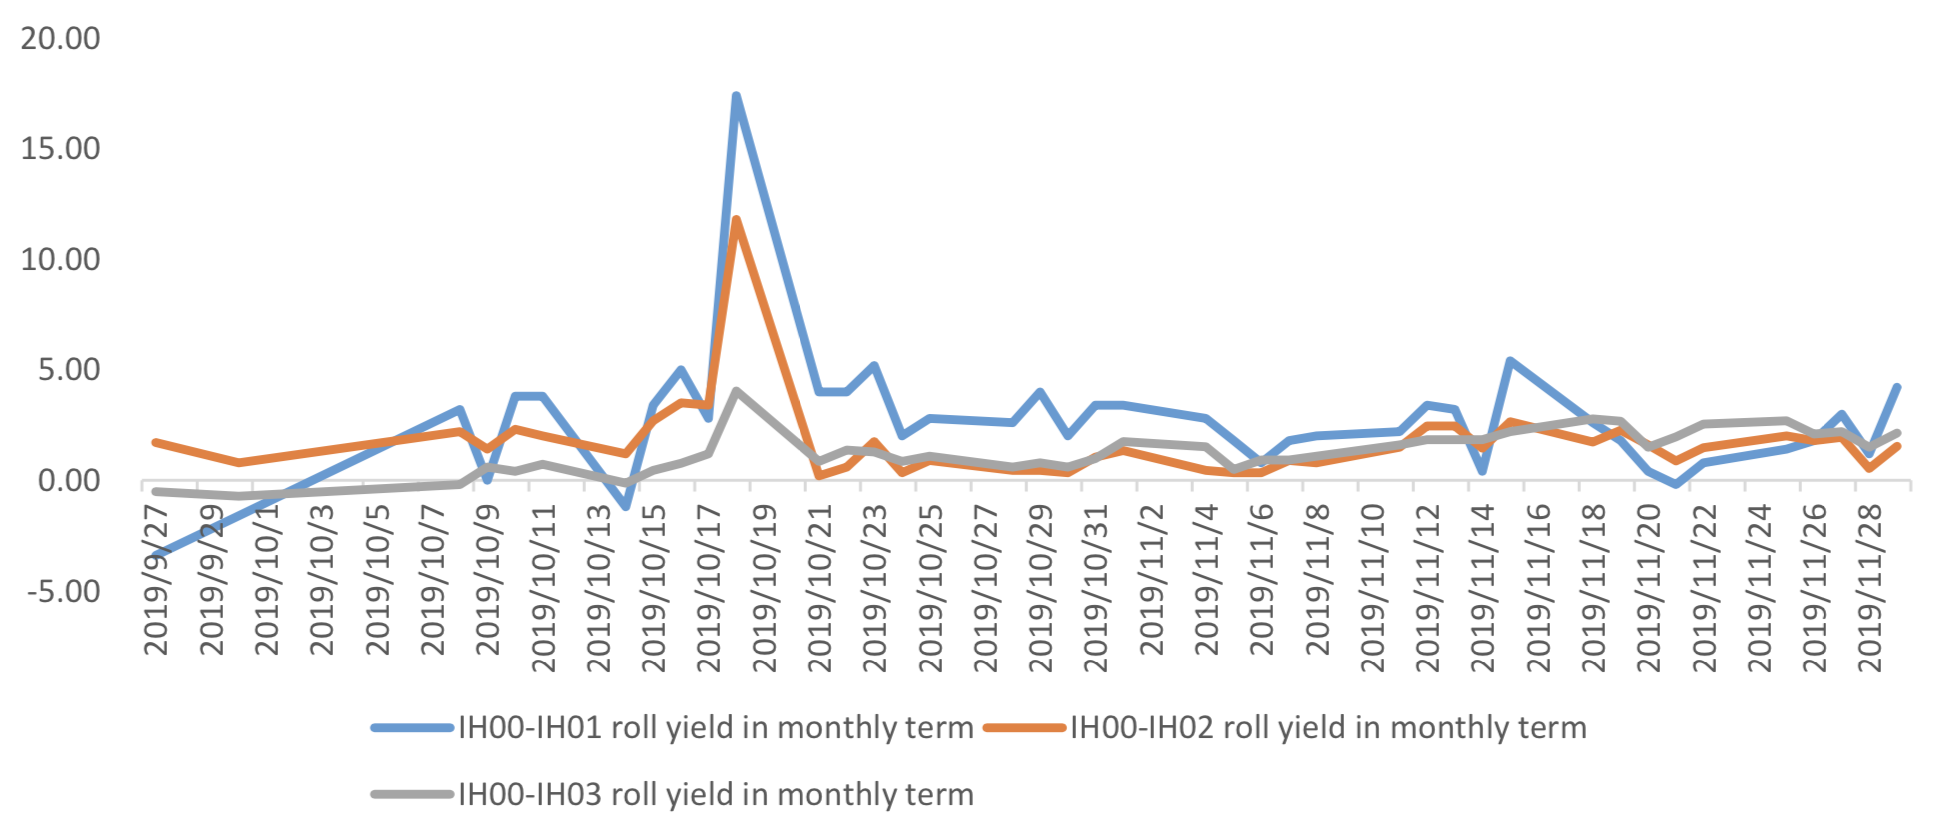
Calculated as the contract price of the current month minus the contract price of the following month, for the long roll, the positive calculation results are gains, the negative calculation results are losses. Code 00 in the figure represents the current month contract, 01 the next month contract, 02 the current quarter contract, 03 the next quarter contract.
(a)IF
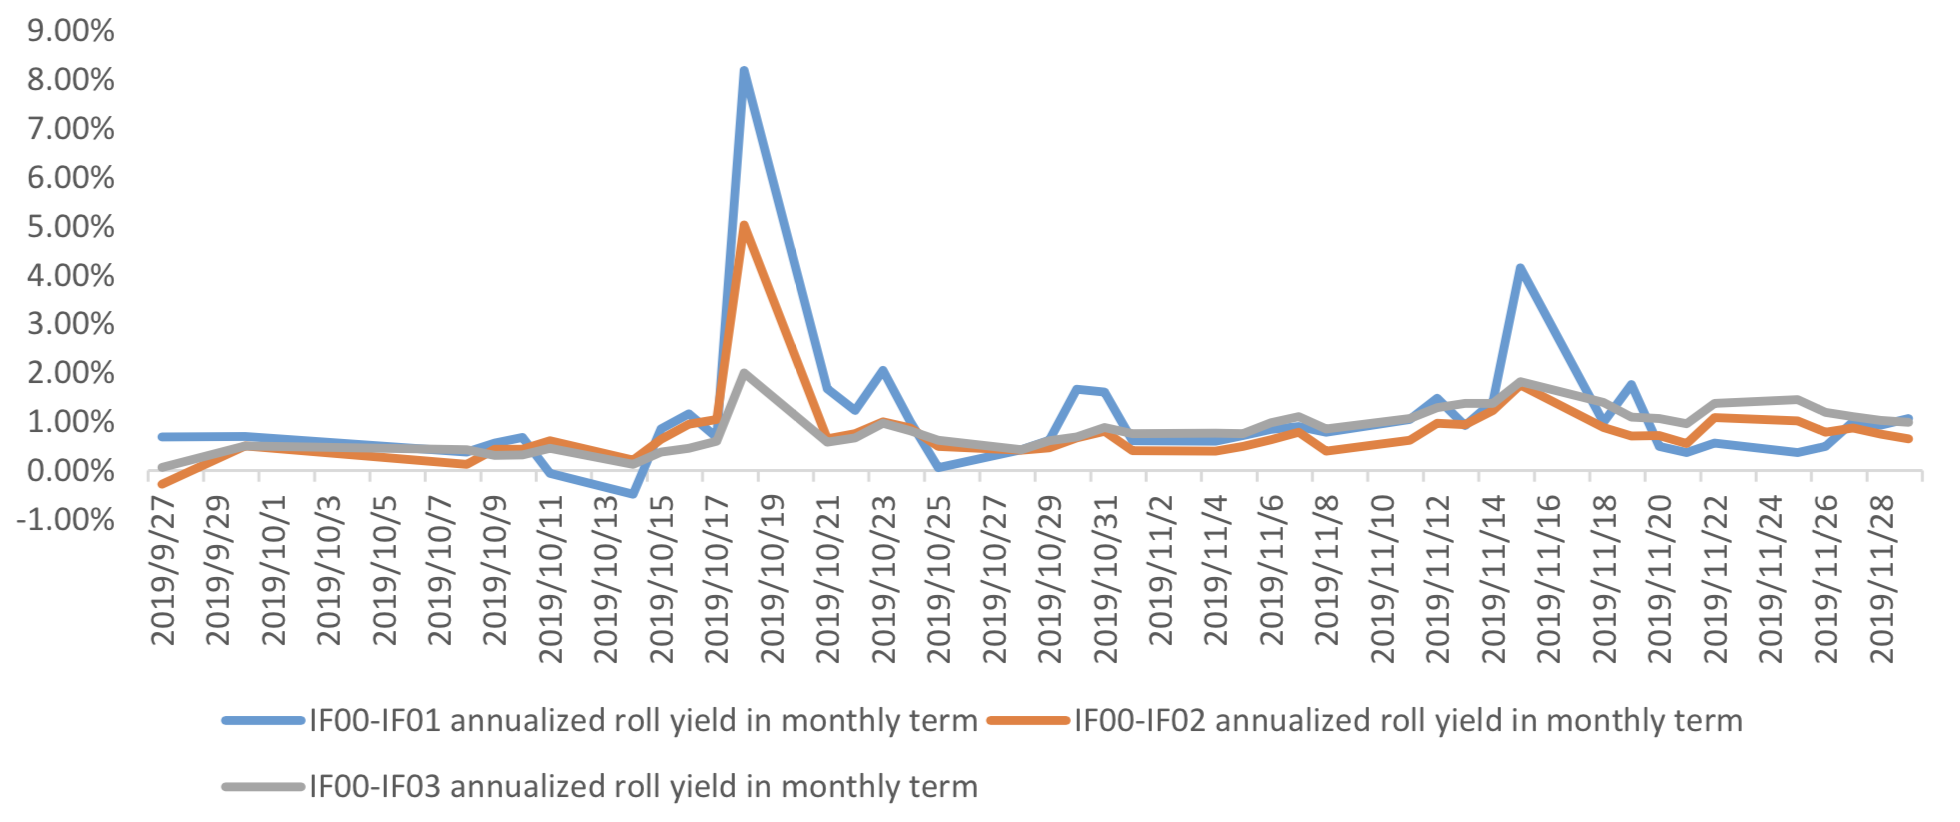
Up to2019/11/29,the best roll plan is IF00-IF01,annualized roll yield in monthly term is1.07%。
Graph 26: IF Current month contract roll yield comparison (index point)
Graph 27: IF Current month contract roll yield comparison (annualized return)
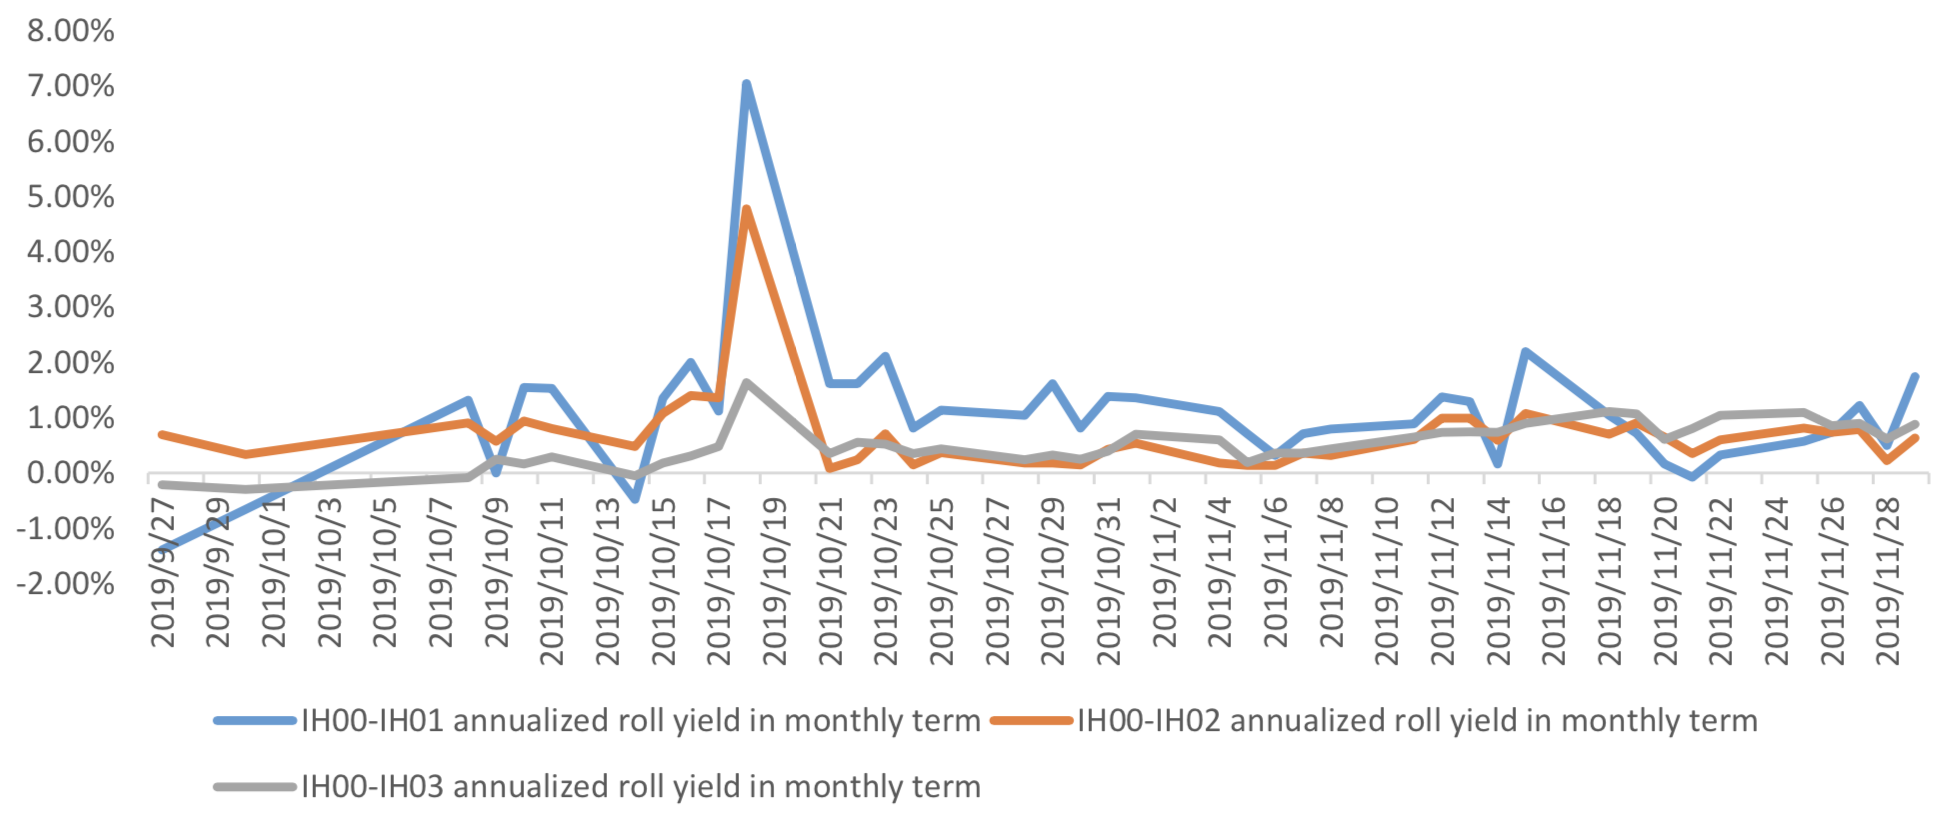
(b)IH
Up to 2019/11/29,the best roll plan is IH00-IH01,annualized roll yield in monthly term is1.74%。
Graph 28: IH Current month contract roll yield comparison (index point)
Graph 29: IH Current month contract roll yield comparison (annualized return)
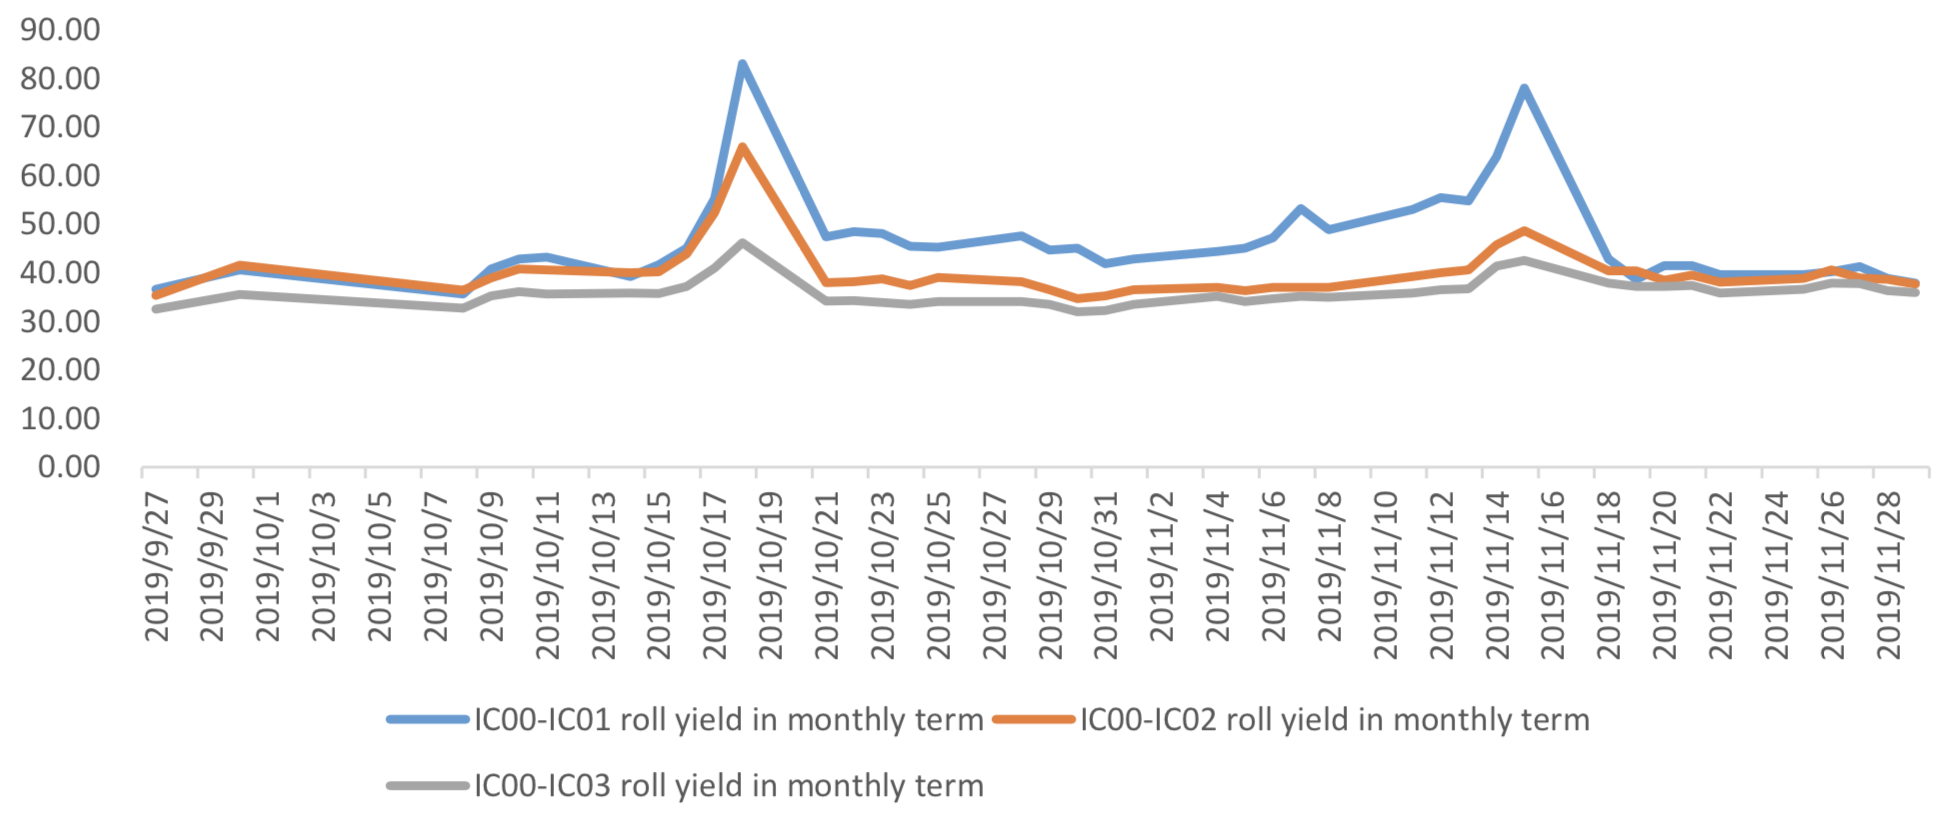
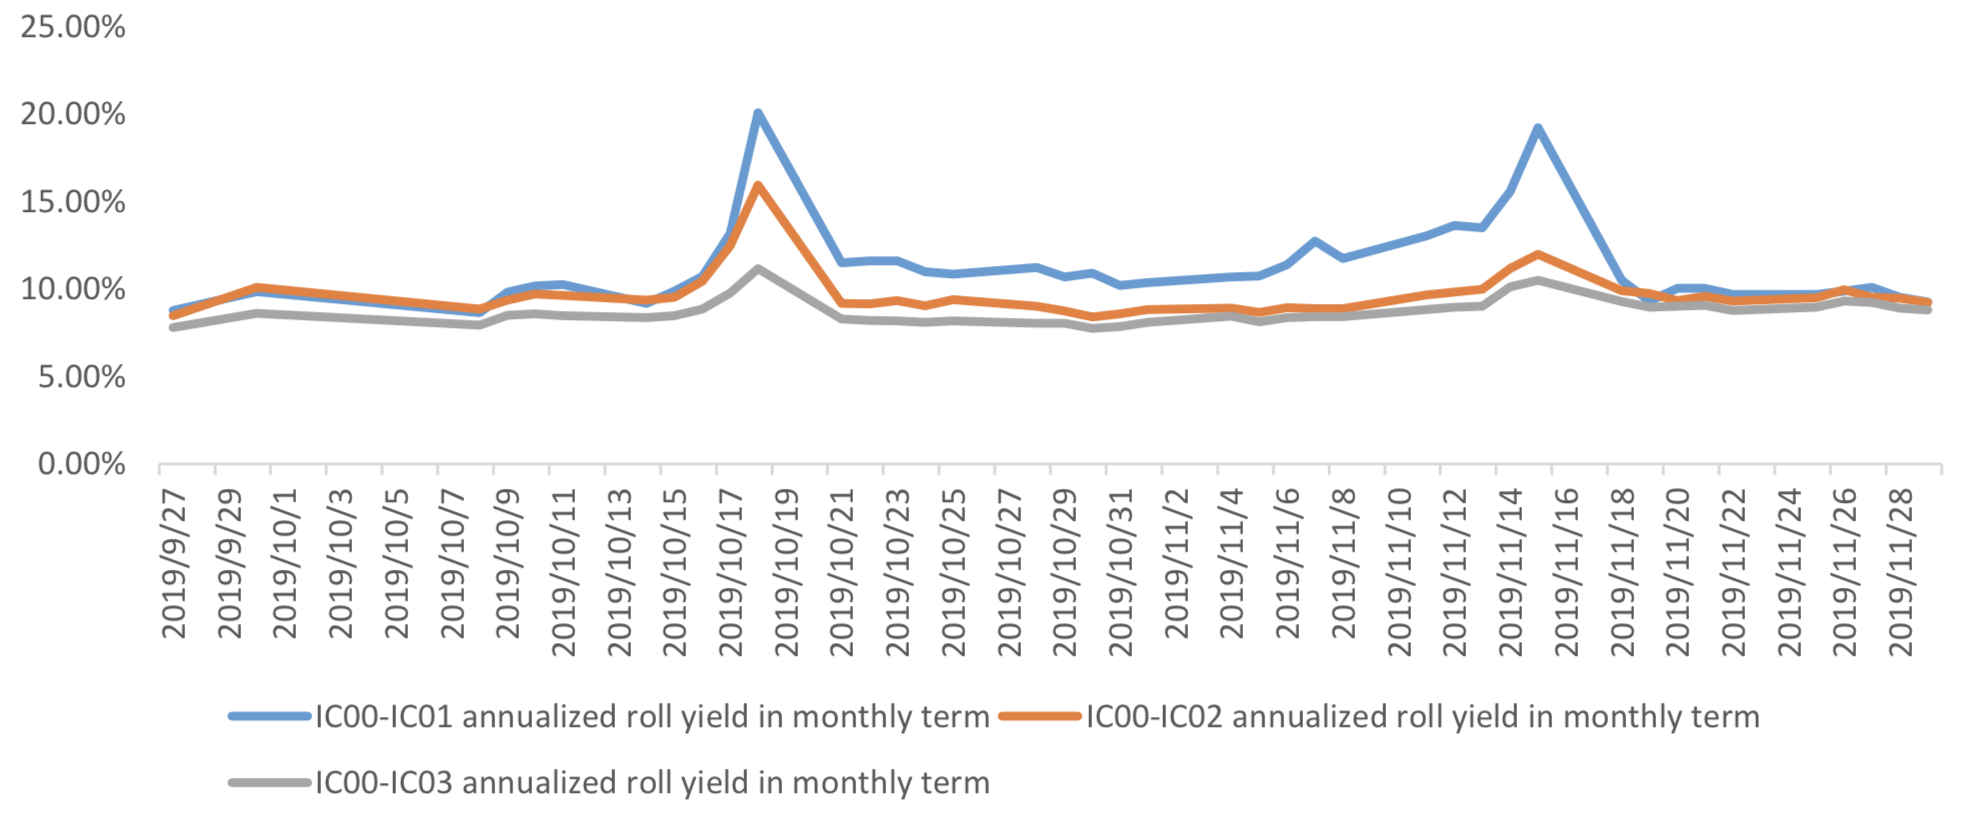
(c)IC
Up to2019/11/29,the best roll plan isIC00-IC01,annualized roll yield in monthly term is9.27%。
Graph 30: IC Current month contract roll yield comparison (index point)
Graph 31: IC Current month contract roll yield comparison (annualized return)
(5) Basis Tracking of Stock Index Futures
For long side, if the base difference is positive, the change of the base difference brings losses, and if the base difference is negative, the change of the base difference brings profits.
(a)IF
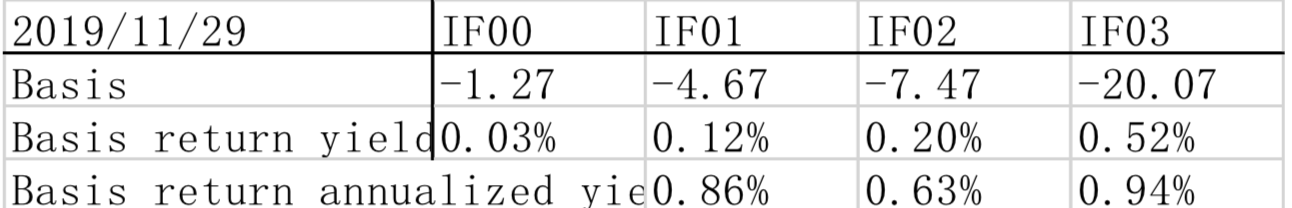
For long side hedge, up to 2019/11/29,all IF contracts were in discount. Here IF next month contract basis return annualized yield is 0.86%。
Graph 32: IF contracts basis
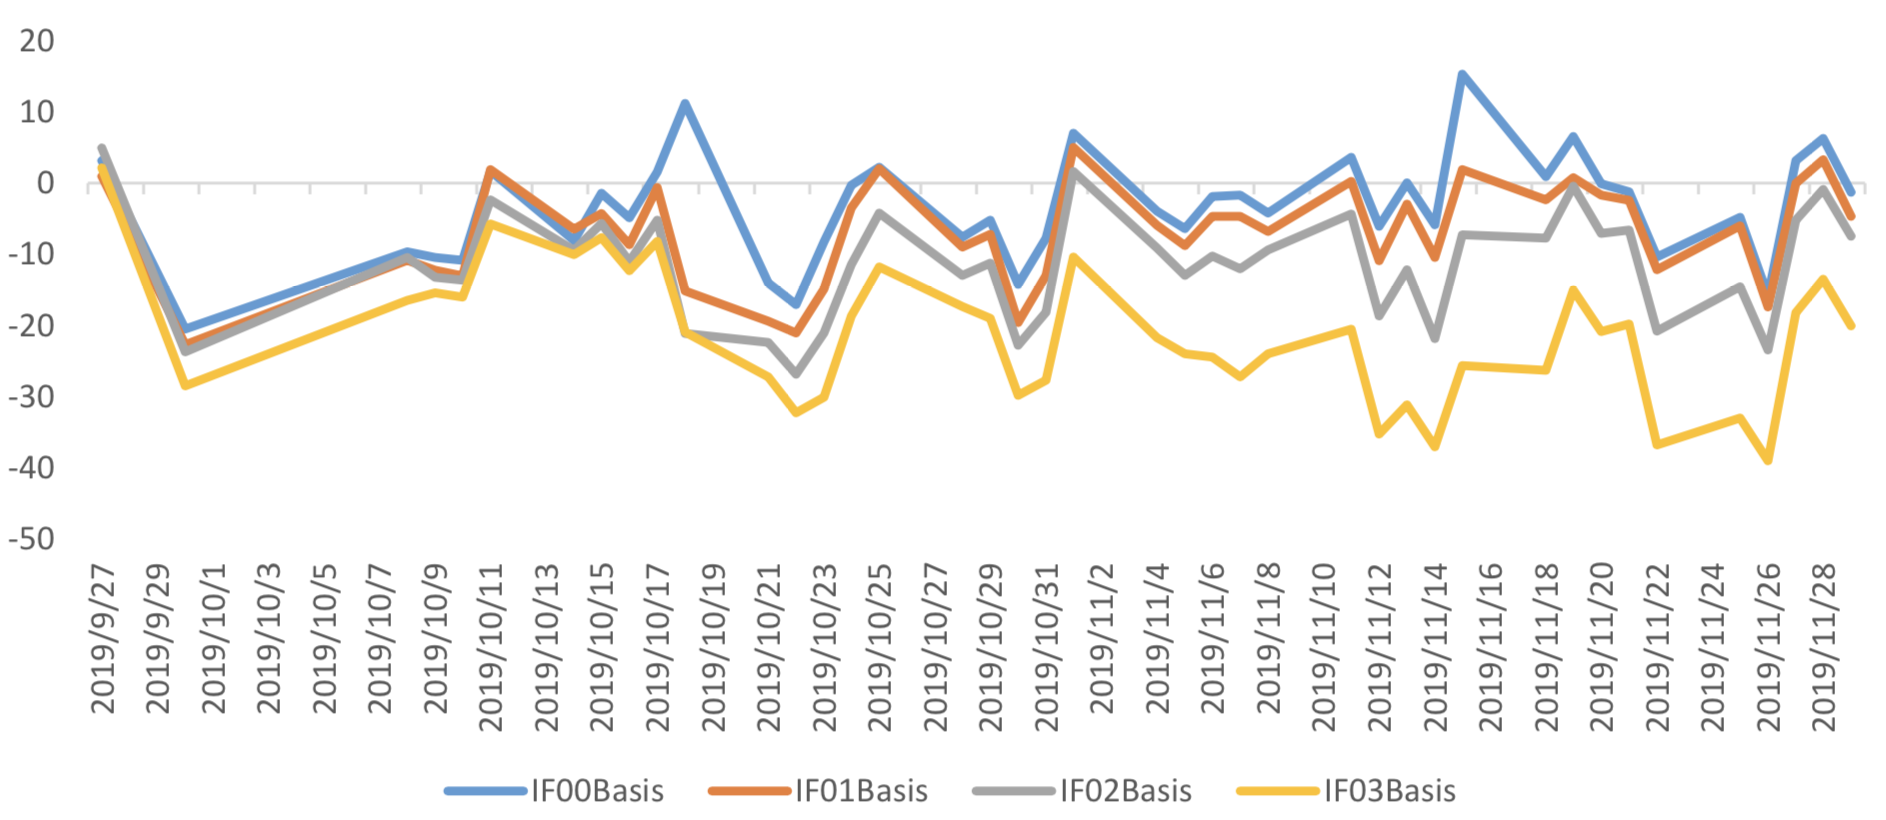
Table 1: IF basis return calculation
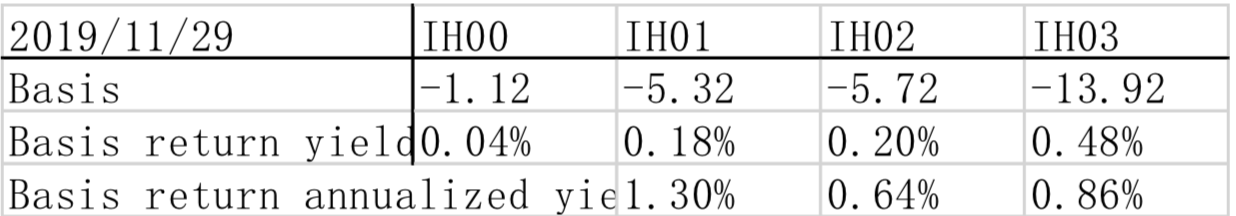
(b)IH
For long side hedge, up to 2019/11/29,all IH contracts were in discount. Here IH next month
contract basis return annualized yield is 1.30%。
Graph 33: IH contracts basis

Table 2: IH basis return calculation
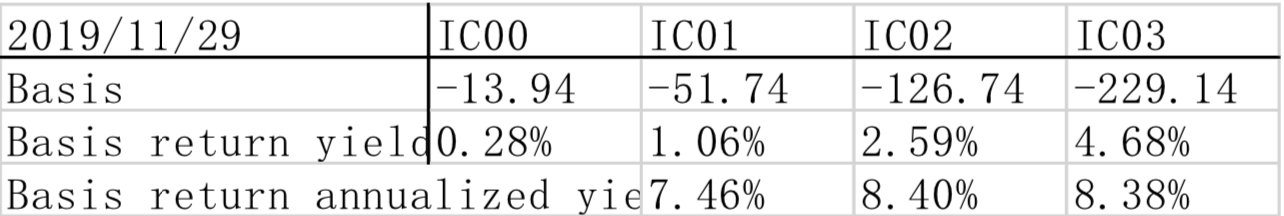
(c)IC
For long side hedge, up to 2019/11/29,all IC contracts were in discount.. Here IC next month
contract basis return annualized yield is 7.46%。
Graph 34: IC contracts basis
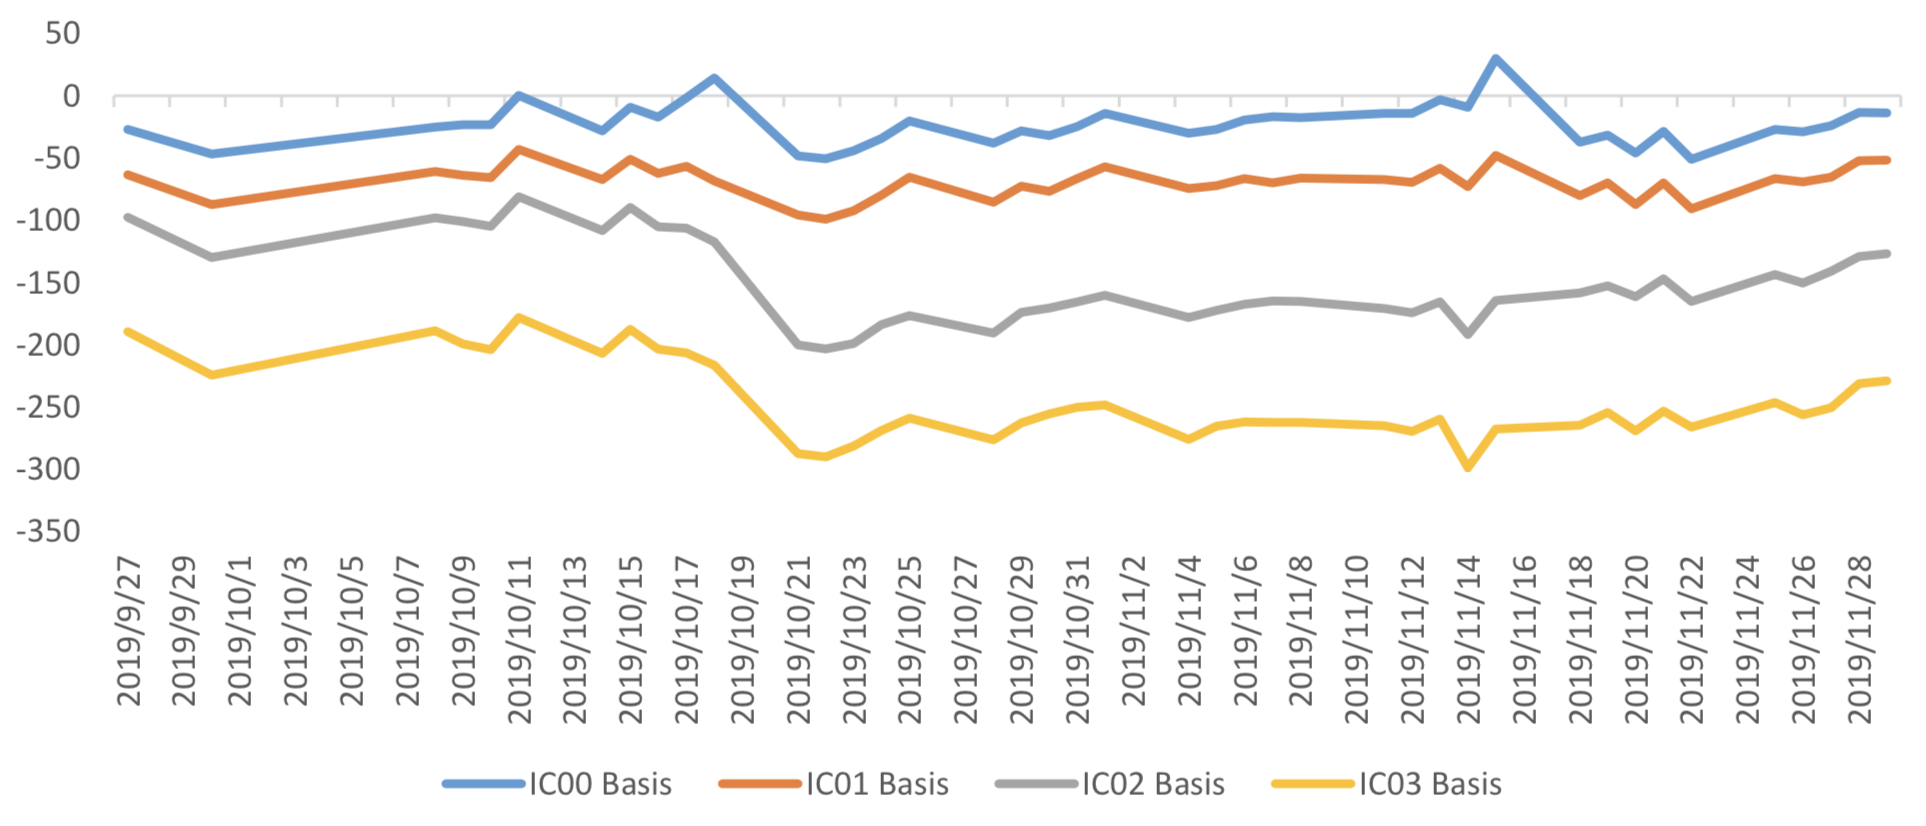
Table 3: IC basis return calculation
3. Financial Markets
(1) Interest Rates
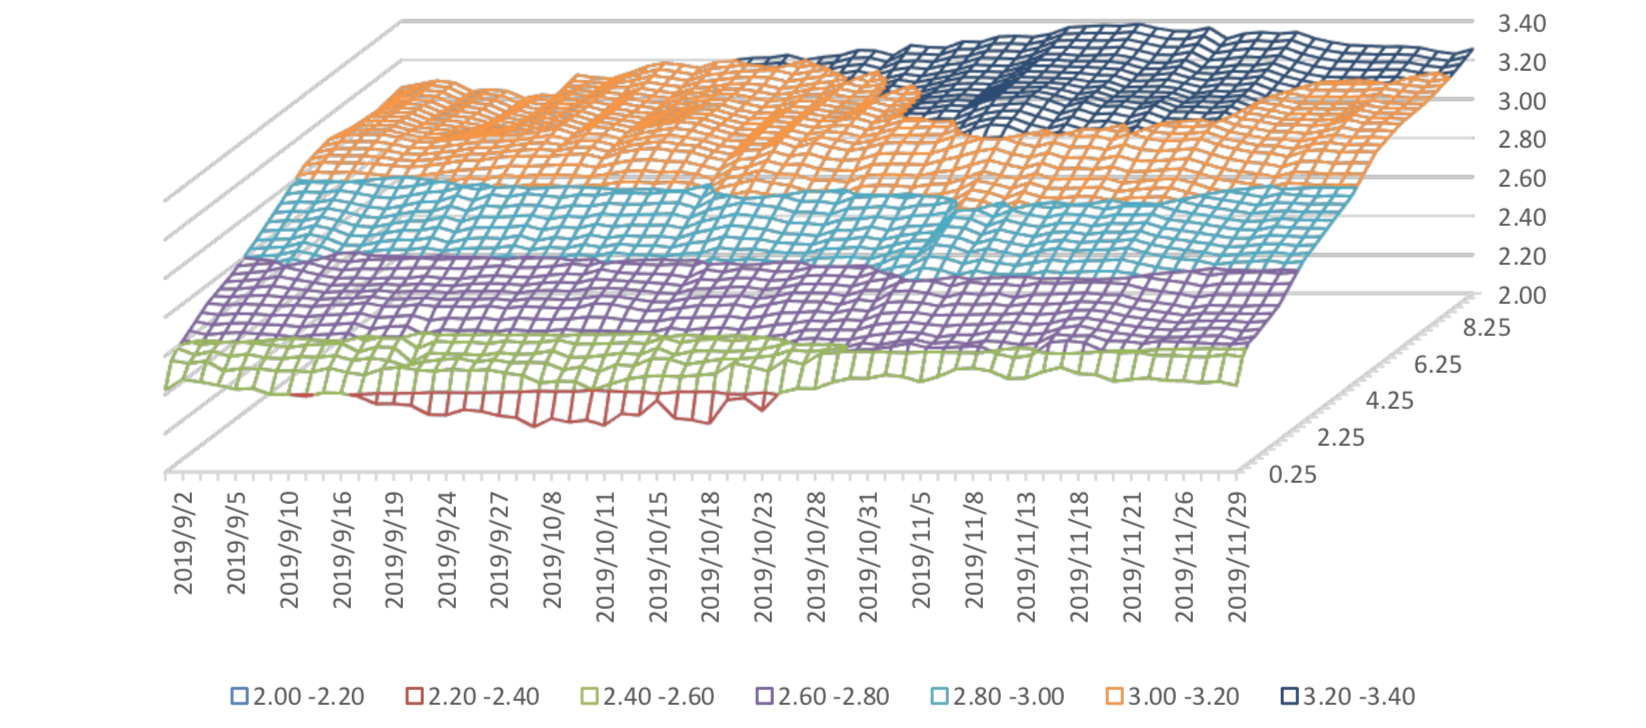
The term structure of treasury bonds’ yields is currently upward sloping in concave shape.
Specifically, last week, short-term yields short term yield of Treasury bond experienced some fluctuation and 3M yield now at 2.4%-2.6% level. Furthermore, as for long-term yield, there is a small drop. 10Y yield is about 3.2%-3.4%.
Graph 35: Term Structure Evolvement of Treasury Bonds Yields During Recent 3 Months (%)
As for Shibor rates, short-term rates experienced significant fluctuation. Specifically, O/N rate experienced obvious fluctuation to 2.0%-2.2% level.
Graph 36: Term Structure Evolvement of Shibor Rates During Recent 3 Months (%)

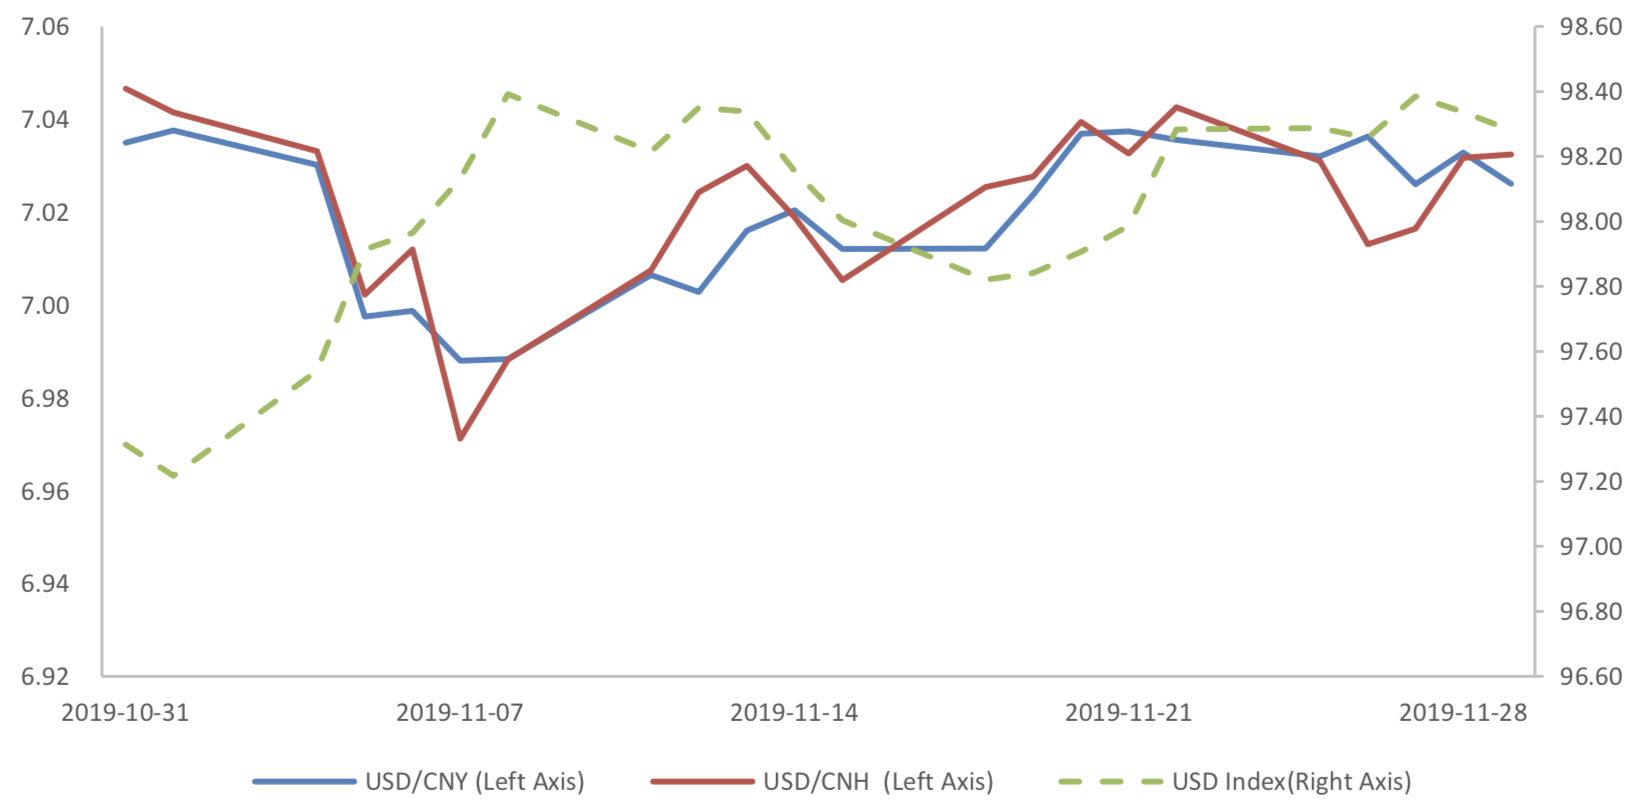
(2) ExchangeRates
During last week, CNY/USD changed -0.135% to 7.0261 and offshore rate, CNH/USD, changed - 0.14% to 7.0324 and USD index changed 0.00%.
Graph 37: USD/CNY, USD/CNH and USD Index
Macroeconomic Topic:
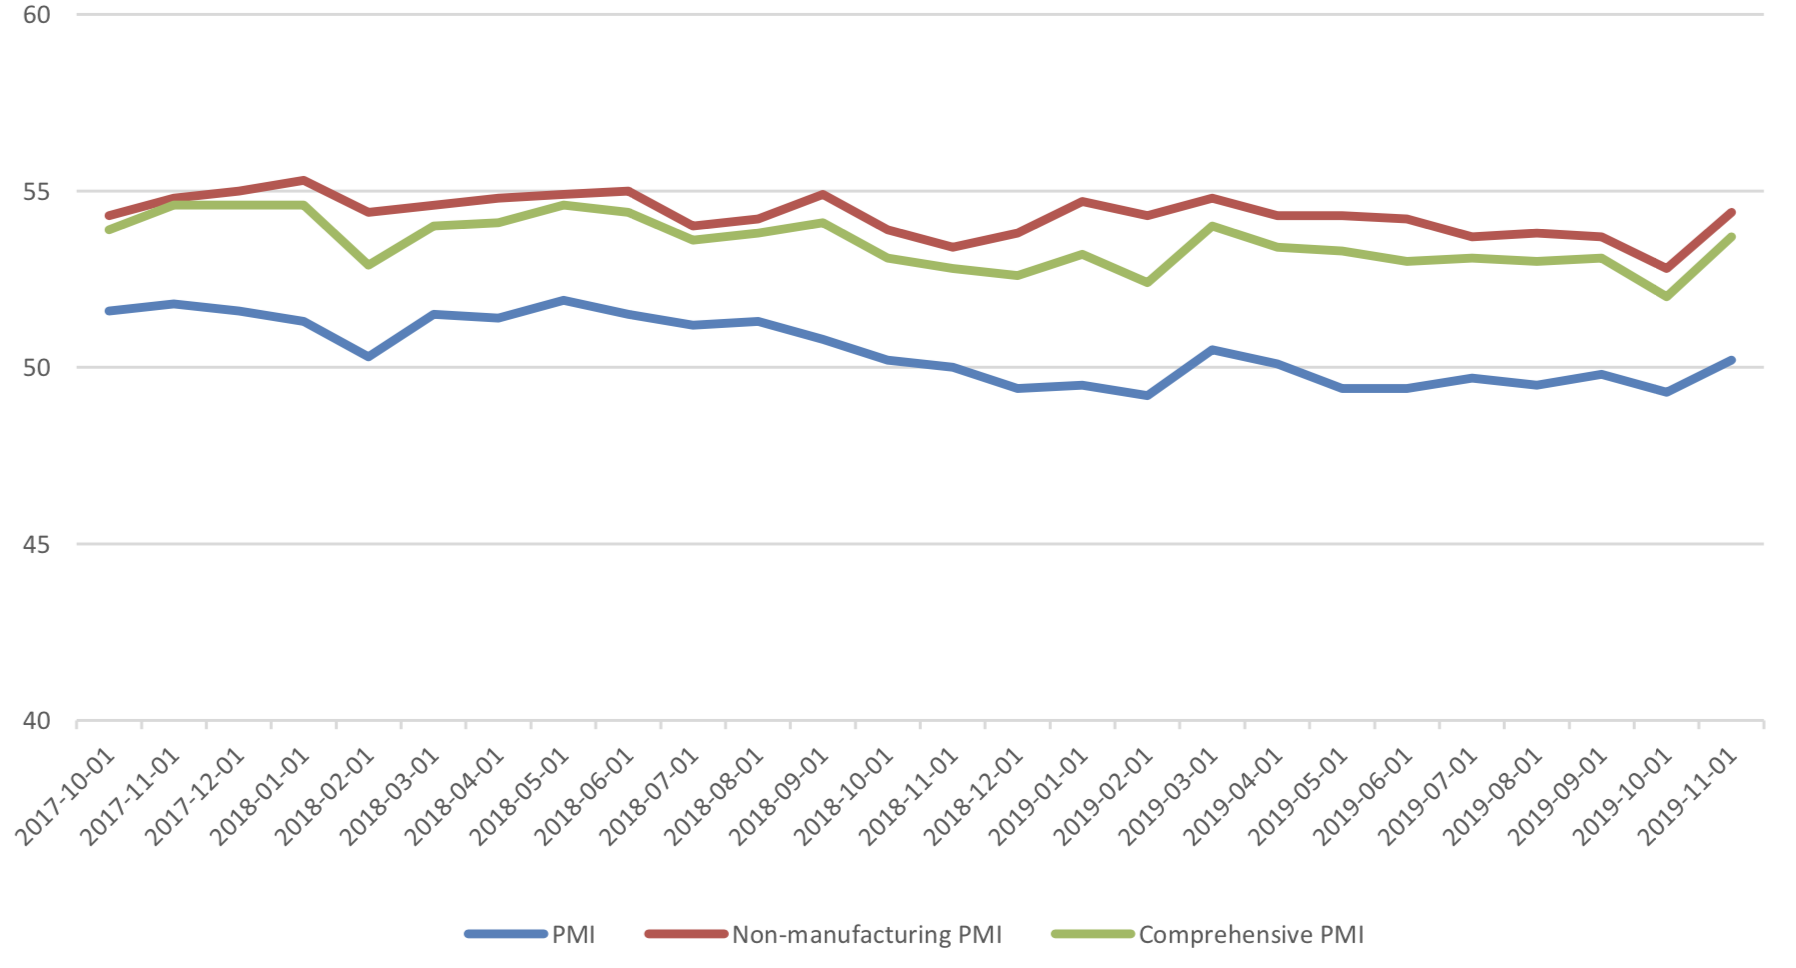
On 2019/11/30, the November PMI data was released. The data showed rebound of PMI in November after a decrease. The manufacturing PMI was 50.2 percent, with pre-value of 49.3 percent. The non- manufacturing PMI was at 54.4 percent, with pre-value of 52.8 percent, while the composite PMI was at 53.7 percent, with pre-value of 52 percent.
November PMI Data
Graph A: PMI Data
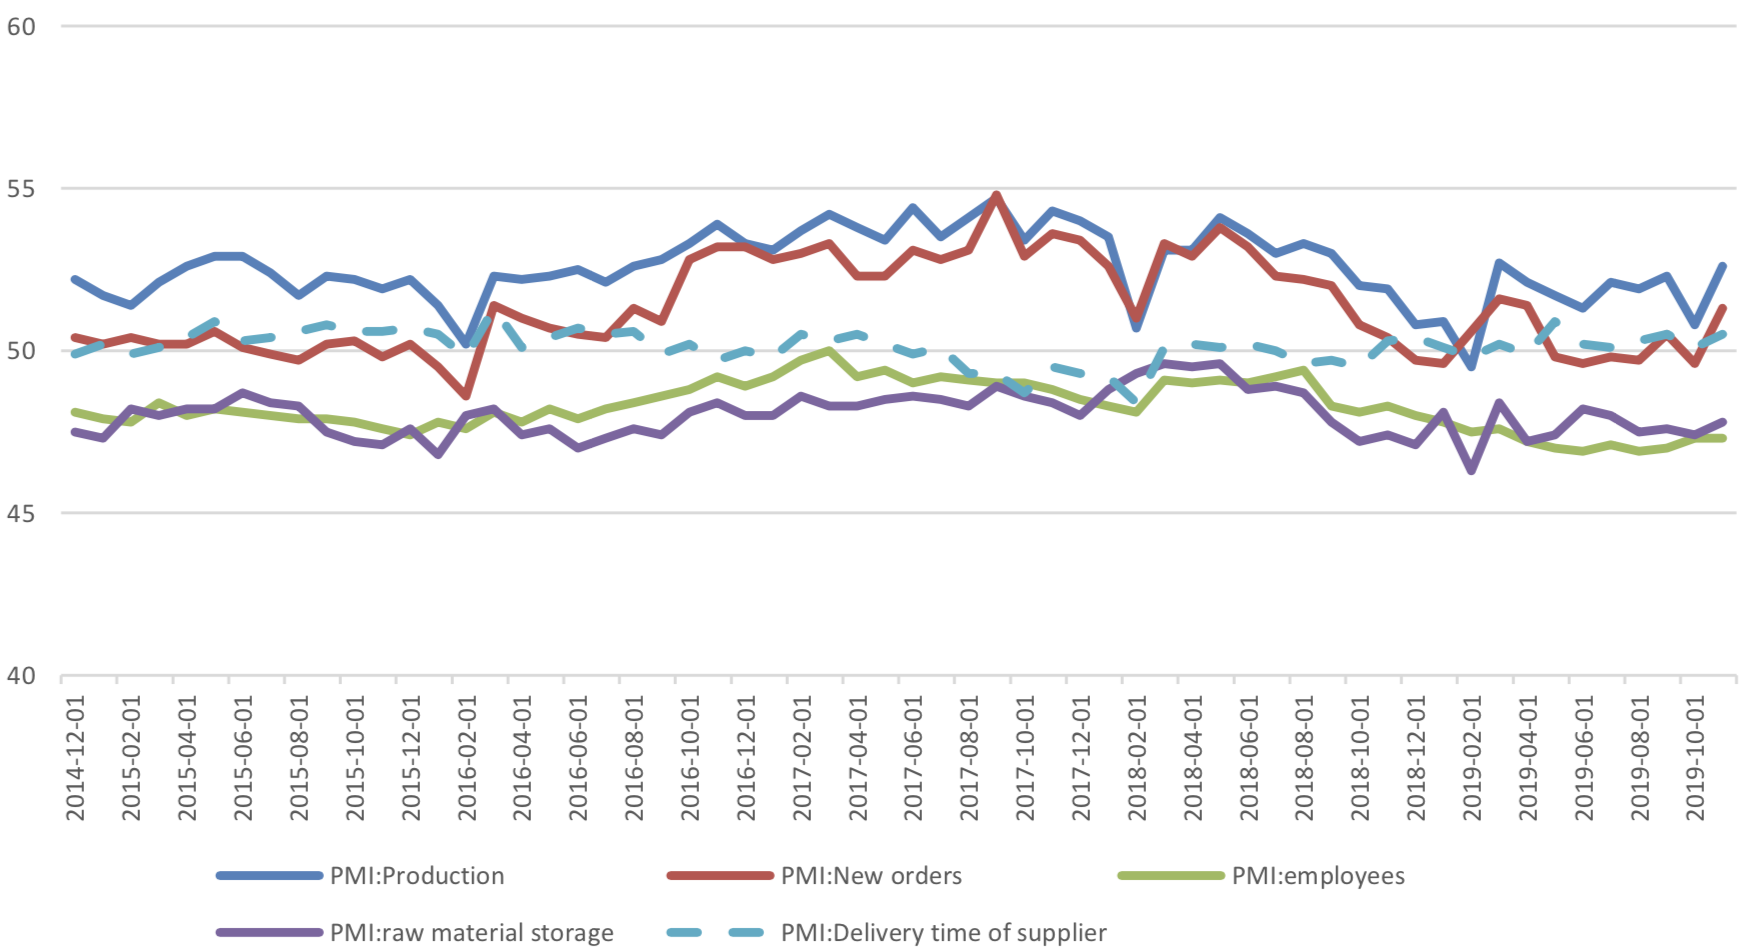
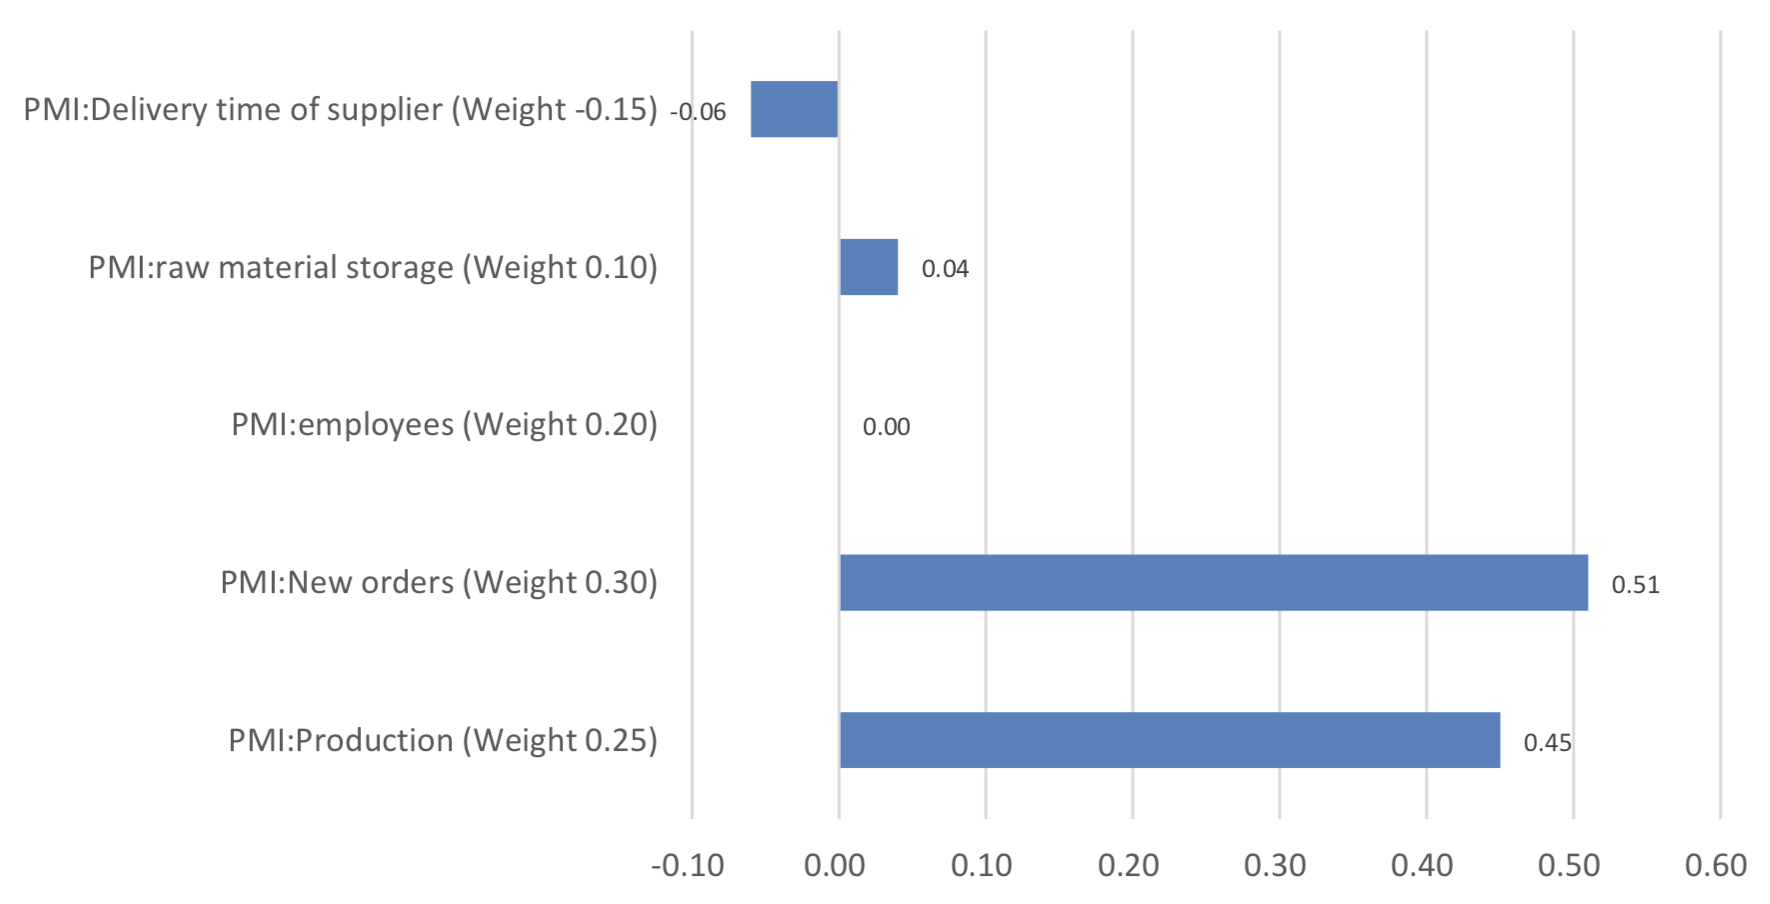
(1) About 5 Sub-indexes for manufacturing PMI calculation
From the point of view of 5 sub-indexes: (1) the increase of PMI: new orders is a major force to promote manufacturing PMI. It was reported at 51.3%, back to expansion zone, with preceding value of 49.6% and it promotes PMI for 0.51 percentage points. (2) The increase of PMI: production is another major force to promote manufacturing PMI. It was reported at 52.6%, still in expansion zone, with preceding value of 50.8% and it promotes PMI for 0.45 percentage points. (3)The increase of PMI: raw material storage, gave a minor force to promote manufacturing PMI. It was reported at 47.8%, still in contraction zone, with preceding value of 47.4% and it promotes PMI for 0.04 percentage points. (4) PMI: employees kept unchanged, 47.3%. (5) The rising of PMI: delivery time of supplier, is the minor force to drag manufacturing PMI. It was reported at 50.5%, still in contraction zone, with preceding value of 50.1% and it drags PMI for 0.06 percentage points.
Graph B: PMI 5 sub-indexes
Graph C: PMI Change Contribution by 5 Sub-indexes
(2) About 8 Sub-indexes not for manufacturing PMI calculation
2 of 8 sub-indexes are above 50, in expansion zone and the remaining indexes are in contraction zone. Several points need to mention: In November, PMI of finished product inventory dropped significantly, to 46.4%, with the previous value of 46.7%. Combined with the recovery of PMI of new orders, the characteristics of finished product inventory de stocking are obvious. From the perspective of PMI of raw material inventory and purchasing volume, it shows that the upstream investment has picked up, supporting the recovery of PMI of production. From the perspective of the relationship between raw material inventory PMI and finished product inventory PMI. The difference between the two increased from 0.7% to 1.4%. The upstream investment was obvious, while the downstream went into de stocking.
Graph D: PMI for 8 Sub-indexes not for manufacturing PMI calculation

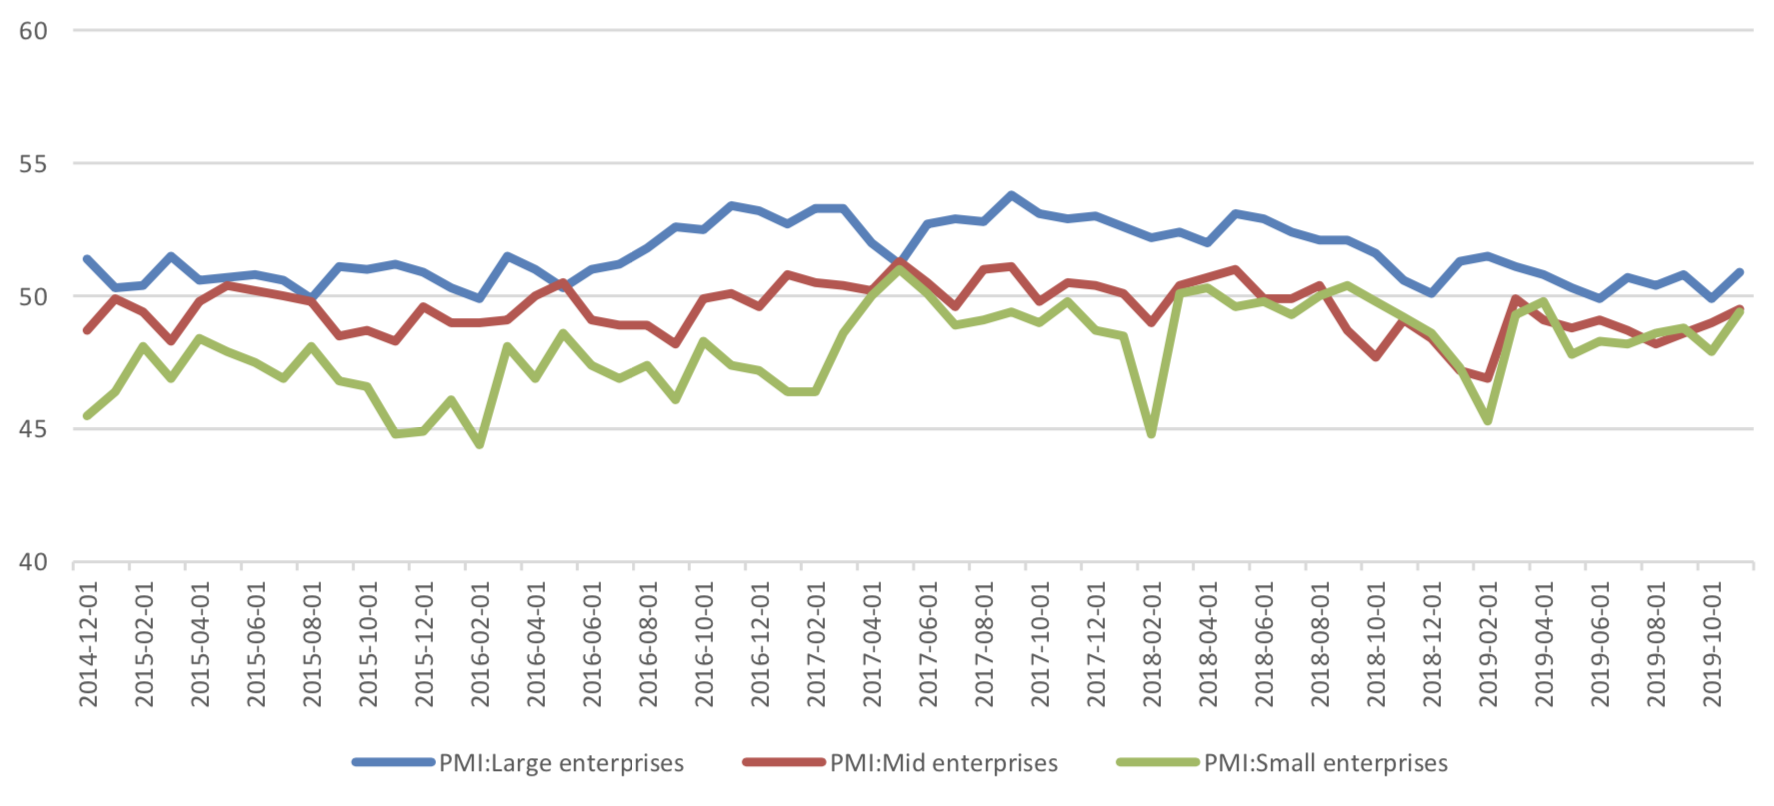
(3) PMI by enterprises size
From the perspective of PMI of large and medium-sized enterprises, there are improvements, but the PMI of small and medium-sized enterprises is still shrinking. Among them, the PMI of new export orders of small enterprises improved significantly, reaching 50%, and the previous value was only 43.7%. However, large and medium-sized enterprises have improved their PMI.
Graph E: PMI by enterprises size
(4) Summary
PMI improved in November, mainly due to the improvement of production PMI and new order PMI. The improvement of new orders is mainly due to the improvement of new export orders. To some extent, the improvement of PMI is related to countercyclical regulation, but the basis of economic recovery is still unstable, so the estimation of countercyclical regulation will not be relaxed.
Currently no Comments.
Hot Topics
The 13rd China International Future Forum
The Shanghai Derivatives Energy Forum has received extensive attention from relevant industries both within and outside the borders.
Financial institutions deep explore commodity market opportunities, commodity index financial products show full-scale trend
R-Code for analysis: getKDJ
R-Code@June 06, 2016
New indicator to analyze the arbitrage opportunities between sse50 and csi500
Market review: January 11, 2017
The Great China Bubble: Anniversary Lessons and Outlook
Quant Investment in China A-share market
The hedge strategy between SSE50 and A50--Jan 13,2017
The arbitraging strategy between CSI300 and SSE50
Market review: June 17, 2016
Sleepless in London--Enda Homan(Allied Irish Banks Plc)
MSCI Rebuffs Chinese Equities for Third Time in Blow to Xi
Soros, Druckenmiller among hedgies profiting in market plunge