FangQuant › Financial Futures
Market Summary:
Last week, there was generally decrease over the market. Shanghai SE Composite Index (000001.SH) changed -3.38 % to 2875.96. Specifically, small cap shares perform better than large cap shares and we can observe that CSI500 did better than SSE50 (-0.95% vs -2.75%). The average daily turnover of the whole market during past 5 trading days is 828.98 billion CNY, it increased 18.63% compared with the previous 5- trading day period.
During last week, impacted by the epidemic situation, the market decreased dramatically on Monday, then it experienced obvious rebounds. We can observe that the funds via stock connects were back to inflow. During last 5 trading days the total foreign fund flow via Stock Connect is 30.06 billion RMB, and the cumulative inflows was 1061.93 billion RMB. It is better off for the epidemic situation as the number of new case showed stop of increasing trend.
As for arbitrage opportunity, all futures current-month contracts show some room for arbitrage opportunities. Price spread for CSI500 next-month/current month contracts show room for arbitrage.
News:
(1) According to Chen Huanchun, a professor at Huazhong Agricultural University, CCTV News reported that the new coronavirus uses the same cells as SARS coronavirus to enter the receptor. It has 87.1% similarity with the SARS related virus found in bats and 79.5% similarity with SARS virus. The similarity with the coronavirus found in a bat sample from Yunnan is as high as 96%. The sequence similarity between pangolin virus and human virus is as high as 99%. It is found that the new coronavirus belongs to SARS coronavirus. According to the people's daily, pangolin may be the intermediate host of the new crown virus. Chen Huanchun, academician of the Chinese Academy of engineering and expert of the provincial research team for the prevention and control of the new crown pneumonia, Professor of Huazhong Agricultural University, said that there may be multiple intermediate hosts of the new crown virus. At present, 78% of new infectious diseases are related to wild animals. We should try our best to keep fewer wild animals, let alone eat wild animals.
(2) The notice issued by the joint defense and joint control mechanism of the State Council requires that: enterprises should resume production in an orderly manner, promote the return to work in batches and in an orderly manner, and formulate plans for resumption of production in different categories and batches as a whole; production of necessities such as epidemic prevention and control, energy supply, transportation and logistics, urban and rural operation, medical materials and food, feed production, market circulation and sales, etc., which are related to the national economy and people's livelihood In the field, it is necessary to guarantee the conditions to immediately promote the resumption of work and production, and the staff of major projects and key projects should return to their posts in time and start work as soon as possible.
(3) Securities Times: this week, the holdings by Northbound funds increased by 20 industries on a month- on-month basis, and the number of shares in commercial trade, computer and leisure services increased by more than 10% on a month-on-month basis. Among them, the most obvious increase was in the commercial trade sector, with Beijing capital holding 1.062 billion shares this week, up 12.48% month on month. This week's reduction was the most obvious in the textile and clothing industry, with Beijing Capital Holding 297 million shares, down 2.61% month on month
(4) From 0:00 to 24:00 on February 8, 31 provinces (autonomous regions, municipalities directly under the central government) and Xinjiang production and Construction Corps reported 2656 new confirmed cases (2147 in Hubei), 87 new severe cases (52 in Hubei), 89 new deaths and 3916 new suspected cases (2067 in Hubei). As of 24:00 on February 8, there are 33738 confirmed cases (including 6188 severe cases), 2649 cured and discharged cases, 811 dead cases, 37198 confirmed cases and 28942 suspected cases in China.
(5) Broker China: according to the monitoring data, in January 2020, the loan interest rate of the first set of housing in 20 cities decreased on a month-on-month basis, while that of Harbin decreased by 23 BPS on a substantial basis; the loan interest rate of the first set of housing in 11 cities increased, and that of Wuxi increased by 5 bps. In the first tier cities, Beijing reduced 1bp on a month on month basis, Guangzhou reduced 4bp on a month on month basis, and the average interest rates of first home loans in Shanghai and Shenzhen decreased by 5 BPS on a month on month basis. After the reduction, the interest rates of first home loans in Shanghai fell to 4.82%, a record low in the past two and a half years.
(6) Wang Bin, deputy director of the market operation Department of the Ministry of Commerce: further expand the import of urgently needed shortage materials, increase the import of pork, enrich the domestic reserves, and timely put the State Reserve pork; organize the import of masks, protective clothing, protective glasses, etc. urgently needed in China, supplement the urgent need in China, and serve epidemic prevention and control.
1. StockMarket
(1) Indices Performance
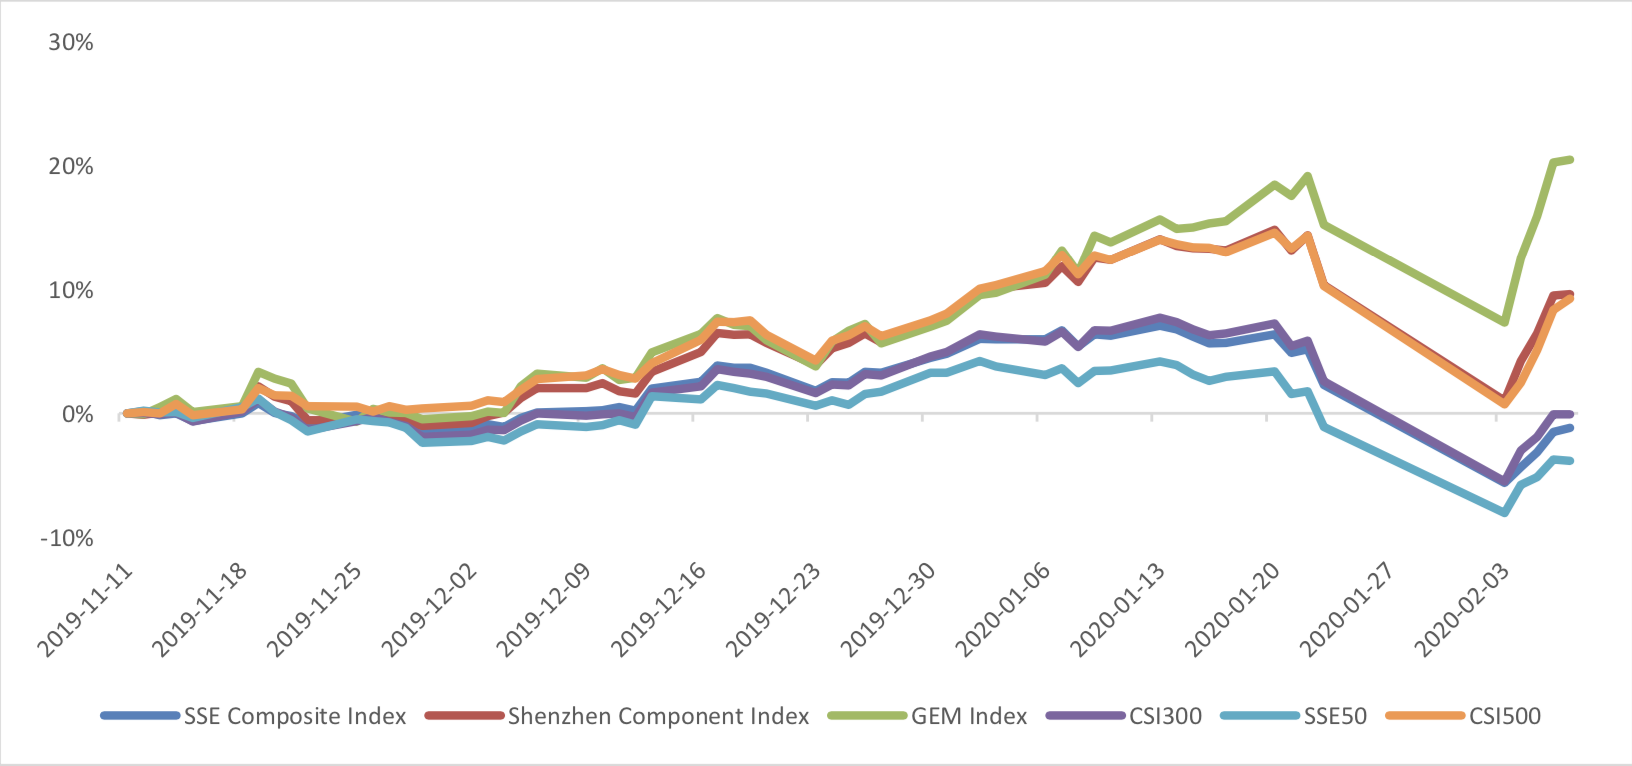
During last week, Shanghai SE Composite Index (000001.SH) changed -3.38 % to 2875.96, Shenzhen Component Index (399001.SZ) changed -0.66 % to 10611.55, ChiNext Price Index (399006.SZ) changed 4.57 % to 2015.80, CSI 300 INDEX (000300.SH) changed -2.60 % to 3899.87, CSI SmallCap 500 index (000905.SH) changed -0.94 % to 5327.04, SSE 50 Index (000016.SH) changed -2.75 % to 2851.71.
Graph 1: Indices Performance over past 3 months
The average daily turnover of the whole market during past 5 trading days is 828.98 billion CNY, it increased 18.63% compared with the previous 5-trading day period.
Graph 2: Market turnover

In the view of sectors, during last week (from 2020-01-31 to 2020-02-07), 8 of 24 Wind Level-2 sector(s) increased while 16 sector(s) dropped. Specifically, Health Care Equipment & Services(9.41%), Telecommunication Services (7.05%) and Software & Services(5.95%) did the best performance while Real Estate (-7.27%), Retailing(-6.46%) and Diversified Financials(-6.19%) did the worst performance.
Graph 3: Sectors performance under Wind Level-2 classification (%)

(3) Indices Valuation (TTM)
The current PE for SSE Composite Index, Shenzhen Component Index, GEM Index, CSI300, SSE50, CSI500 are 12.3886, 24.8175, 58.1347, 11.7625, 9.2087, 24.8845respectively; and these indices are at 10.20%, 36.50%, 80.30%, 19.80%, 8.80%, 23.80% percent rank level of their historic data, respectively
Graph 4: PE of 6 indices

Graph 5: PE percent rank of 6 indices (calculated by data of past 1200 trading days, only 1Y data is presented on the graph)

The current PB for SSE Composite Index, Shenzhen Component Index, GEM Index, CSI300, SSE50, CSI500 are 1.3199,2.7166,6.1200,1.4151,1.1320, 1.8347respectively, and these indices are at 6.30%, 31.40%, 71.80%, 18.30%, 8.10%, 20.60% percent rank level of their historic data, respectively.
Graph 6: PB of 6 indices

Graph 7: PB percent rank of 6 indices (calculated by data of past 1200 trading days, only 1Y data is presented on the graph)

(4) Foreign Fund Flow
During last 5 trading days the total foreign fund flow via Stock Connect is 30.06 billion RMB, and the cumulative inflows was 1061.93 billion RMB. Specifically, the fund flow via Shanghai-Hong Kong Stock Connect is 18.09 billion RMB and the fund flow via Shenzhen-Hong Kong Stock Connect is 11.97 billion RMB.
Graph 8: Fund flow via both Shanghai and Shenzhen-Hong Kong Stock Connect in past 1M (100 million CNY)

Graph 9: Fund flow via Shenzhen-Hong Kong Stock Connect in past 1M (100 million CNY)

Graph 10: Fund flow via both Shanghai-Hong Kong Stock Connect in past 1M (100 million CNY)

(5) Margin Trading
According to the newest data, the margin financing balance is 967.84 billion, securities borrowing is
13.47 billion, totally 981.31 billion.
Graph 11: Margin Trading(100m RMB)

2. Index Futures
(1) Trading Volume and Open Interests
During past 5 trading days the average trading volume for CSI300(IF), SSE50(IH), CSI500(IC) contracts
are 129038 (31.29%, the previous 5-trading day period),50969 (39.80%),131283 (10.75%) lots, respectively. On the last trading day, the total open interests for them are 139351 (5.81%),62992 (2.75%),178333 (-3.11%) lots respectively.
Graph 12: CSI300 Index futures’ trading volume

Graph 13: CSI300 Index futures’ open interests

Graph 14:SSE50 Index futures’ trading volume

Graph 15: SSE50 Index futures’ open interests

Graph 16: CSI500 Index futures’ trading volume

Graph 17: CSI500 Index futures’ open interests

(2) Roll Level Bid-Ask Distribution Worked form last 3 trading days.
Graph 18: CSI300 Current/Next Month Contract Roll Spread Distribution (2s frequency)

Graph 19: SSE50 Current/Next Month Contract Roll Spread Distribution (2s frequency)

Graph 20: CSI500 Current/Next Month Contract Roll Spread Distribution (2s frequency)

Assumption: risk-free rate: 3%; security borrowing cost: 8%; trading expense for spot: 0.025%; trading expense for futures: 0.005%; margin rates for futures contracts: 0.11 for CSI300 and SSE50, 0.13 for CSI500; margin rate for security borrowing: 0.3 (or 130% maintain rate).
When real price spread is out of theoretical range (calculated by our assumption), there exists absolute future-spot arbitrage opportunity.
Graph 21: Future (Current Month)-Spot Arbitrage Opportunity for CSI300 contract (in the view of price difference)

Graph 22: Future (Current Month)-Spot Arbitrage Opportunity for SSE50 contract (in the view of price difference)

Graph 23: Future (Current Month)-Spot Arbitrage Opportunity for CSI500 contract (in the view of price difference)

Graph 24: Future (Next Month-Current Month) Arbitrage Opportunity for CSI300 contract (in the view of price difference)

Graph 25: Future (Next Month-Current Month) Arbitrage Opportunity for SSE50 contract (in the view of price difference)

Graph 26: Future (Next Month-Current Month) Arbitrage Opportunity for CSI500 contract (in the view of price
difference)

(4) Roll Spread of Stock Index Futures Tracking
Calculated as the contract price of the current month minus the contract price of the following month, for the long roll, the positive calculation results are gains, the negative calculation results are losses. Code 00 in the figure represents the current month contract, 01 the next month contract, 02 the current quarter contract, 03 the next quarter contract.
(a)IF
Up to2020/2/7,the best roll plan is IF00-IF03,annualized roll yield in monthly term is1.05%。
Graph 27: IF Current month contract roll yield comparison (index point)

Graph 28: IF Current month contract roll yield comparison (annualized return)

(b)IH
Up to 2020/2/7,the best roll plan is IH00-IH03,annualized roll yield in monthly term is1.30%。
Graph 29: IH Current month contract roll yield comparison (index point)

Graph 30: IH Current month contract roll yield comparison (annualized return)

(c)IC
Up to2020/2/7,the best roll plan isIC00-IC03,annualized roll yield in monthly term is9.55%。
Graph 31: IC Current month contract roll yield comparison (index point)

Graph 32: IC Current month contract roll yield comparison (annualized return)

(5) Basis Tracking of Stock Index Futures
For long side, if the base difference is positive, the change of the base difference brings losses, and if the base difference is negative, the change of the base difference brings profits.
(a)IF
For long side hedge, up to 2020/2/7, IF00 was in discount, other IF contracts were in premium. Here IF next month contract basis return annualized yield is 1.36%。
Graph 33: IF contracts basis

Table 1: IF basis return calculation

(b)IH
For long side hedge, up to 2020/2/7,IH00 was in discount, other IH contracts were in premium. Here
IH next month contract basis return annualized yield is 2.79%。
Graph 34: IH contracts basis

Table 2: IH basis return calculation

(c)IC
For long side hedge, up to 2020/2/7, IC00 was in premium, other IC contracts were in discount. Here
IC next month contract basis return annualized yield is 10.60%。
Graph 35: IC contracts basis

Table 3: IC basis return calculation

3. Financial Markets
(1) Interest Rates
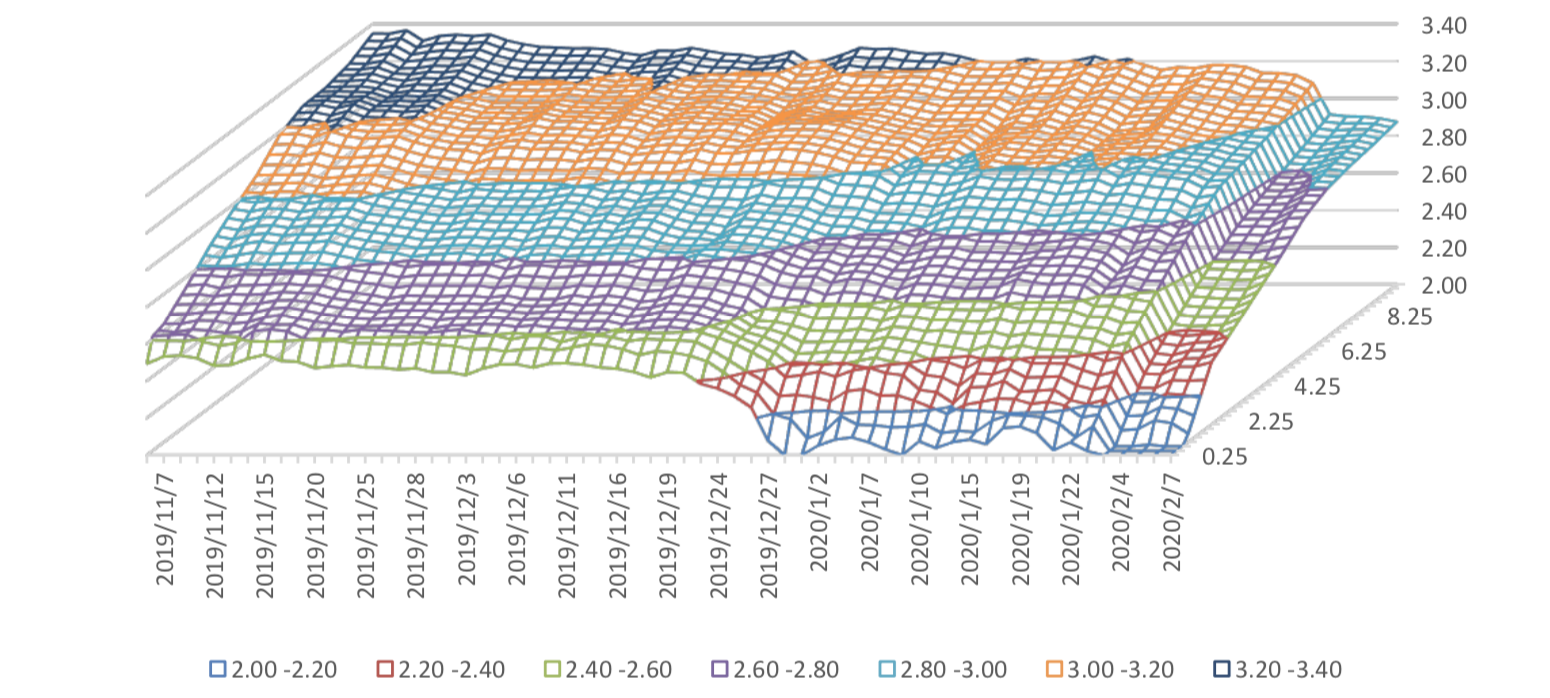
The term structure of treasury bonds’ yields is currently upward sloping in concave shape.
Specifically, last week, short-term yields short term yield of Treasury bond experienced some fluctuation and 3M yield now at 2.0%-2.2% level. Furthermore, as for long-term yield, there is a small drop. 10Y yield is about 3.0%-3.2%.
Graph 36: Term Structure Evolvement of Treasury Bonds Yields During Recent 3 Months (%)
As for Shibor rates, short-term rates experienced significant fluctuation. Specifically, O/N rate experienced obvious fluctuation to 1.6%-1.8% level.
Graph 37: Term Structure Evolvement of Shibor Rates During Recent 3 Months (%)

(2) ExchangeRates
During last week, CNY/USD changed 0.808% to 6.9860 and offshore rate, CNH/USD, changed 1.12% to 7.0068 and USD index changed 1.05%.
Graph 38: USD/CNY, USD/CNH and USD Index

Macroeconomic Topic:
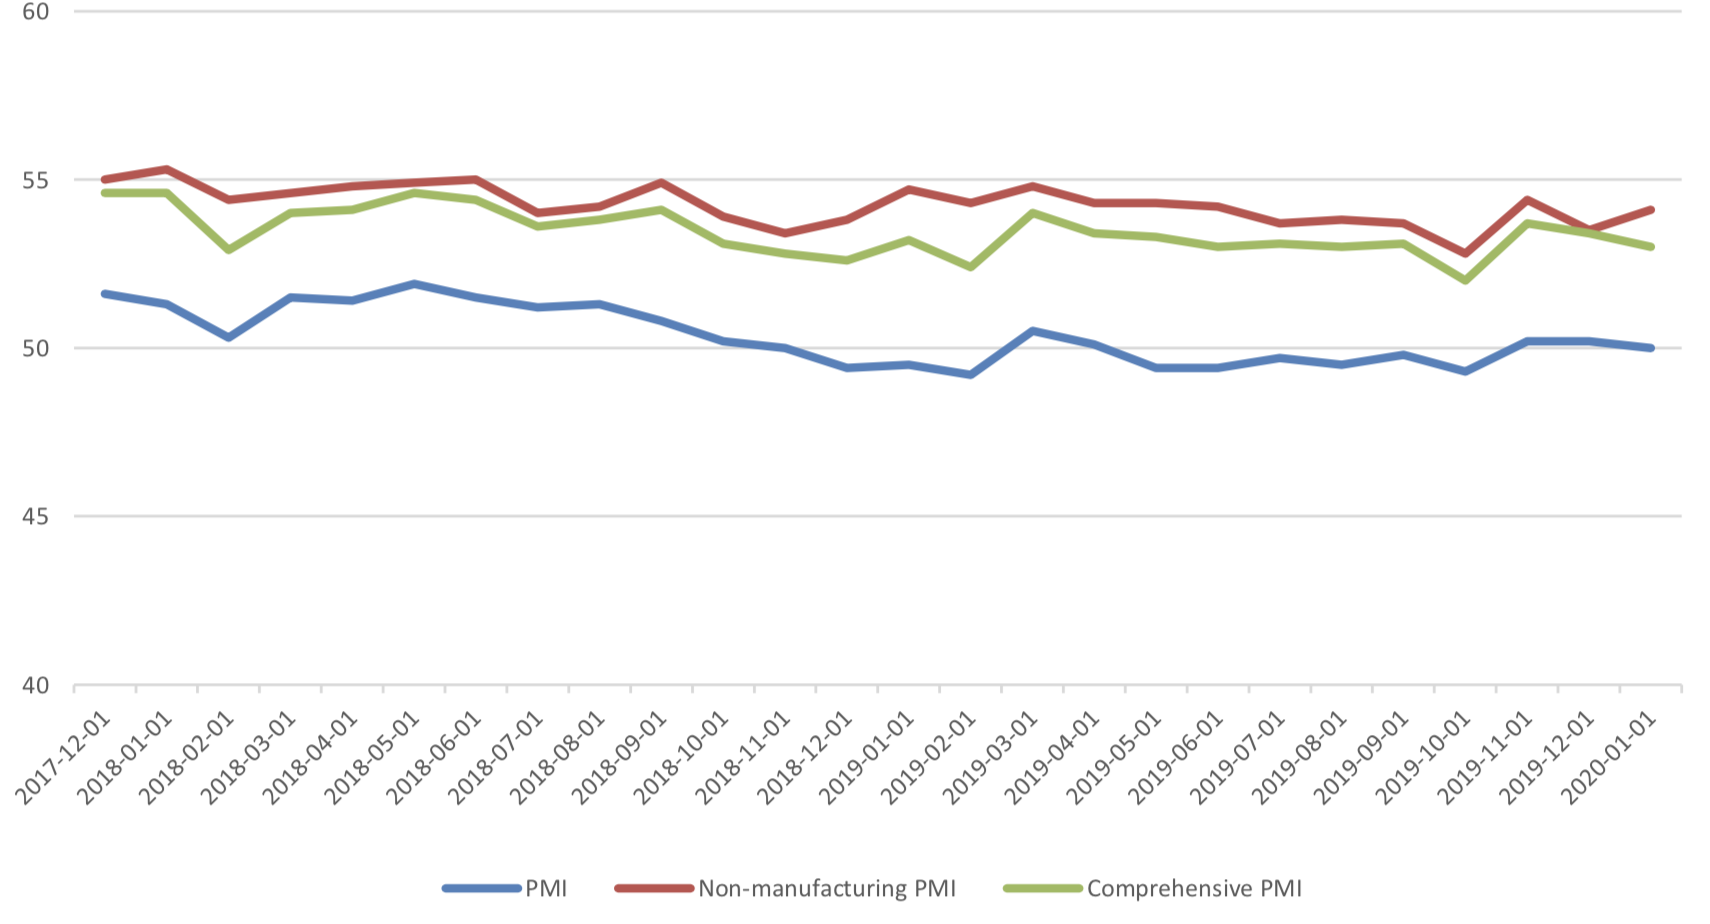
On 2020/1/31, the January PMI data was released. The data showed PMI in January slightly. The manufacturing PMI was 50.0 percent, with pre-value of 50.2 percent. The non-manufacturing PMI was at 54.1 percent, with pre-value of 53.4percent, while the composite PMI was at 53.0 percent, with pre-value of 53.4 percent.
January PMI Data
Graph A: PMI Data
(1) About 5 Sub-indexes for manufacturing PMI calculation
From the point of view of 5 sub-indexes: (1) the dropping of PMI: delivery time of supplier, is the major force to promote manufacturing PMI. It was reported at 49.9%, back to expansion zone, with preceding value of 51.1% and it promotes PMI for 0.18 percentage points. (2)The increase of PMI: new orders is a minor force to promotes manufacturing PMI. It was reported at 51.4%, still in expansion zone, with preceding value of 51.2% and it promotes PMI for 0.06 percentage points. (3) The increase of PMI: employees is another minor force to promotes manufacturing PMI. It was reported at 47.5%, still in contraction zone, with preceding value of 47.2% and it promotes PMI for 0.04 percentage points. (4) The decrease of PMI: production is major force to drag manufacturing PMI. It was reported at 51.3%, still in expansion zone, with preceding value of 53.2% and it drags PMI for 0.48 percentage points. (5) The decrease of PMI: raw material storage, gave another minor force to drag manufacturing PMI. It was reported at 47.1%, still in contraction zone, with preceding value of 47.2% and it promotes PMI for 0.01 percentage points.
Graph B: PMI 5 sub-indexes

Graph C: PMI Change Contribution by 5 Sub-indexes

(2) About 8 Sub-indexes not for manufacturing PMI calculation
3 of 8 sub-indexes are above 50, in expansion zone and the remaining indexes are in contraction zone.
Graph D: PMI for 8 Sub-indexes not for manufacturing PMI calculation

(3) PMI by enterprises size
From the perspective of PMI of large and medium-sized enterprises, both dropped but still in expansion area; small enterprises rose sharply in the contraction area.
Graph E: PMI by enterprises size

(4) Summary
Due to the impact of statistical cycle, the data do not reflect the impact of coronavirus. The fermentation of coronavirus events is after January 20, especially during the Spring Festival. Therefore, the data is distorted and has no reference significance. But it also shows the downward pressure of the economy to some extent.
Currently no Comments.
Hot Topics
The 13rd China International Future Forum
The Shanghai Derivatives Energy Forum has received extensive attention from relevant industries both within and outside the borders.
Financial institutions deep explore commodity market opportunities, commodity index financial products show full-scale trend
R-Code for analysis: getKDJ
R-Code@June 06, 2016
New indicator to analyze the arbitrage opportunities between sse50 and csi500
Market review: January 11, 2017
The Great China Bubble: Anniversary Lessons and Outlook
Quant Investment in China A-share market
The hedge strategy between SSE50 and A50--Jan 13,2017
The arbitraging strategy between CSI300 and SSE50
Market review: June 17, 2016
Sleepless in London--Enda Homan(Allied Irish Banks Plc)
MSCI Rebuffs Chinese Equities for Third Time in Blow to Xi
Soros, Druckenmiller among hedgies profiting in market plunge