FangQuant › Financial Futures
Market Summary:
Last week, there was generally increase over the market. Shanghai SE Composite Index (000001.SH) changed 1.43 % to 2917.01. Specifically, small cap shares perform better than large cap shares and we can observe that CSI500 did better than SSE50 (1.76% vs 1.52%). The average daily turnover of the whole market during past 5 trading days is 829.20 billion CNY, it increased 0.03% compared with the previous 5-trading day period.
Novel coronavirus infection in China is expected to slow down soon, based on mathematical models, recent development and actions taken by the government. The peak is expected to occur in mid and late February, and the epidemic may end in April, academician Zhong Nanshan told Reuters in an interview on 2/11. Therefore, the impact of the epidemic on the economy is mainly concentrated in the first quarter.
As for arbitrage opportunity, all futures current-month contracts show some room for arbitrage opportunities. Price spread for CSI500 next-month/current month contracts show room for arbitrage.
News:
(1) Securities Times: it is learned from the relevant people close to the regulatory level that during the epidemic prevention and control period, the IPO Acceptance Review and licensing work are normally promoted, and the normal issuance of new shares is not affected. It is understood that in order to reduce the flow and aggregation of issuers, intermediaries and other relevant subjects, and effectively block the epidemic, the CSRC has not called the Development Review Committee for the time being. As of February 14, 52 enterprises have passed the examination and Approval Committee and have not yet issued the approval documents. The CSRC will issue the approval documents in an orderly manner after the completion of the necessary procedures for these enterprises, such as the examination of sealed volumes and matters after the meeting, in accordance with the established working procedures.
(2) Xinhua News Agency: at present, with the positive results of epidemic prevention and control, and the orderly progress of resumption of work, China's economy shows resilience and potential. Looking at the overall situation and in the long run, the trend of China's long-term sound economic development has not changed. China's economy is a sea, not a small pond. The short-term wind and waves will not overturn the sea.
(3) First finance and Economics: Wei Zhen, research director of MSCI China, said that under the impact of the epidemic, A-share market did not stop trading in large areas this time, which reflects the continuous maturity of the market; it is suggested that A-share market can appropriately enrich risk hedging tools; the specific launch time of MSCI China A-share index futures still depends on the attitude of Chinese regulators.
(4) China's News Net: WHO director general Tan Tak said that China's measures have won time for the global response to the new crown pneumonia outbreak. The WHO team of experts has arrived in China and is working closely with Chinese counterparts to understand the epidemic situation and provide suggestions for the next global response.
(5) The general office of China Banking and Insurance Regulatory Commission issued a notice on further financial services for epidemic prevention and control, requiring full support for epidemic prevention and control enterprises to expand production capacity, focus on the needs of epidemic prevention and control, make full efforts to do well in the key areas of health care such as treatment drugs, vaccine research and development, as well as financing support for important material production, transportation and logistics and other related enterprises; increase the loan investment in manufacturing industry, Strengthen the supply chain financial services; increase the internal resources of Inclusive Finance, improve the "first loan rate" and the proportion of credit loans of small and micro enterprises, and further reduce the comprehensive financing cost of small and micro enterprises.
(6) Securities Times: Deputy Director of the State Administration of foreign exchange, Xuan Chang Neng: the balance of payments situation will not be changed because of the new the epidemic situation. China's current account is running smoothly, the ratio of current account surplus to GDP is in a reasonable range, and cross-border capital flows are basically balanced.
1. StockMarket
(1) Indices Performance
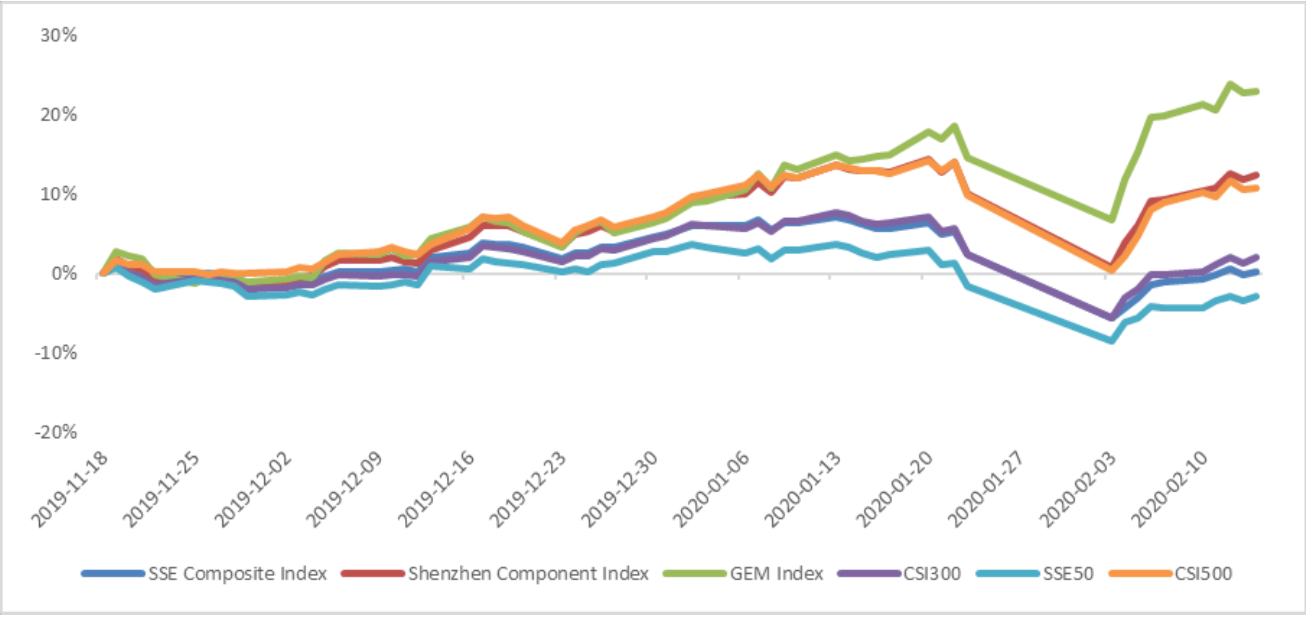
During last week, Shanghai SE Composite Index (000001.SH) changed 1.43 % to 2917.01, Shenzhen Component Index (399001.SZ) changed 2.87 % to 10916.31, ChiNext Price Index (399006.SZ) changed 2.65 % to 2069.22, CSI 300 INDEX (000300.SH) changed 2.25 % to 3987.73, CSI SmallCap 500 index (000905.SH) changed 1.76 % to 5420.80, SSE 50 Index (000016.SH) changed 1.52 % to 2895.06.
Graph 1: Indices Performance over past 3 months
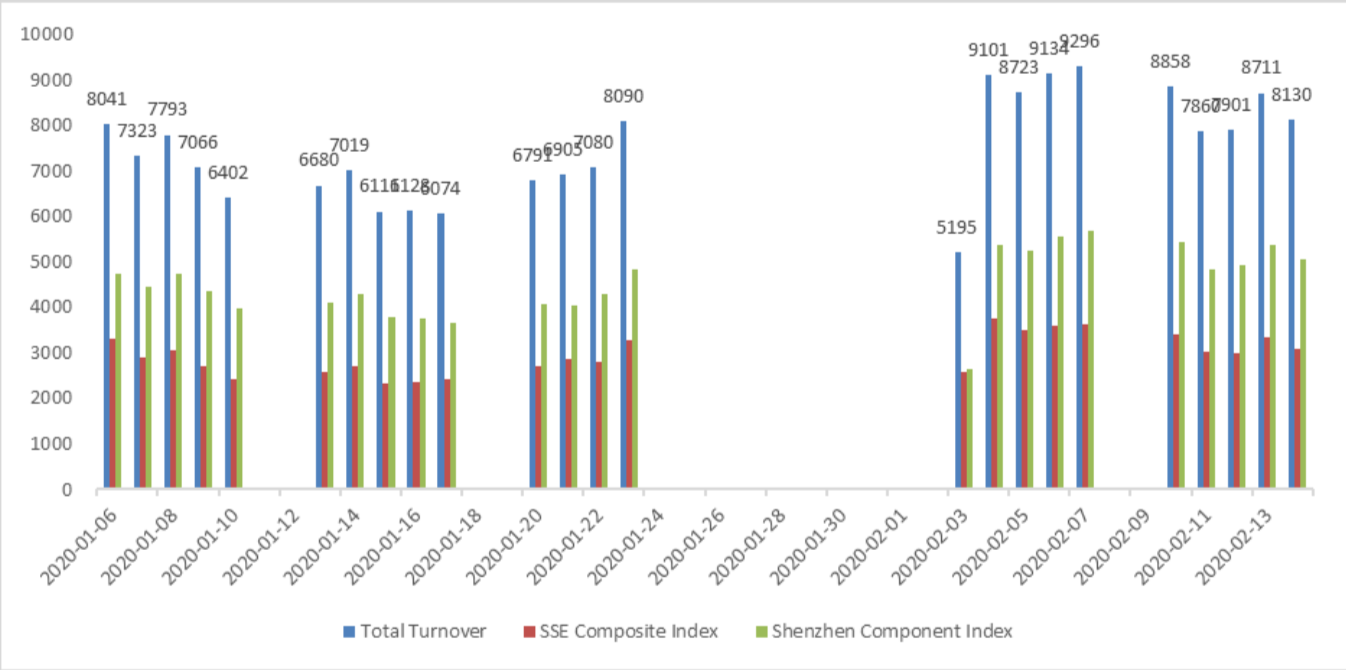
The average daily turnover of the whole market during past 5 trading days is 829.20 billion CNY, it increased 0.03% compared with the previous 5-trading day period.
Graph 2: Market turnover
(2) Sectors Performance
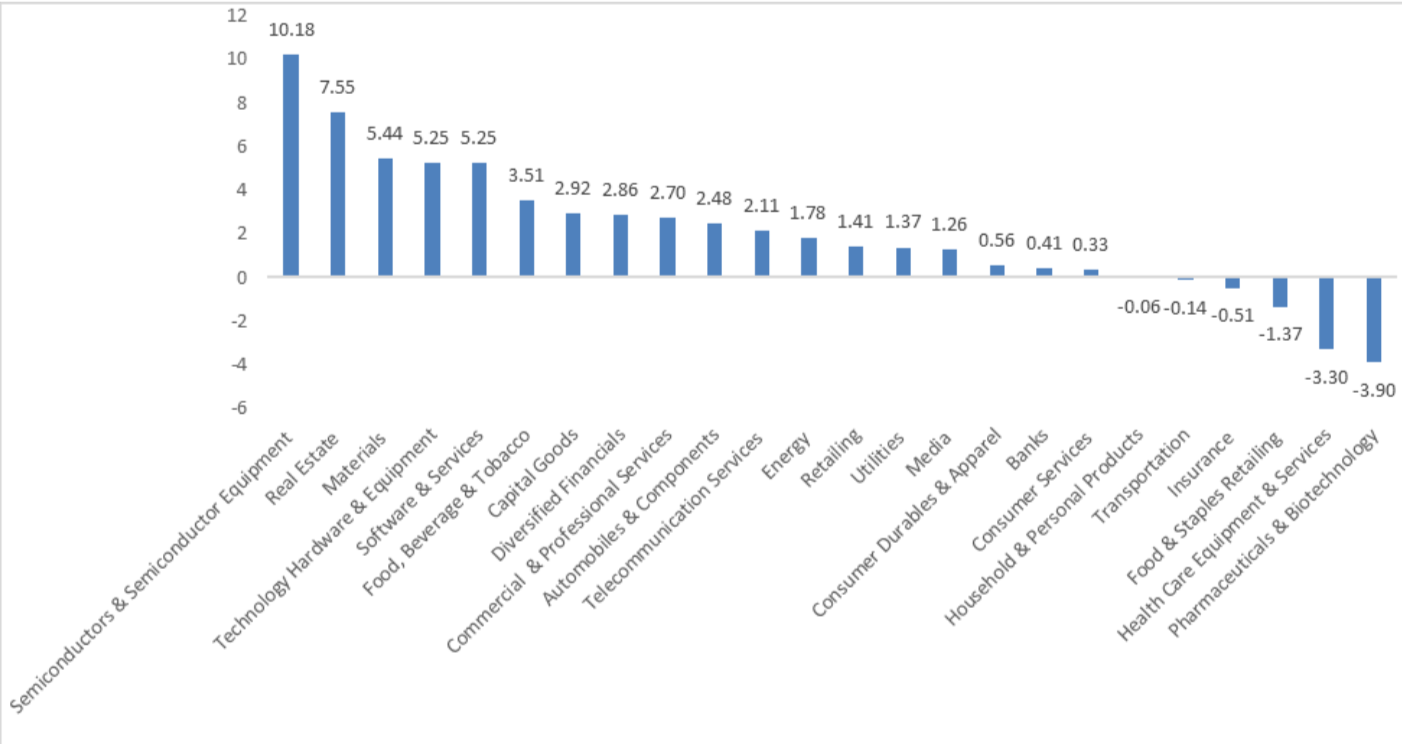
In the view of sectors, during last week (from 2020-02-07 to 2020-02-14), 18 of 24 Wind Level-2 sector(s) increased while 6 sector(s) dropped. Specifically, Semiconductors & Semiconductor Equipment (10.18%), Real Estate (7.55%) and Materials (5.44%) did the best performance while Pharmaceuticals & Biotechnology(-3.90%), Health Care Equipment & Services(-3.30%) and Food & Staples Retailing (-1.37%) did the worst performance.
Graph 3: Sectors performance under Wind Level-2 classification (%)
(3) Indices Valuation (TTM)
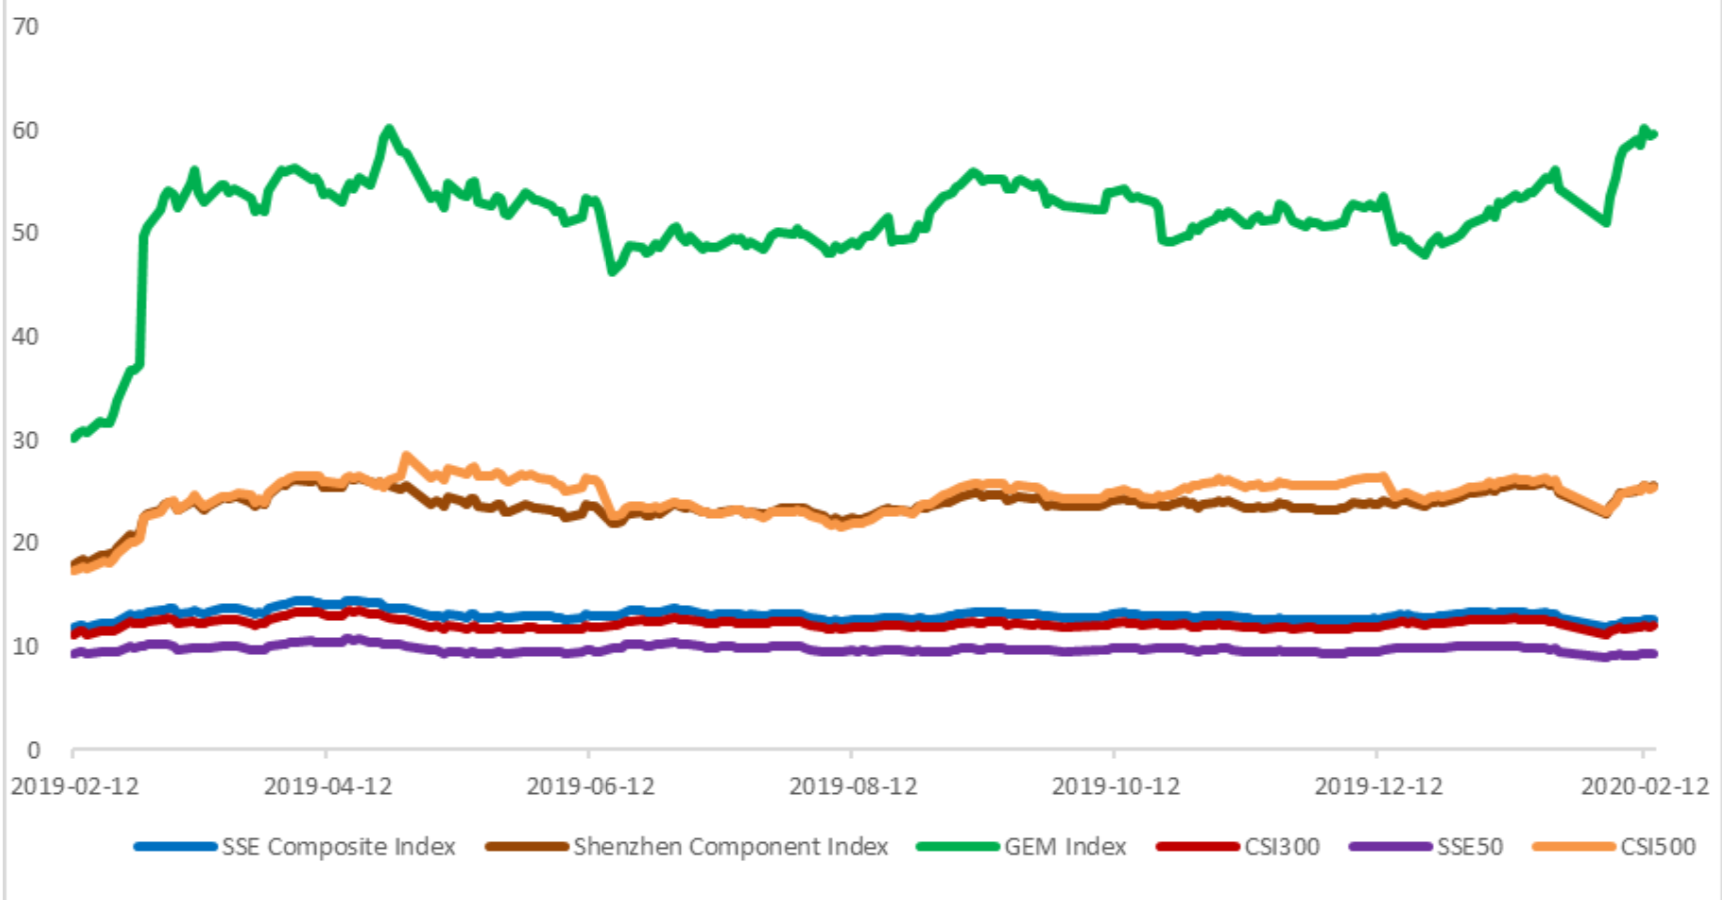
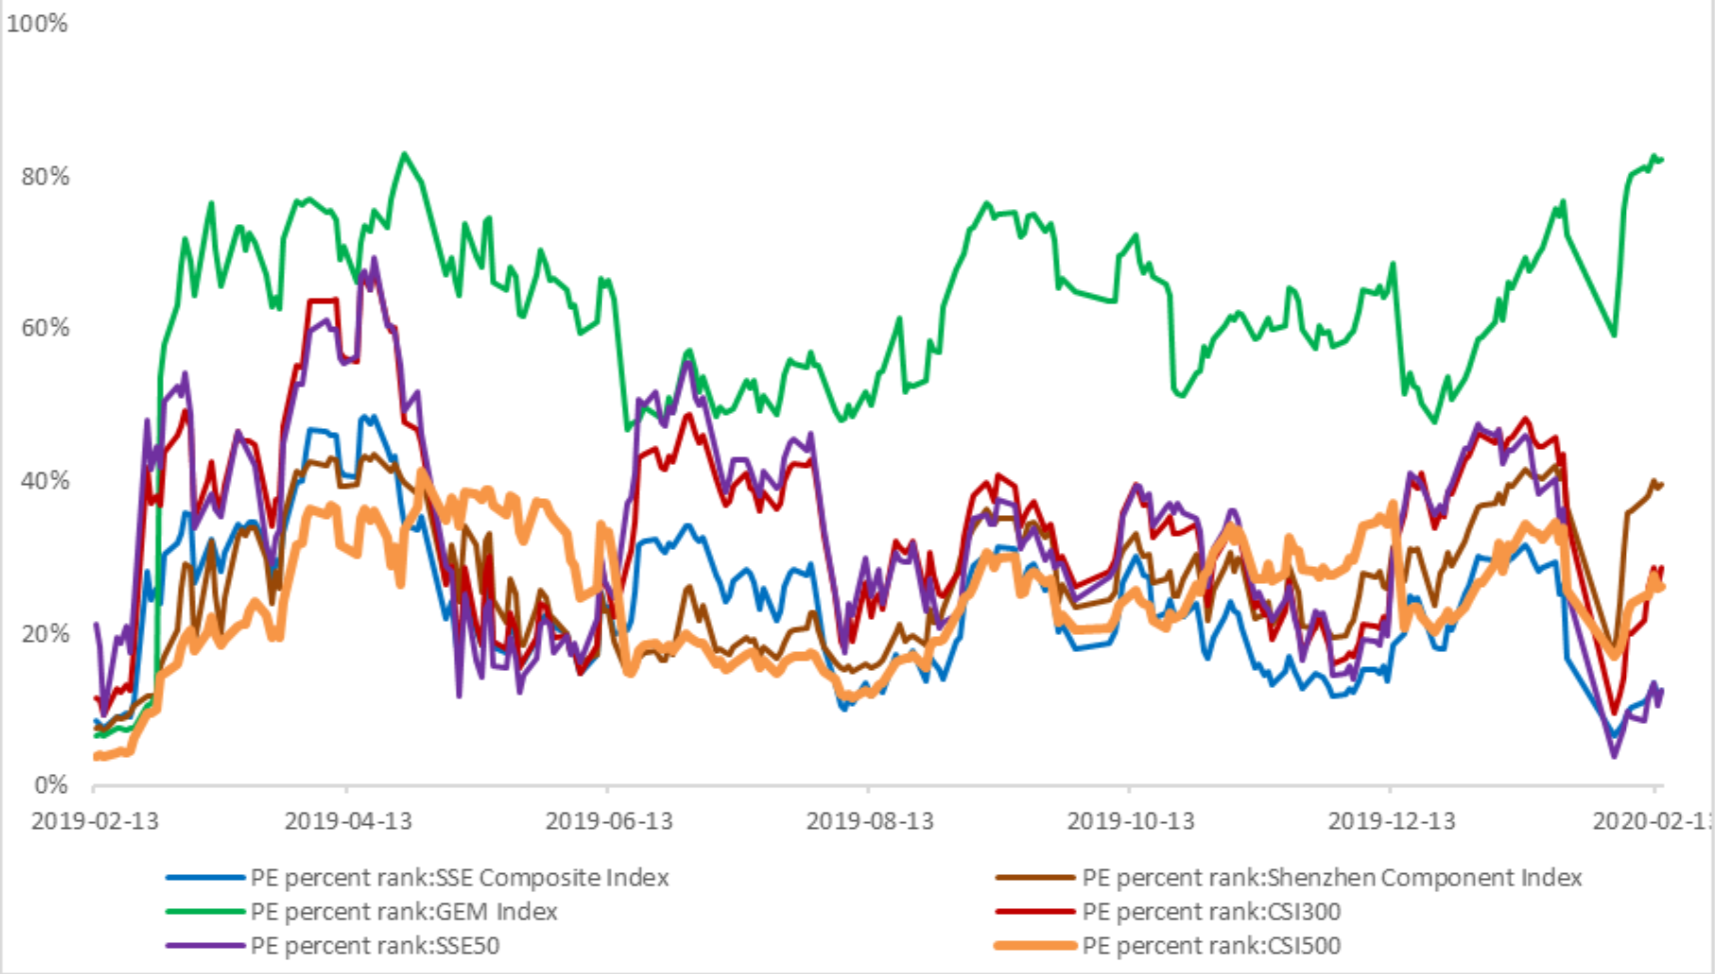
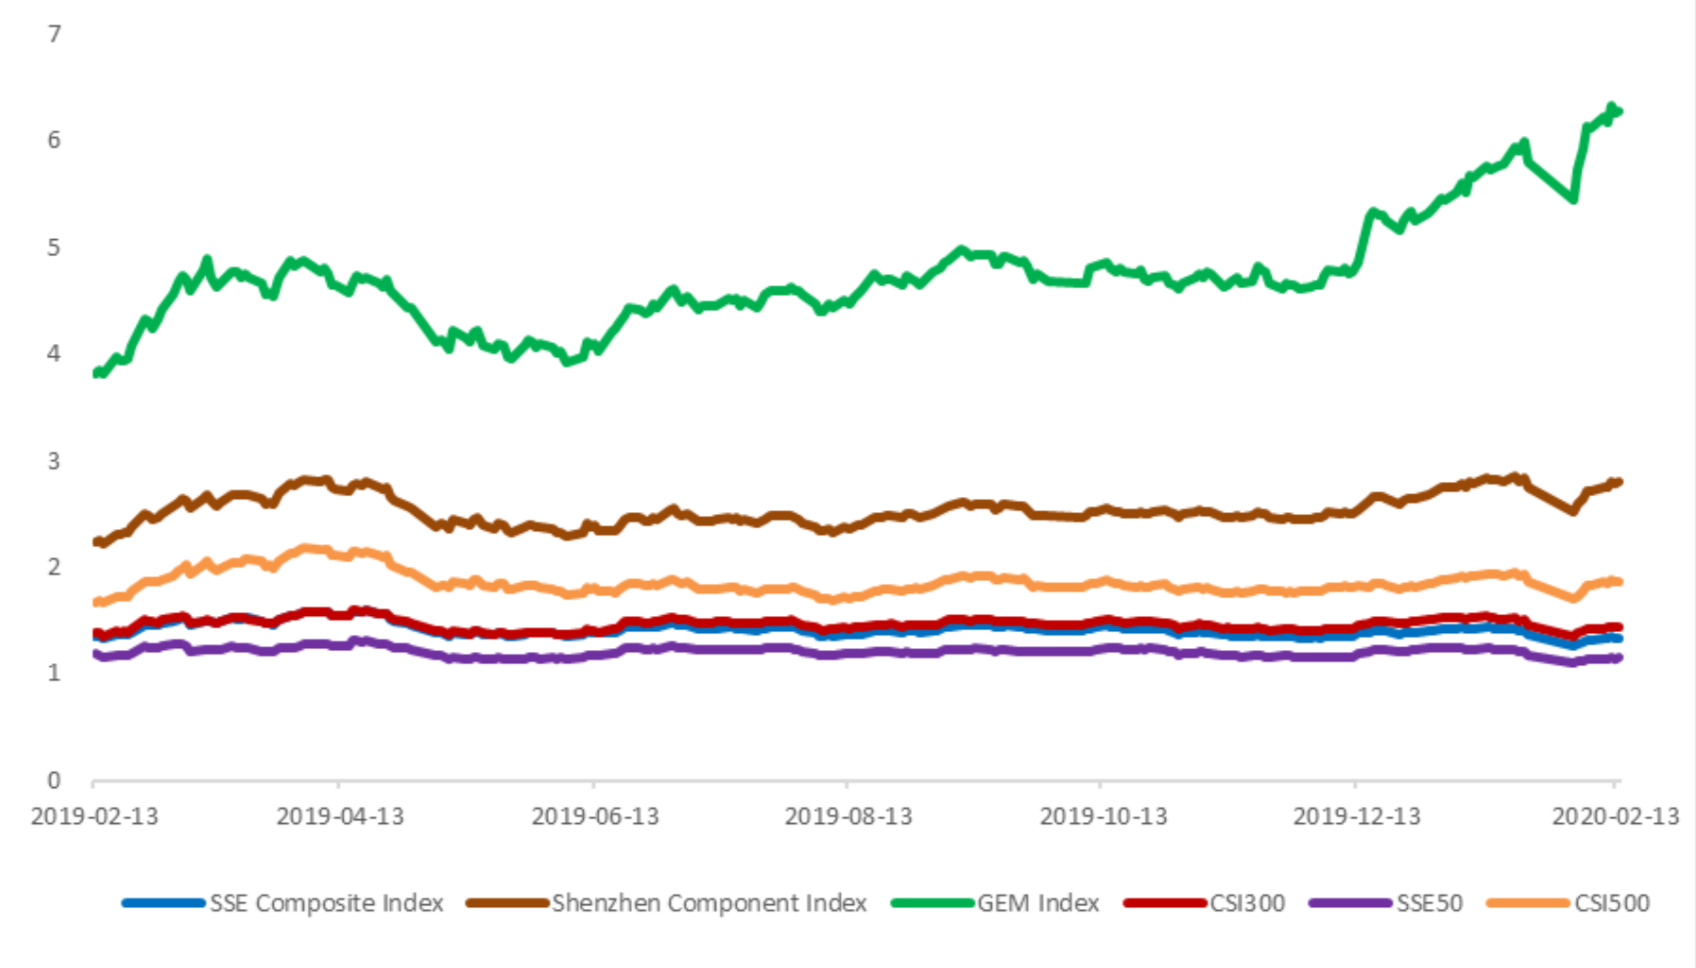
The current PE for SSE Composite Index, Shenzhen Component Index, GEM Index, CSI300, SSE50, CSI500 are 12.5567, 25.5085, 59.5839, 11.9763, 9.3158, 25.3271respectively; and these indices are at 12.50%, 39.60%, 82.20%, 28.60%, 12.40%, 26.10% percent rank level of their historic data, respectively
Graph 4: PE of 6 indices
Graph 5: PE percent rank of 6 indices (calculated by data of past 1200 trading days, only 1Y data is presented on the graph)
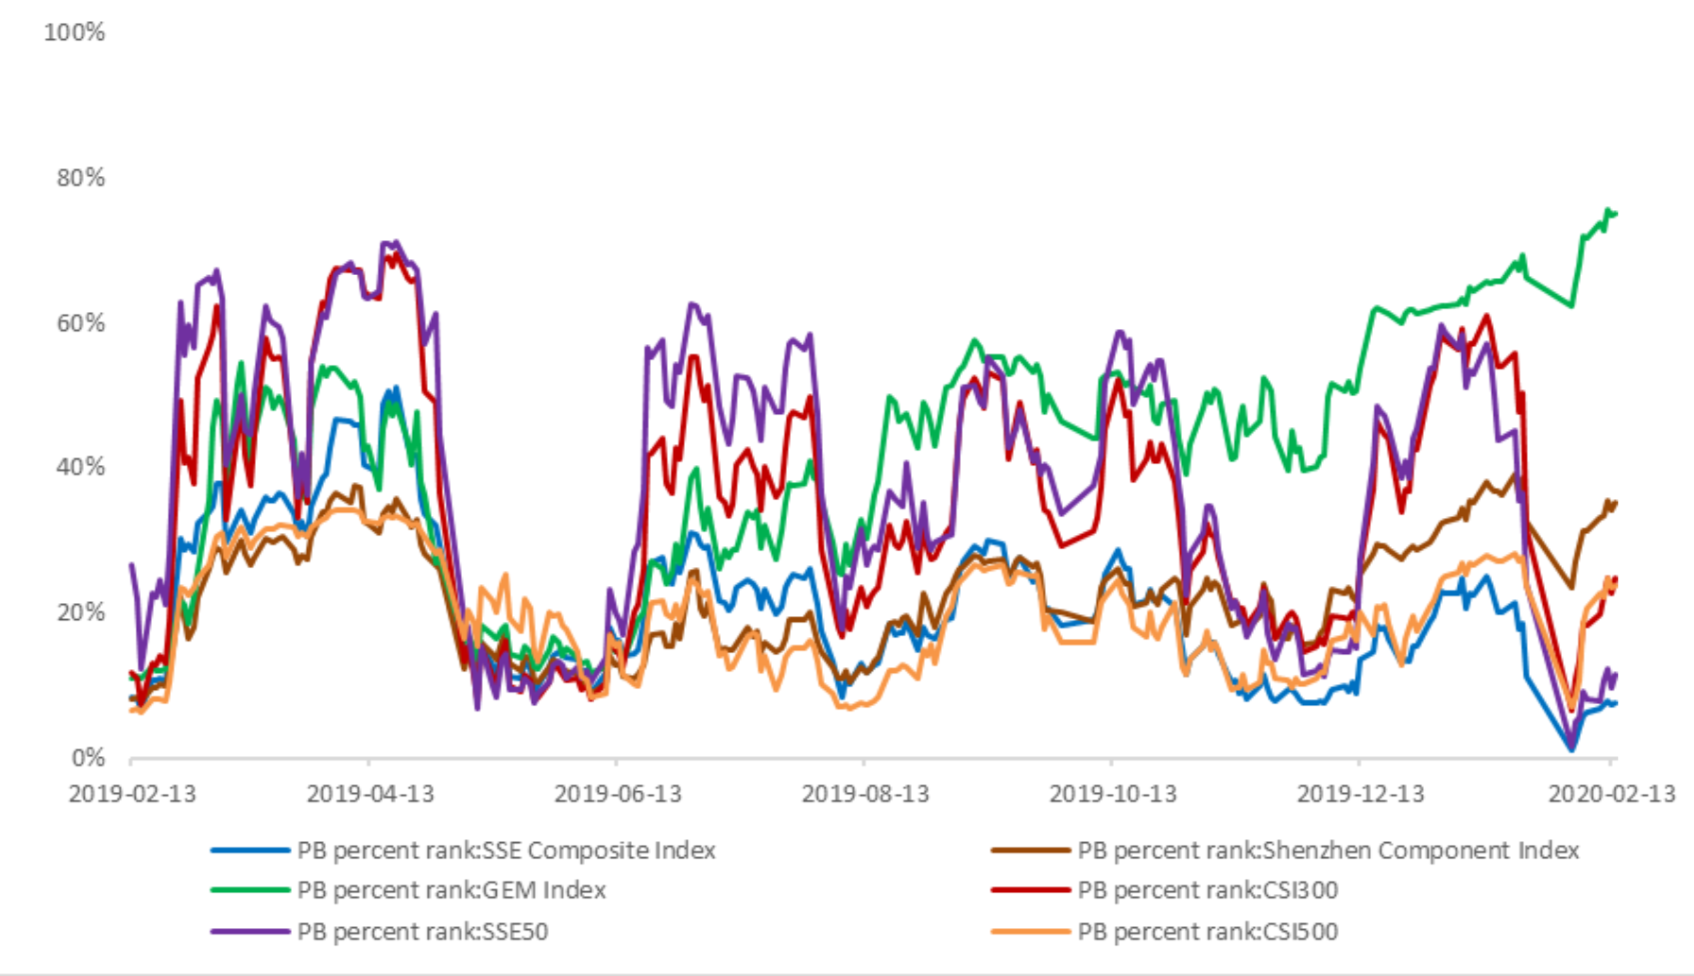
The current PB for SSE Composite Index, Shenzhen Component Index, GEM Index, CSI300, SSE50, CSI500 are 1.3375,2.7920,6.2723,1.4405,1.1452, 1.8664respectively, and these indices are at 7.50%, 35.10%, 75.10%, 24.70%, 11.40%, 23.70% percent rank level of their historic data, respectively.
Graph 6: PB of 6 indices
Graph 7: PB percent rank of 6 indices (calculated by data of past 1200 trading days, only 1Y data is presented on the graph)
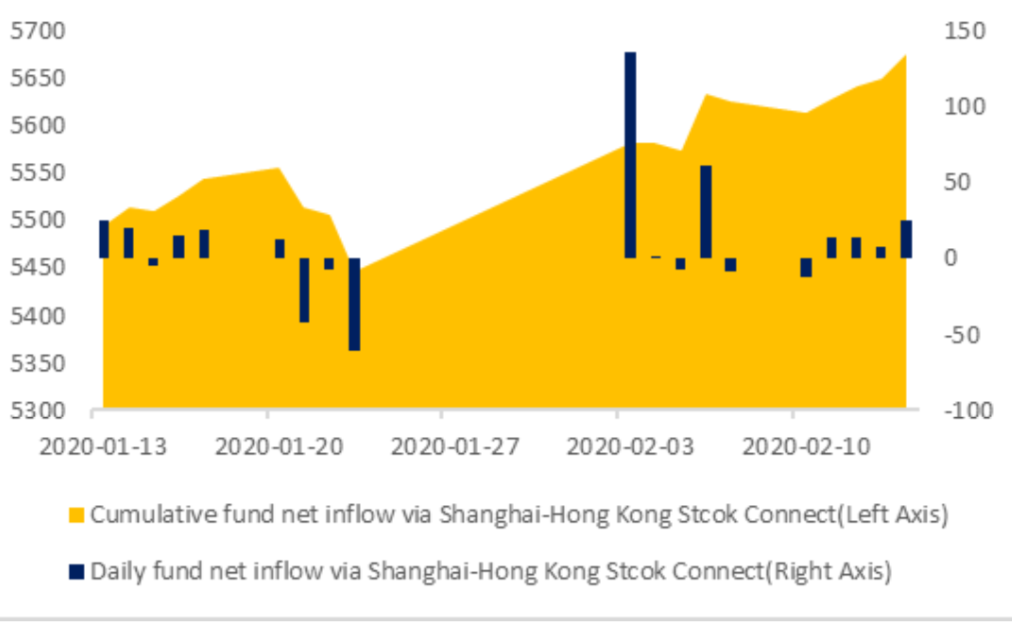
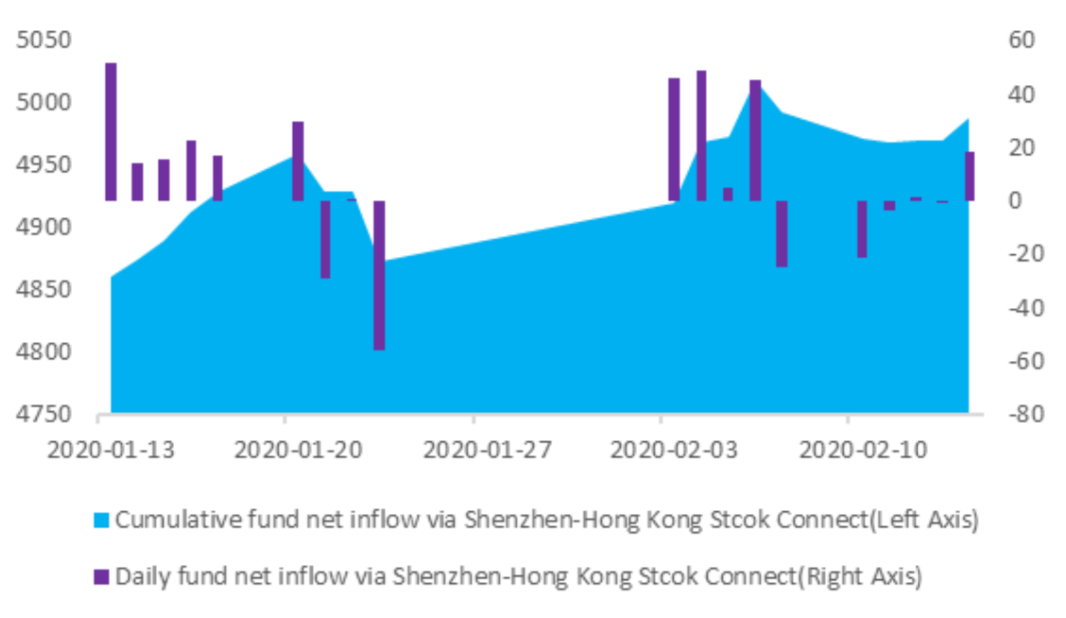
(4) Foreign Fund Flow
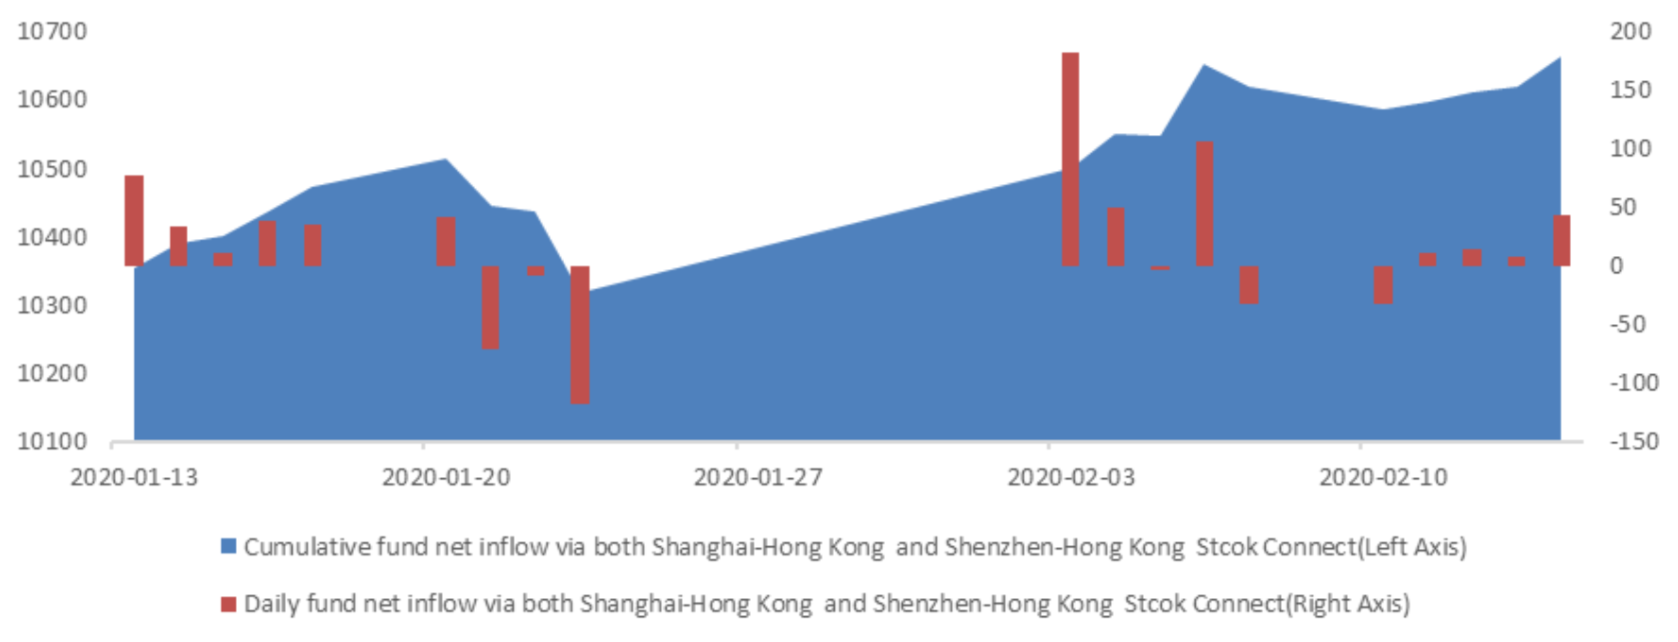
During last 5 trading days the total foreign fund flow via Stock Connect is 4.37 billion RMB, and the cumulative inflows was 1066.30 billion RMB. Specifically, the fund flow via Shanghai-Hong Kong Stock Connect is 4.92 billion RMB and the fund flow via Shenzhen-Hong Kong Stock Connect is -0.55 billion RMB.
Graph 8: Fund flow via both Shanghai and Shenzhen-Hong Kong Stock Connect in past 1M (100 million CNY)
Graph 9: Fund flow via Shenzhen-Hong Kong Stock Connect in past 1M (100 million CNY)
Graph 10: Fund flow via both Shanghai-Hong Kong Stock Connect in past 1M (100 million CNY)
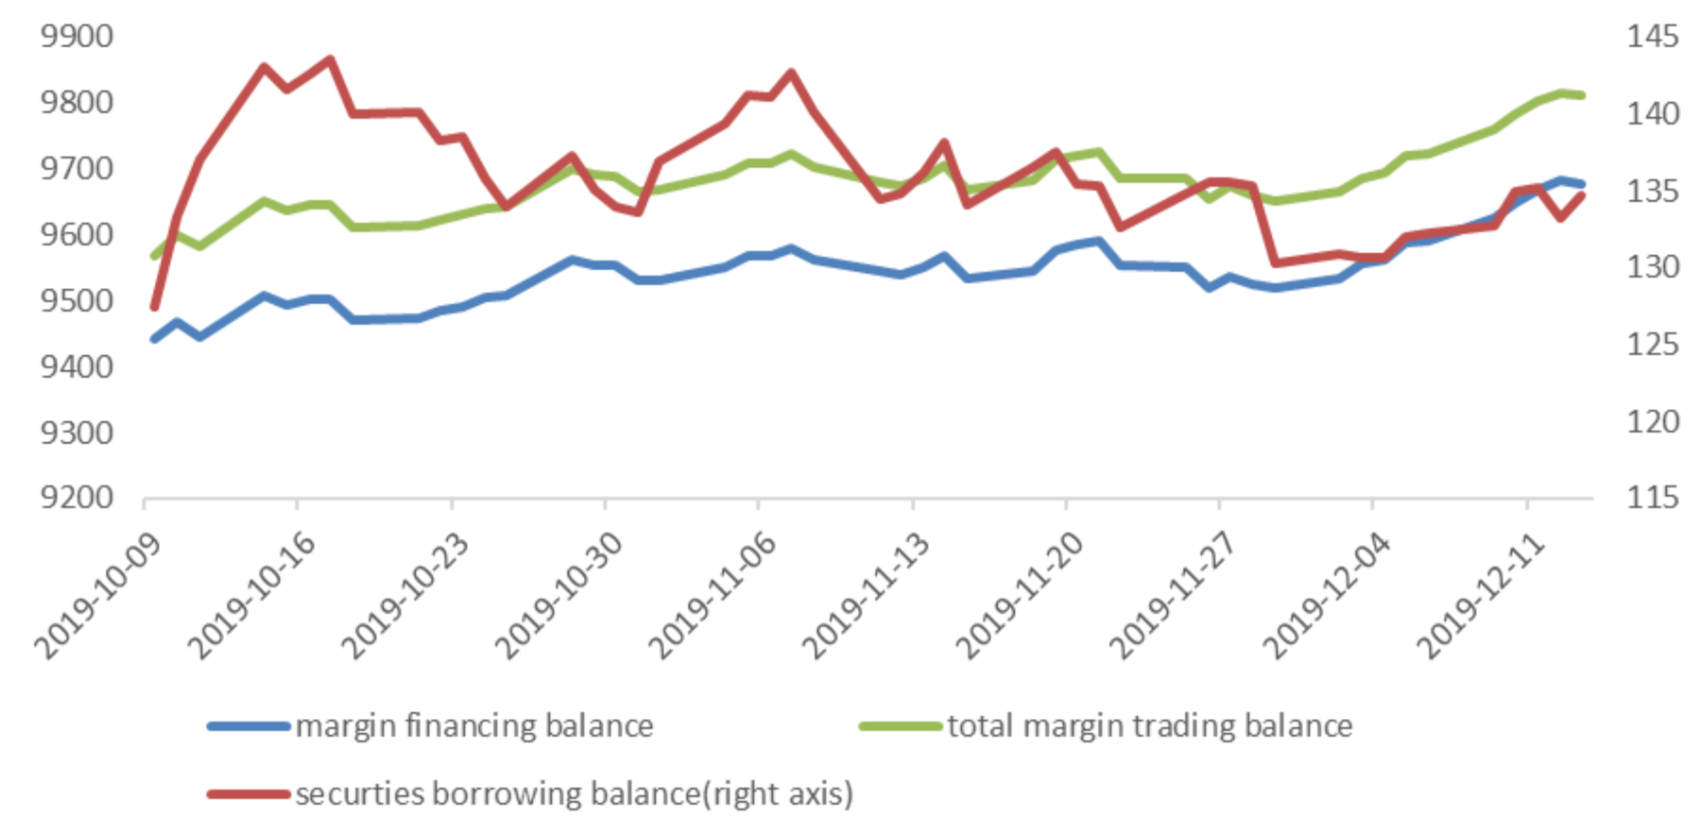
(5) Margin Trading
According to the newest data, the margin financing balance is 967.84 billion, securities borrowing is
13.47 billion, totally 981.31 billion.
Graph 11: Margin Trading(100m RMB)
2. Index Futures
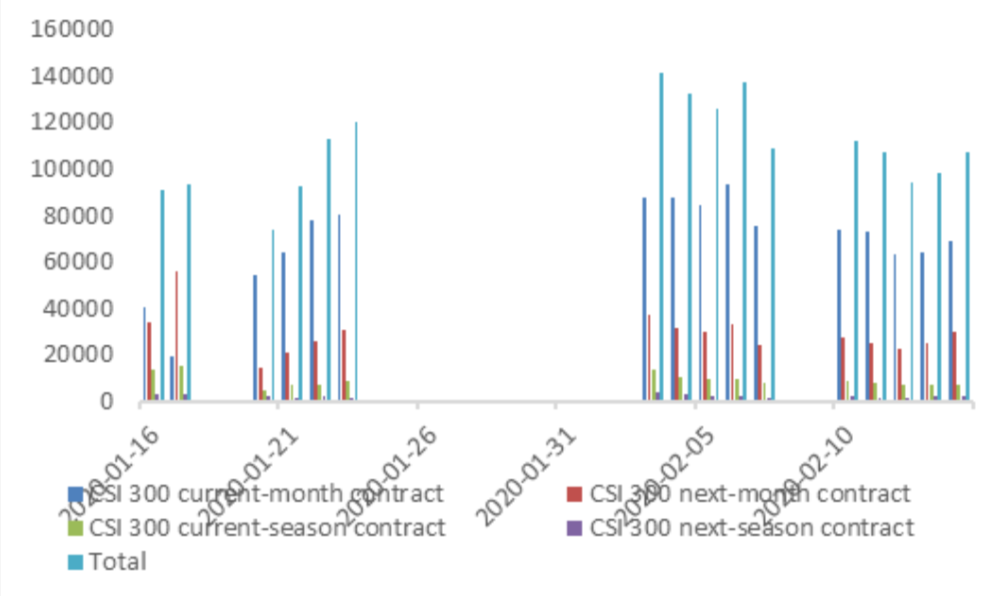
(1) Trading Volume and Open Interests
During past 5 trading days the average trading volume for CSI300(IF), SSE50(IH), CSI500(IC) contracts
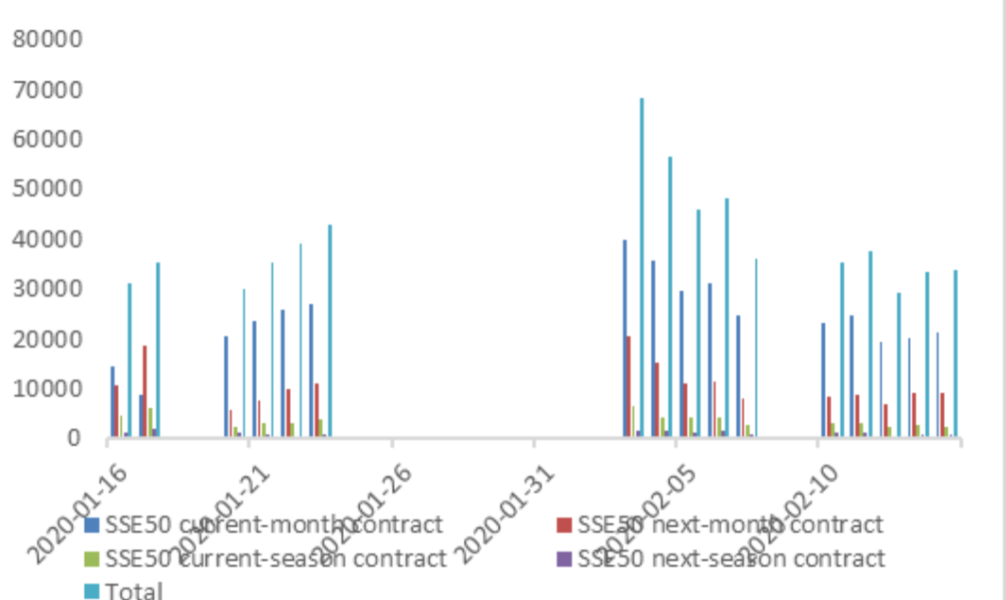
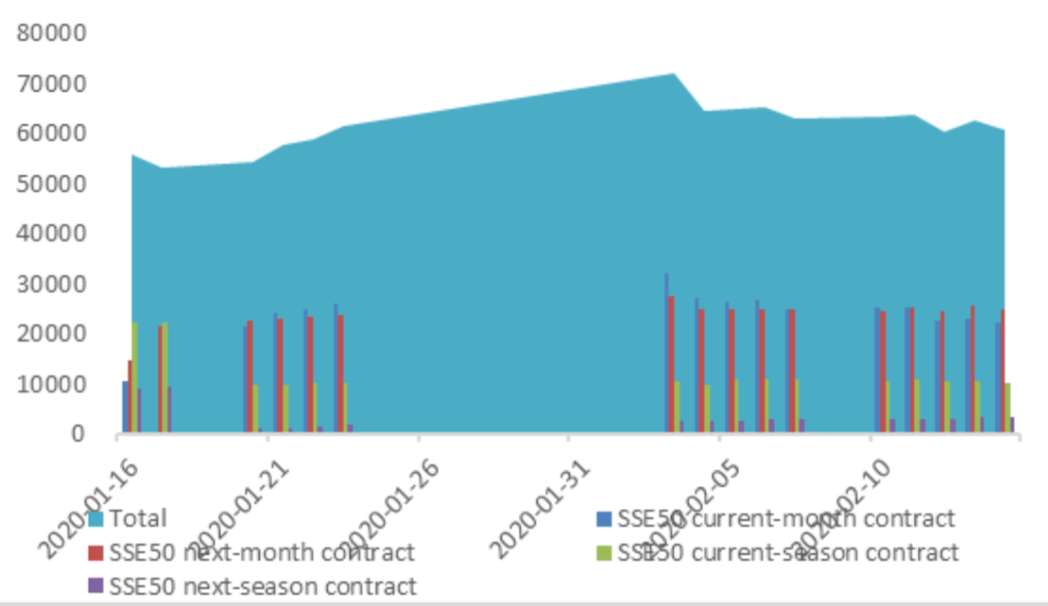
are 103586 (-19.72%, the previous 5-trading day period),33868 (-33.55%),121628 (-7.35%) lots, respectively. On the last trading day, the total open interests for them are 143846 (3.23%),60610 (-3.78%),184227 (3.31%) lots respectively.
Graph 12: CSI300 Index futures’ trading volume
Graph 13: CSI300 Index futures’ open interests
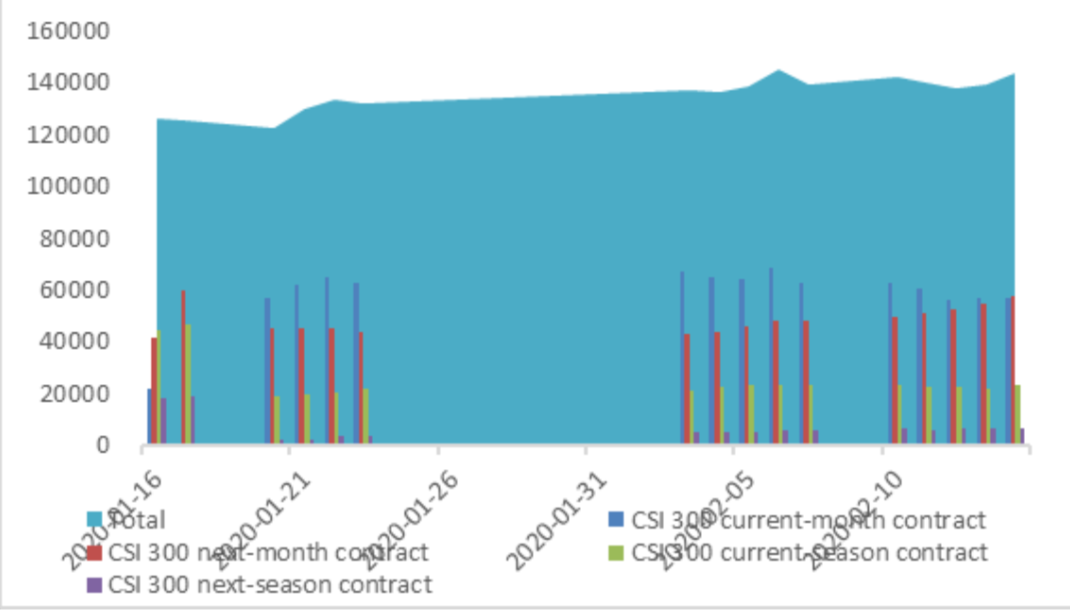
Graph 14:SSE50 Index futures’ trading volume
Graph 15: SSE50 Index futures’ open interests
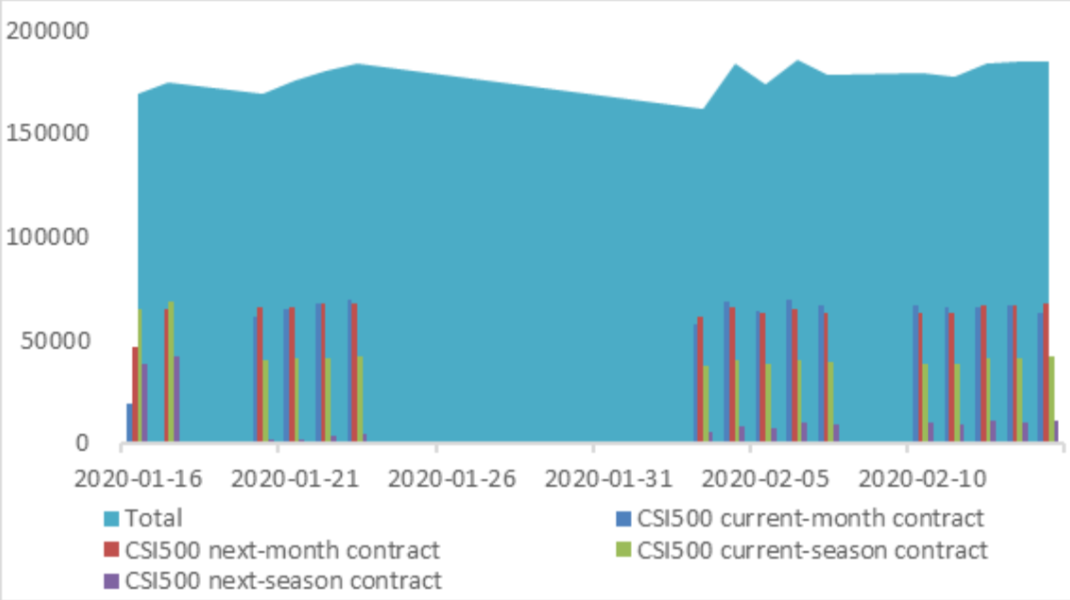
Graph 16: CSI500 Index futures’ trading volume
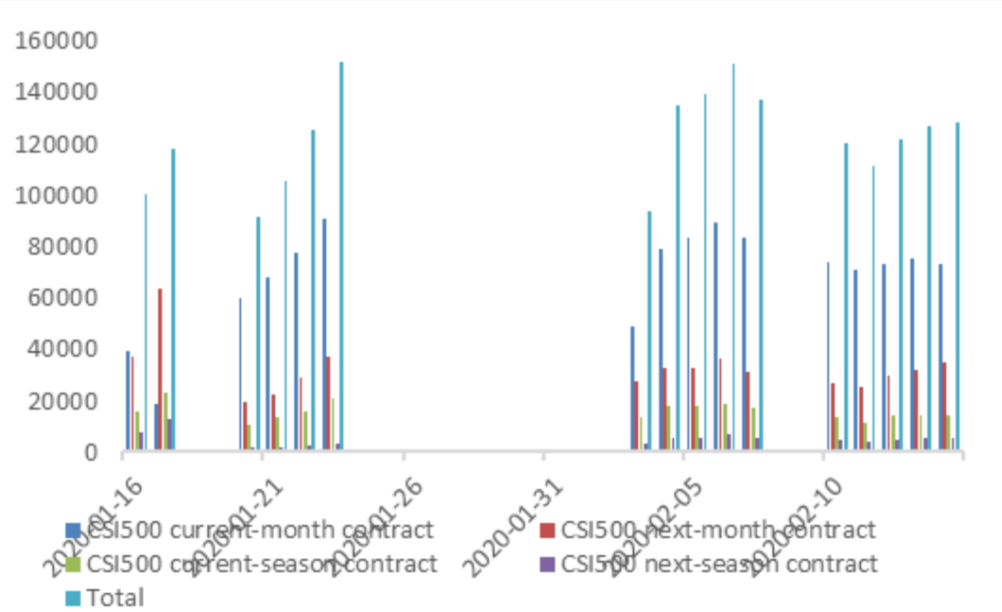
Graph 17: CSI500 Index futures’ open interests
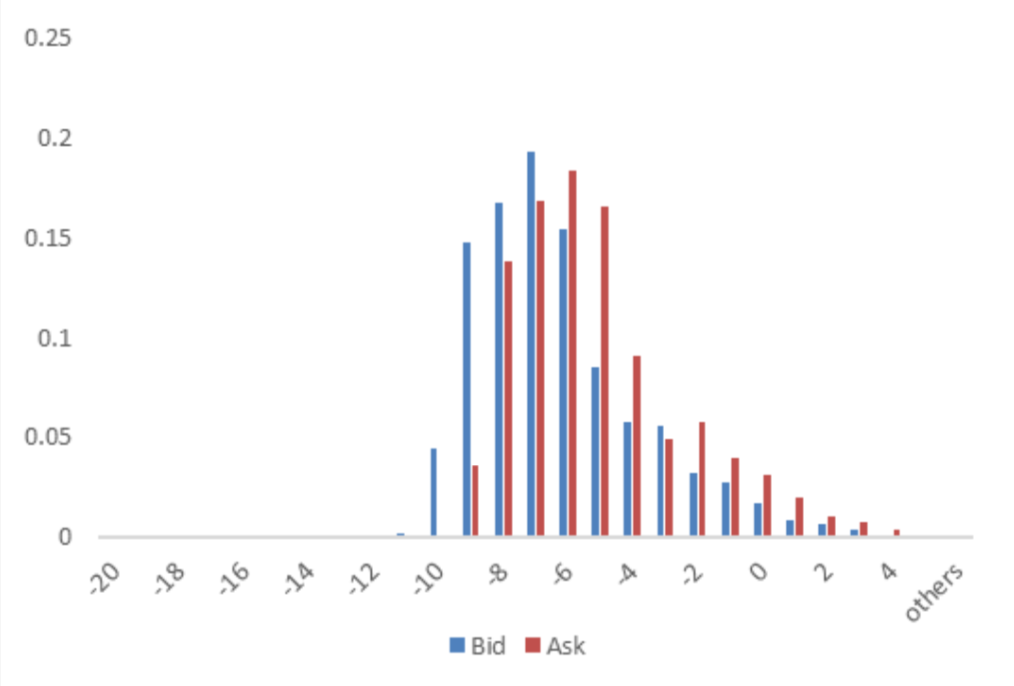
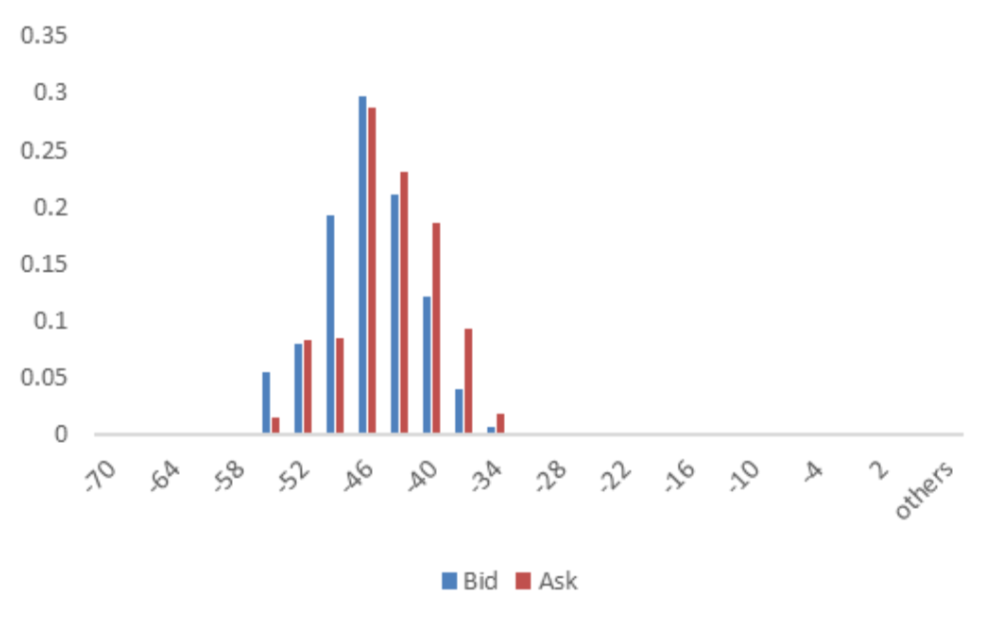
(2) Roll Level Bid-Ask Distribution
Worked form last 3 trading days.
Graph 18: CSI300 Current/Next Month Contract Roll Spread Distribution (2s frequency)
Graph 19: SSE50 Current/Next Month Contract Roll Spread Distribution (2s frequency)
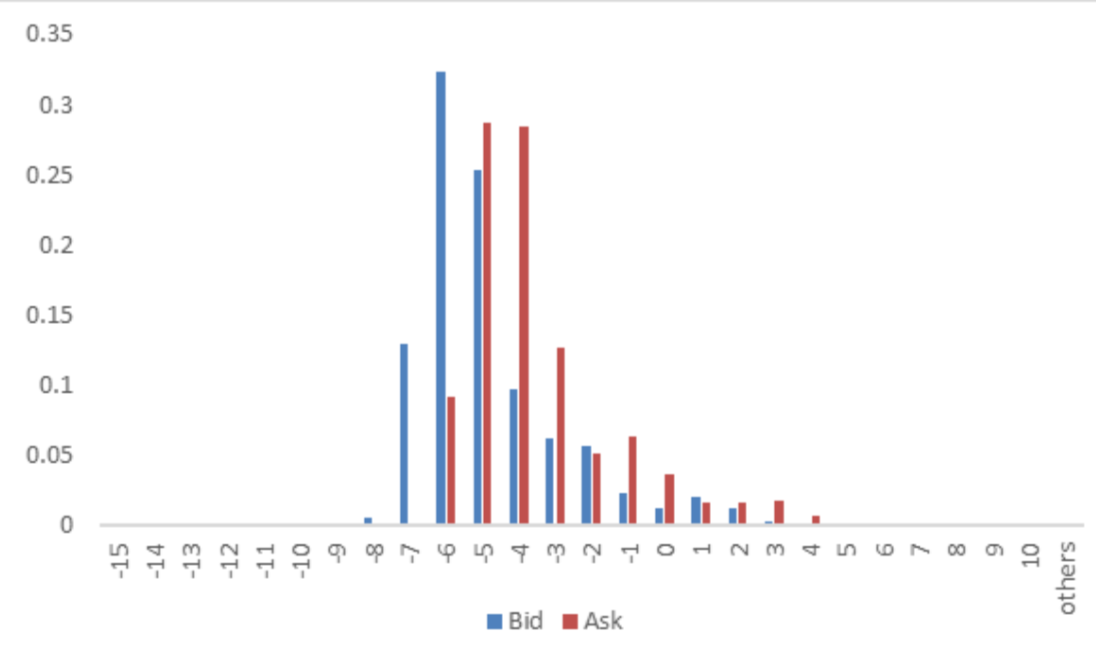 Graph 20: CSI500 Current/Next Month Contract Roll Spread Distribution (2s frequency)
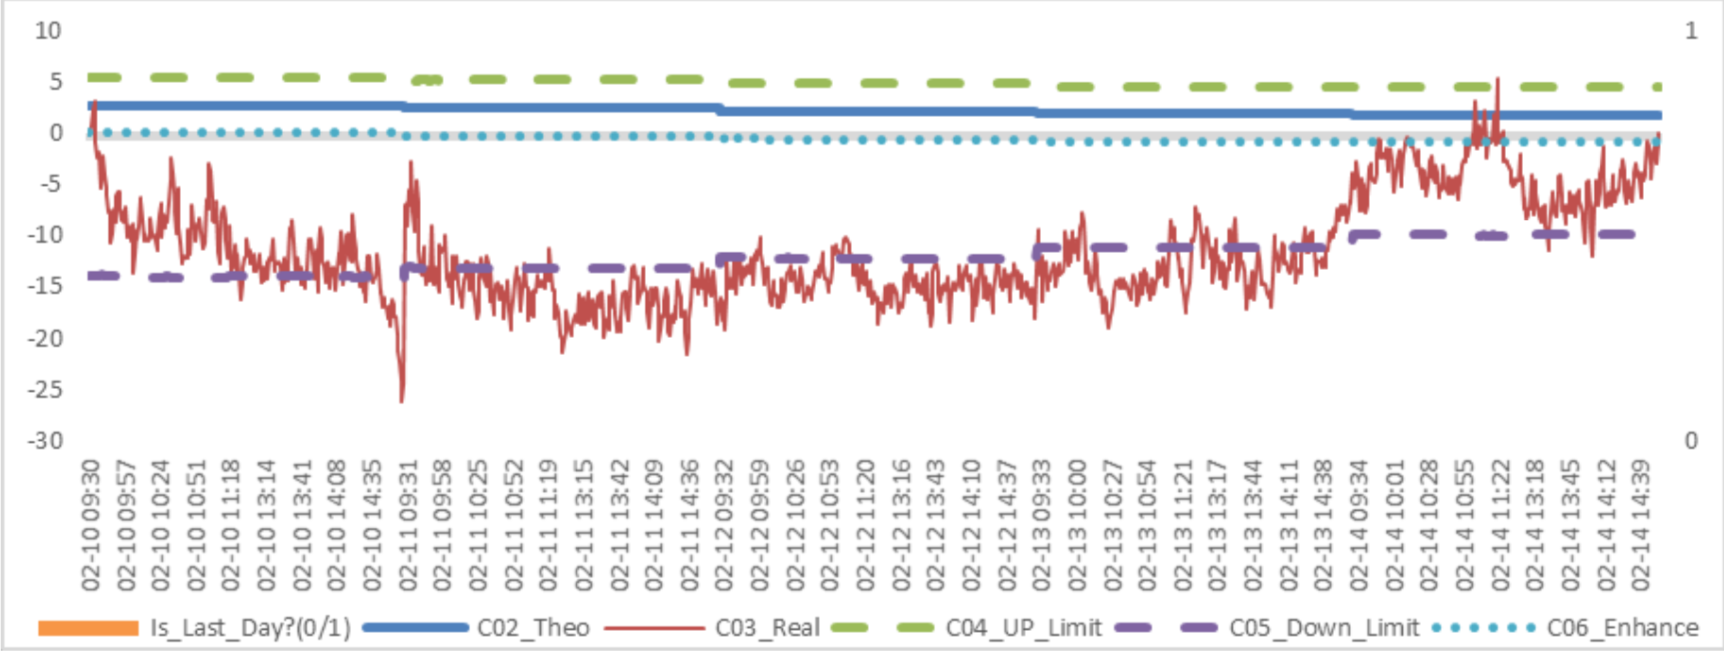
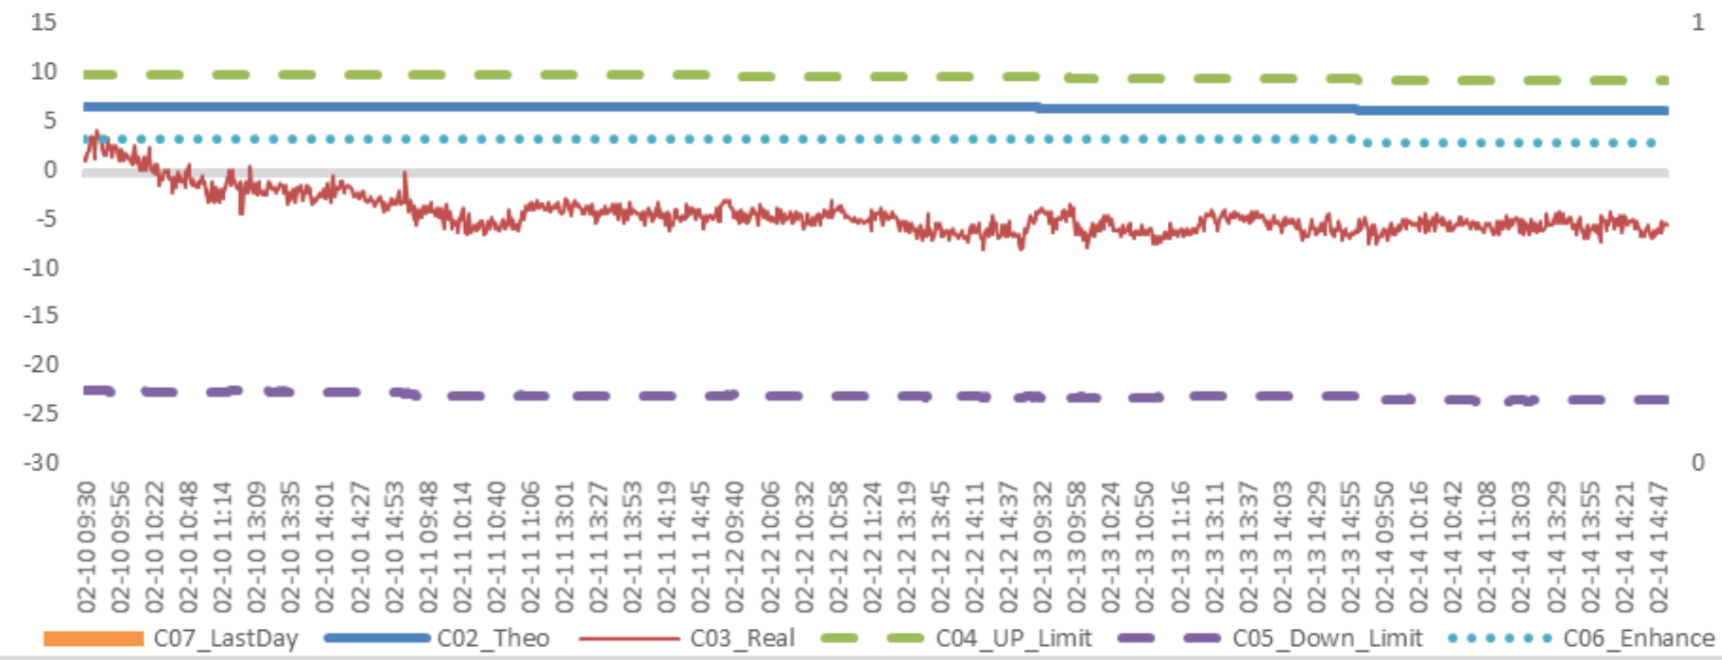
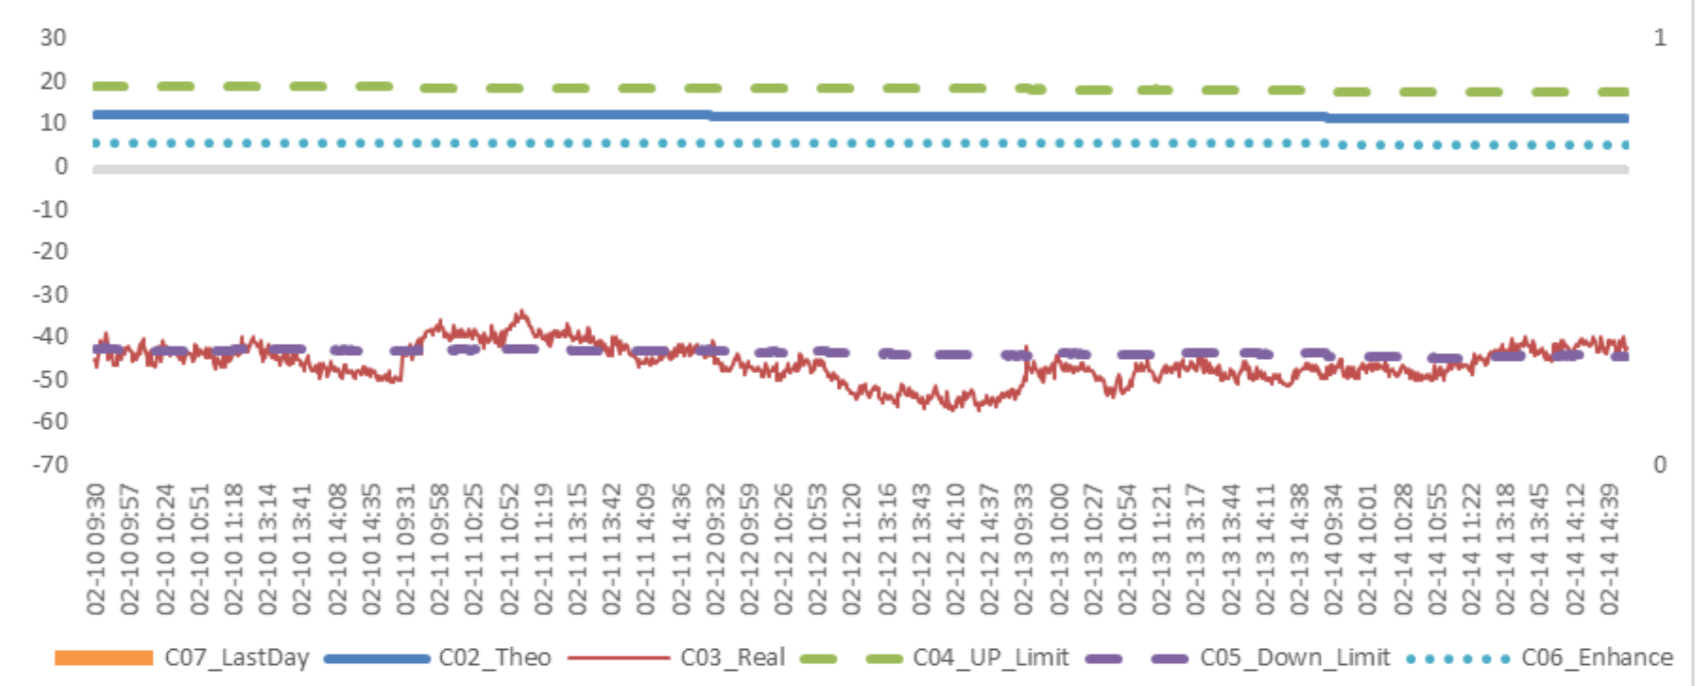
(3) Weekly Review of Future/Spot Arbitrage Opportunity
Assumption: risk-free rate: 3%; security borrowing cost: 8%; trading expense for spot: 0.025%; trading expense for futures: 0.005%; margin rates for futures contracts: 0.11 for CSI300 and SSE50, 0.13 for CSI500; margin rate for security borrowing: 0.3 (or 130% maintain rate).
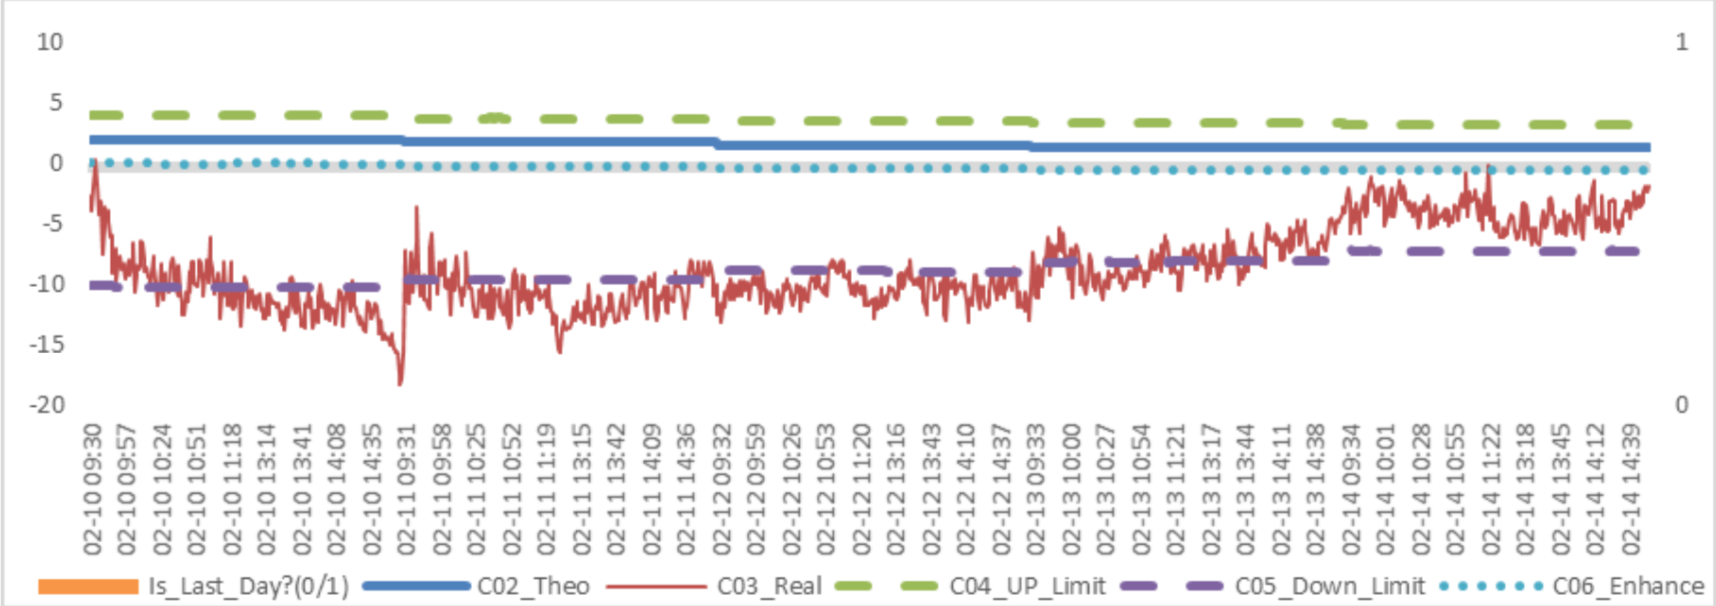
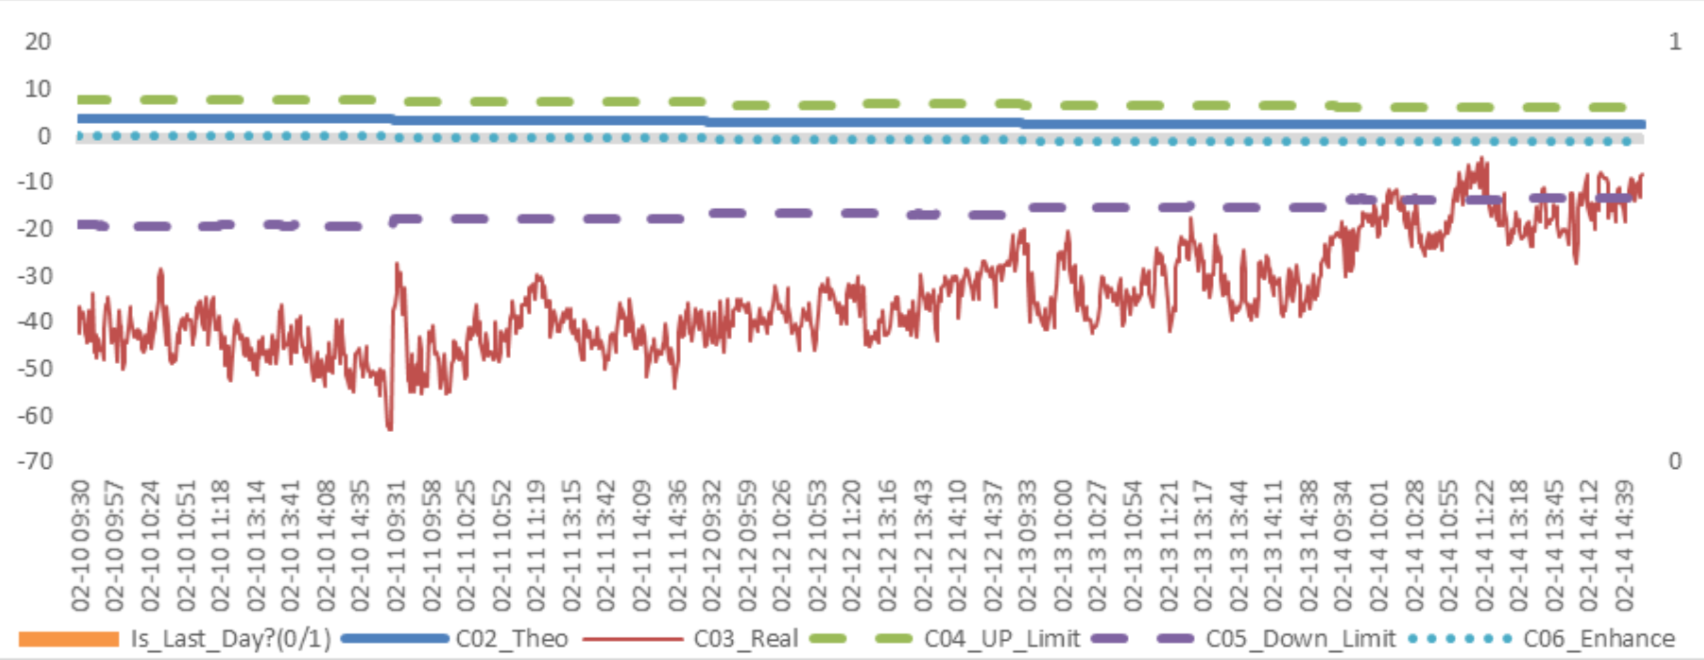
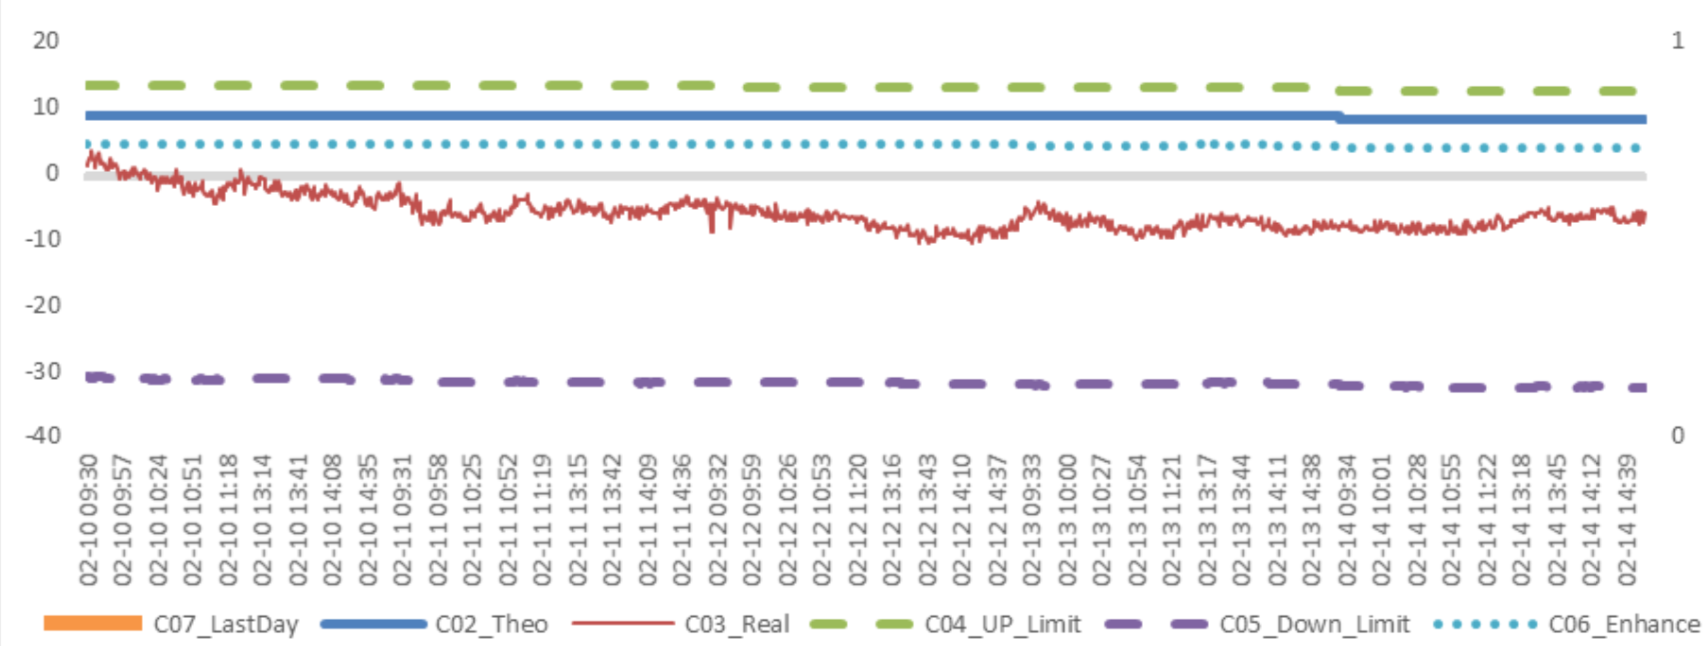
When real price spread is out of theoretical range (calculated by our assumption), there exists absolute future-spot arbitrage opportunity.
Graph 21: Future (Current Month)-Spot Arbitrage Opportunity for CSI300 contract (in the view of price difference)
Graph 22: Future (Current Month)-Spot Arbitrage Opportunity for SSE50 contract (in the view of price difference)
Graph 23: Future (Current Month)-Spot Arbitrage Opportunity for CSI500 contract (in the view of price difference)
Graph 24: Future (Next Month-Current Month) Arbitrage Opportunity for CSI300 contract (in the view of price difference)
Graph 25: Future (Next Month-Current Month) Arbitrage Opportunity for SSE50 contract (in the view of price difference)
Graph 26: Future (Next Month-Current Month) Arbitrage Opportunity for CSI500 contract (in the view of price difference)
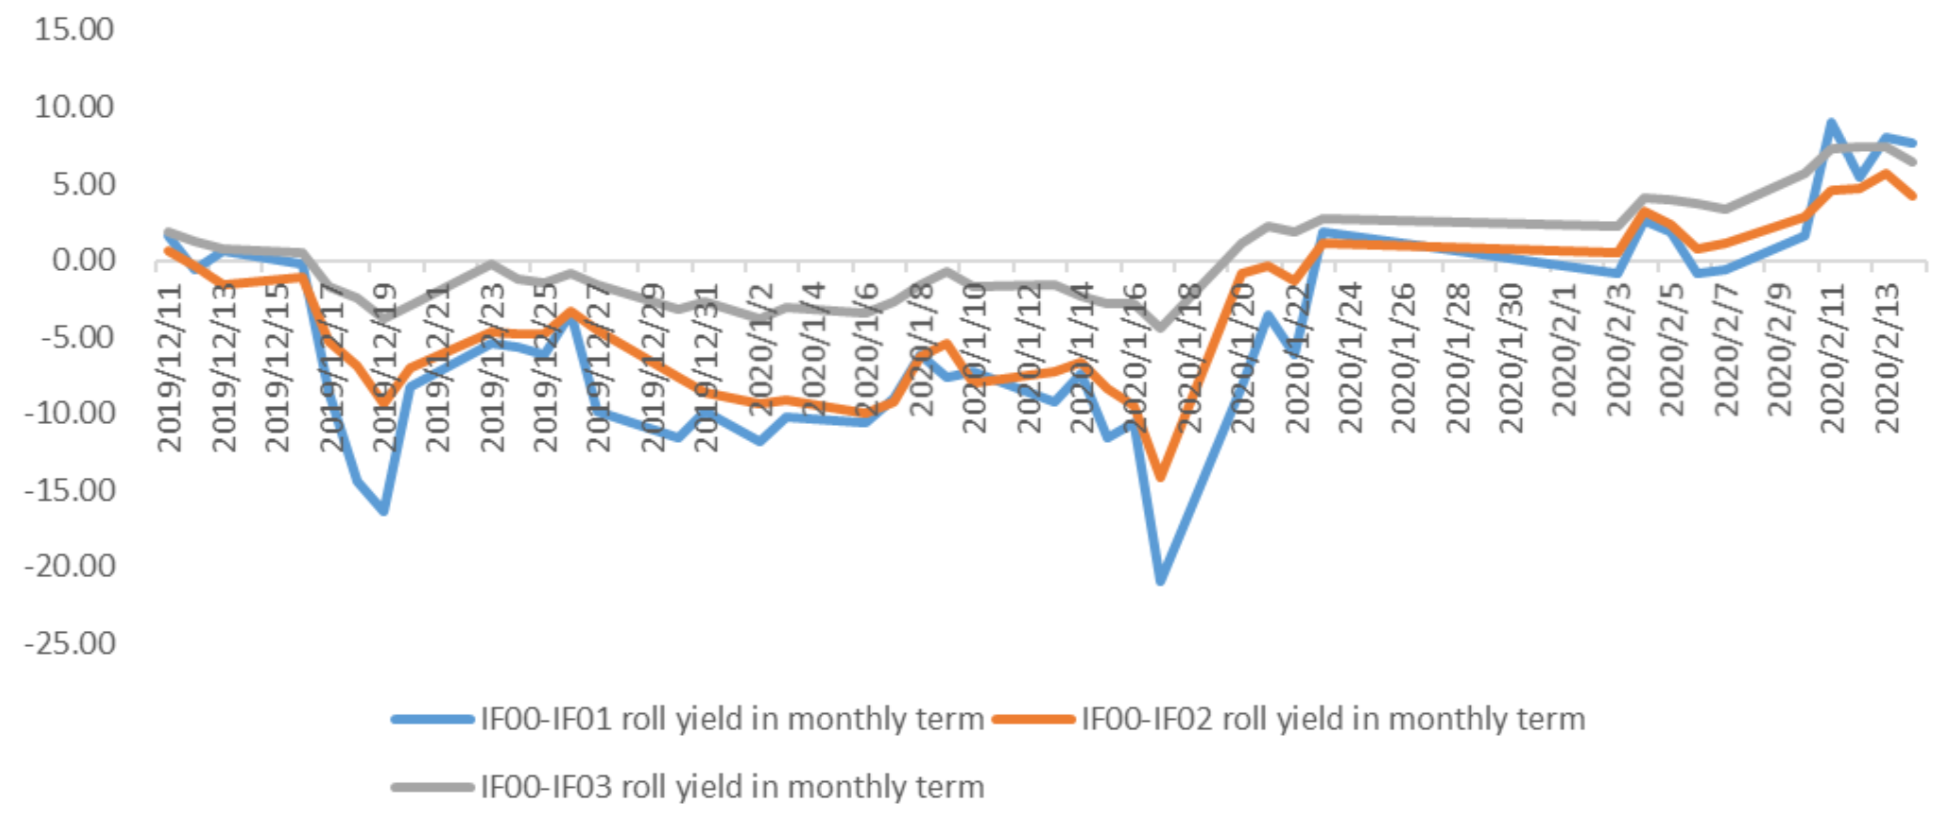
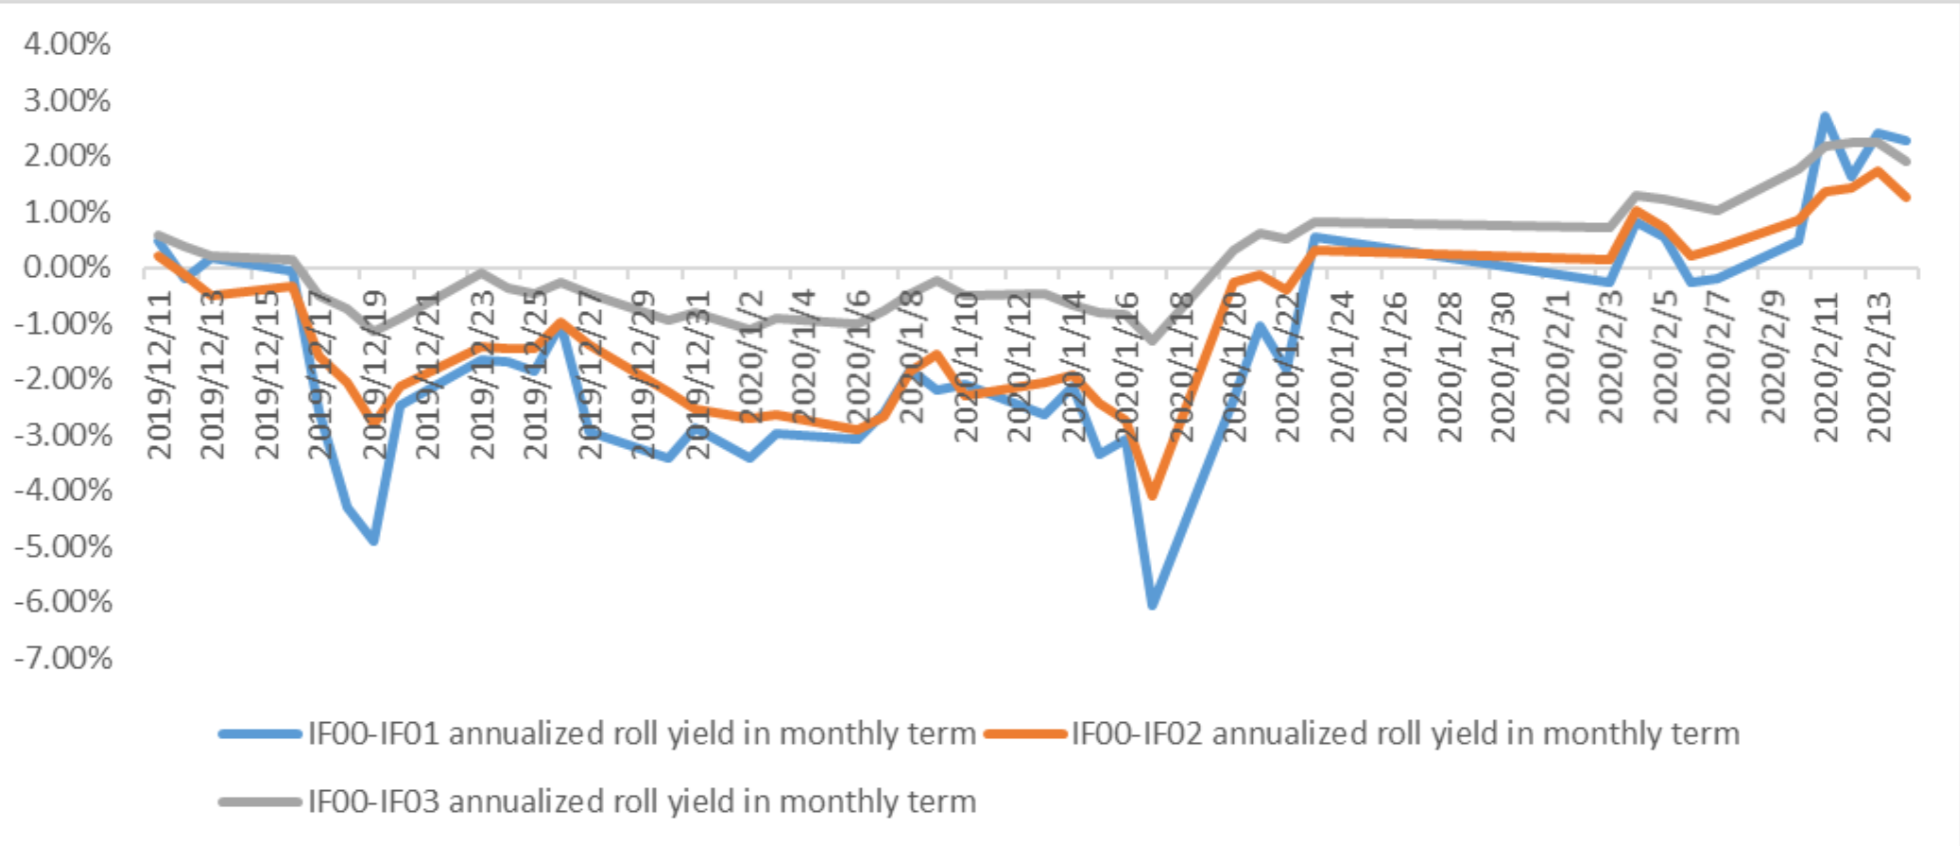
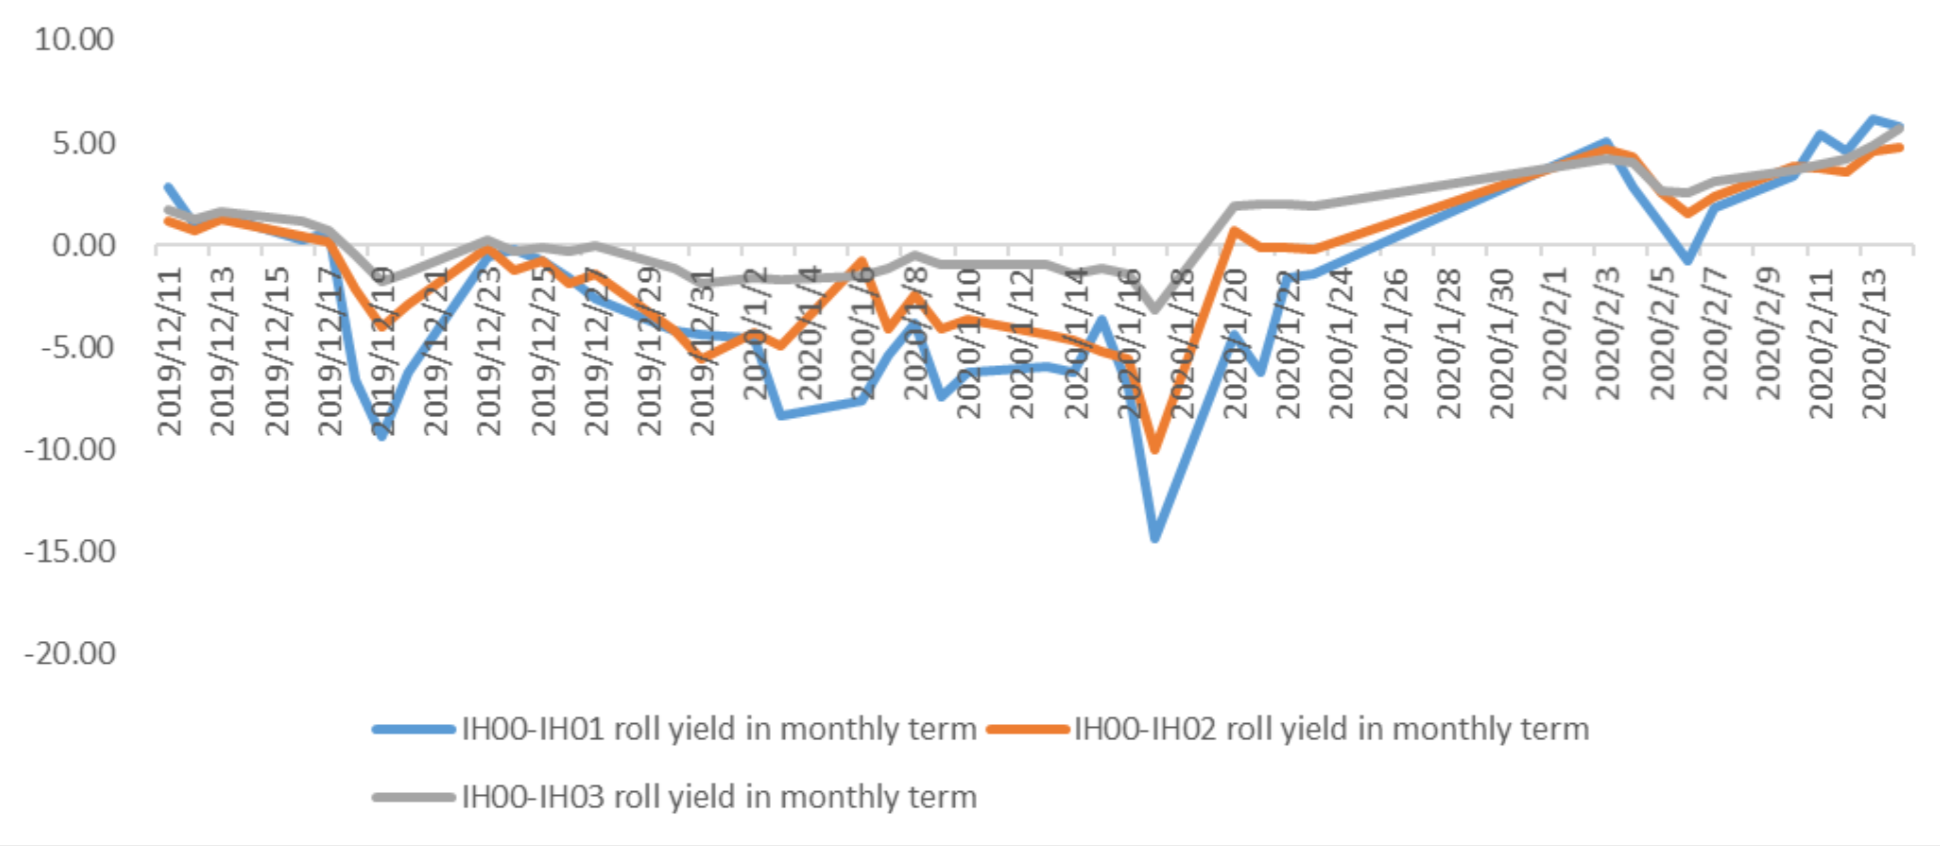
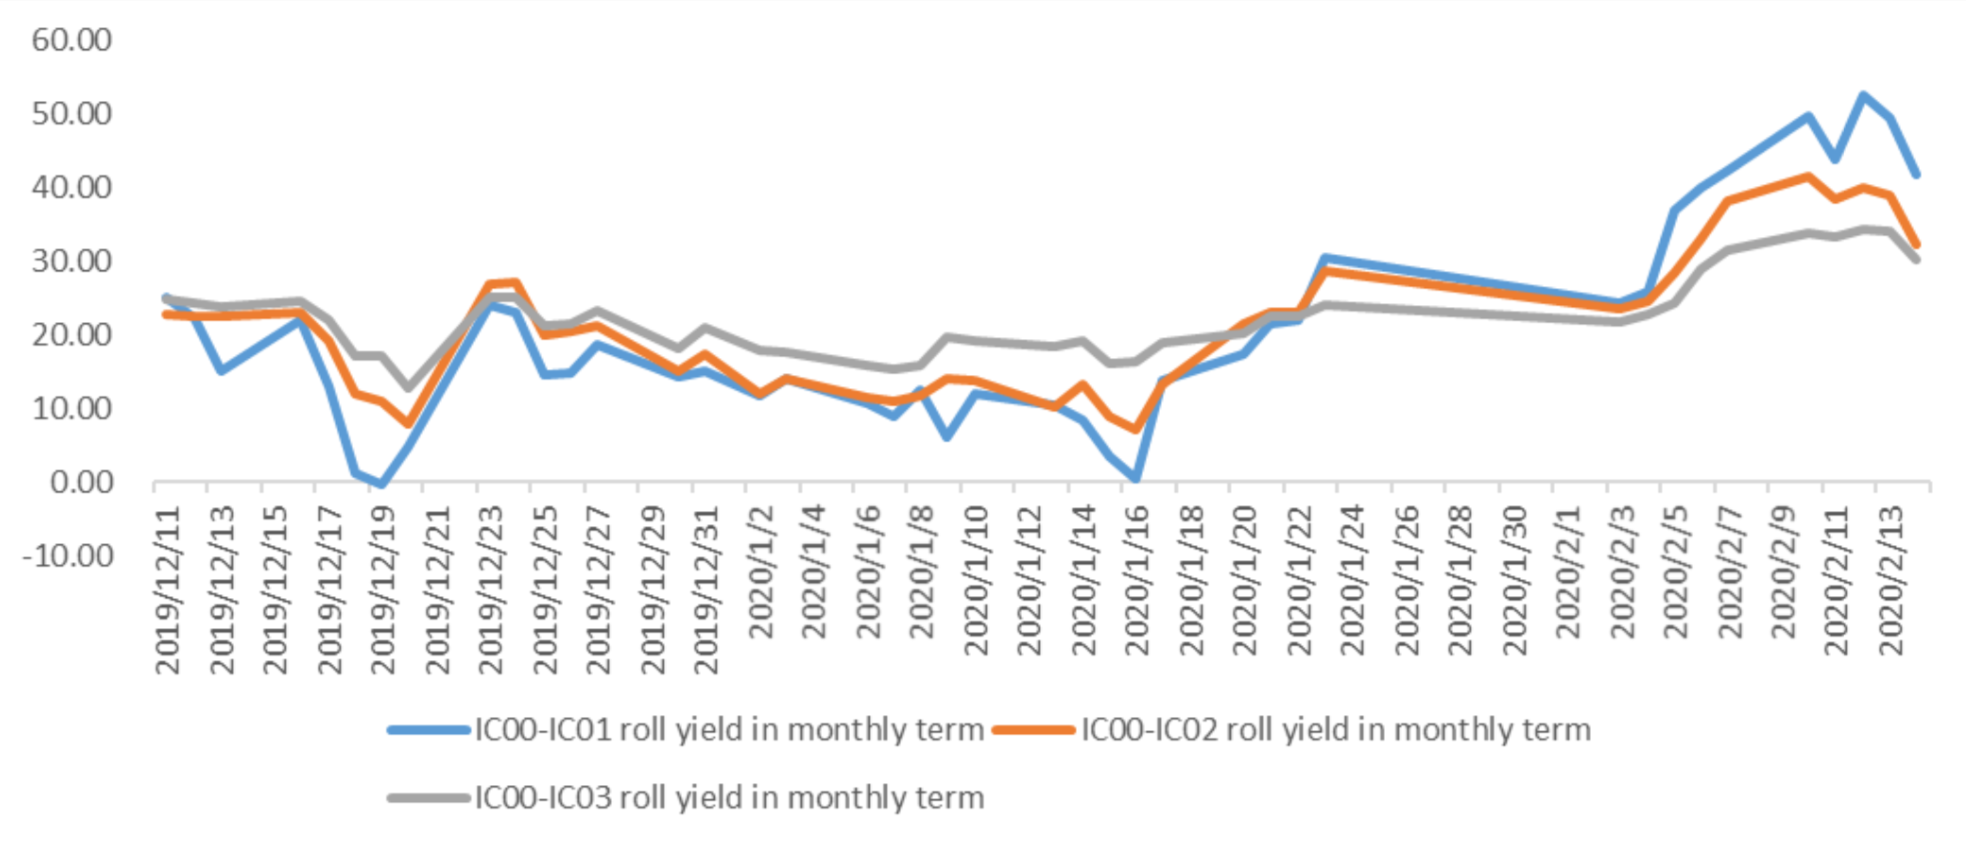
Calculated as the contract price of the current month minus the contract price of the following month, for the long roll, the positive calculation results are gains, the negative calculation results are losses. Code 00 in the figure represents the current month contract, 01 the next month contract, 02 the current quarter contract, 03 the next quarter contract.
(a)IF
Up to2020/2/14,the best roll plan is IF00-IF01,annualized roll yield in monthly term is2.29%。
Graph 27: IF Current month contract roll yield comparison (index point)
Graph 28: IF Current month contract roll yield comparison (annualized return)
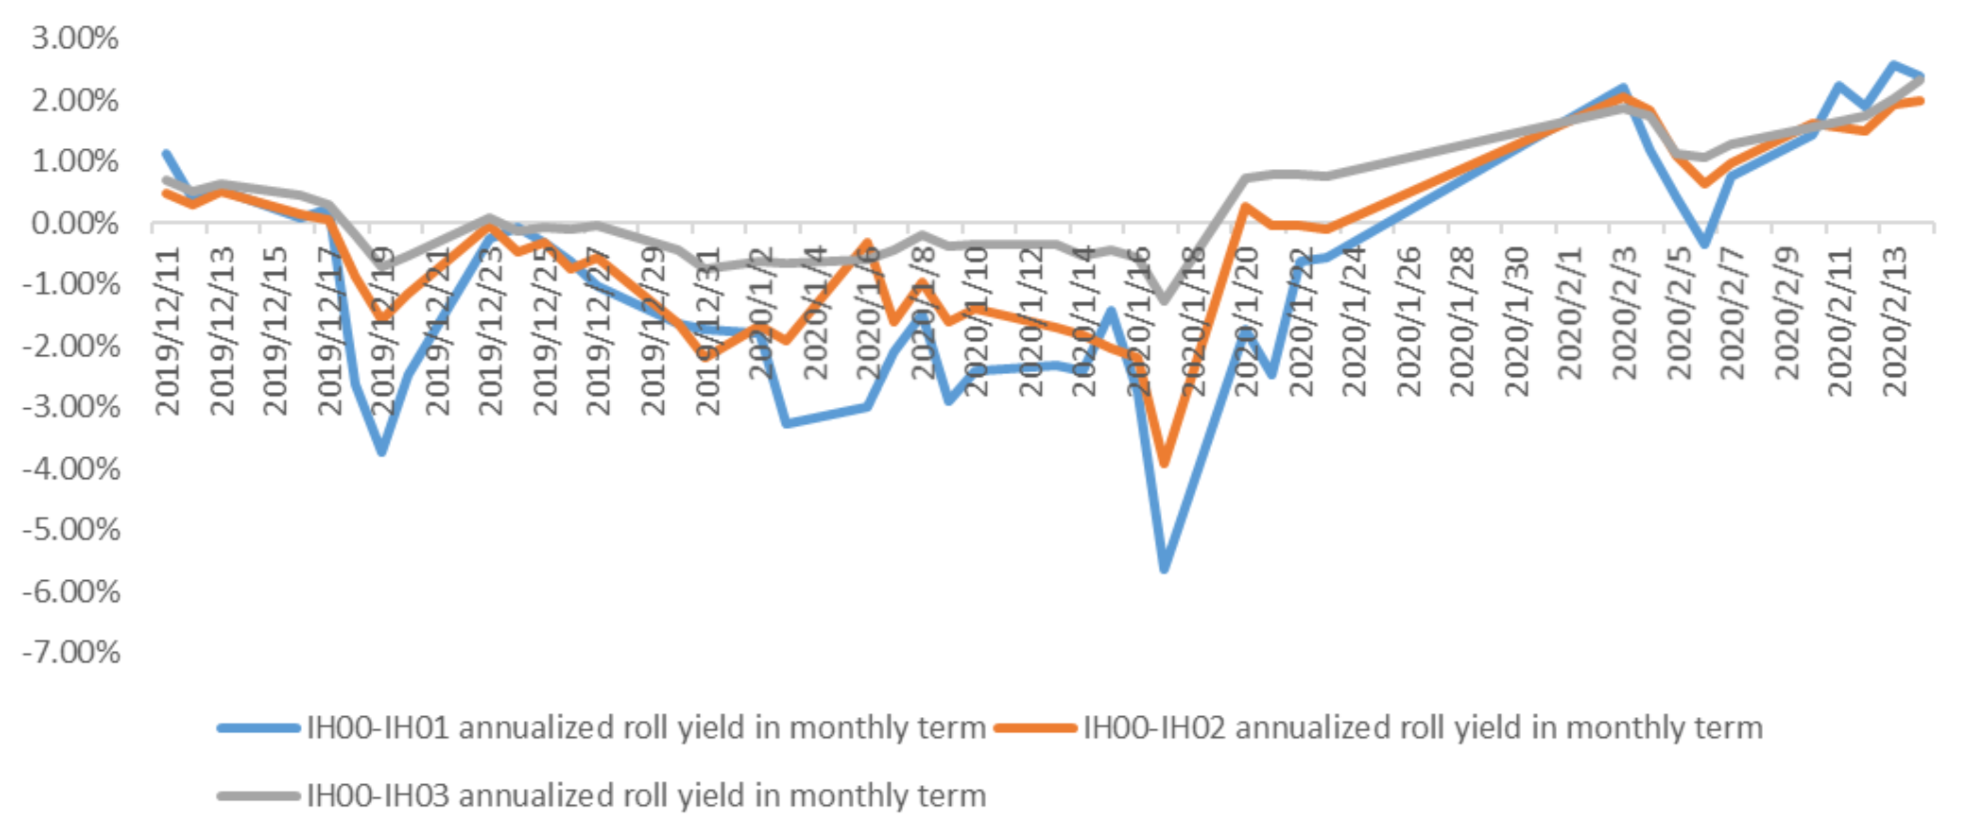
(b)IH
Up to 2020/2/14,the best roll plan is IH00-IH01,annualized roll yield in monthly term is2.40%。
Graph 29: IH Current month contract roll yield comparison (index point)
Graph 30: IH Current month contract roll yield comparison (annualized return)
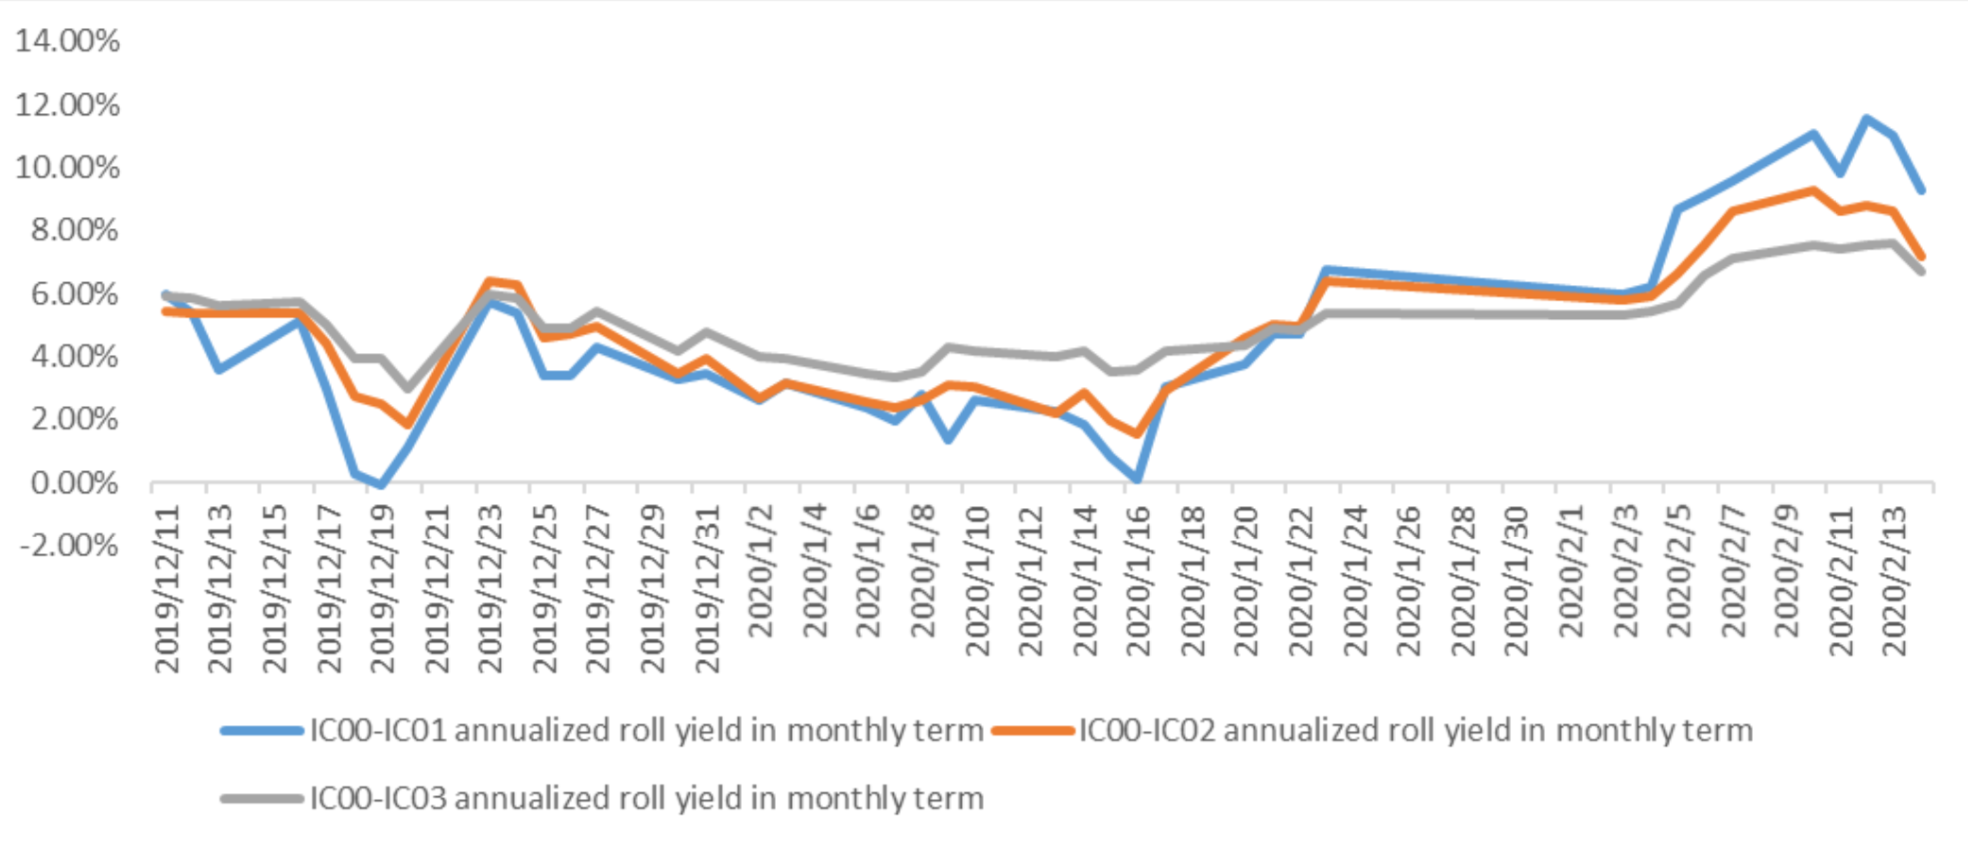
(c)IC
Up to2020/2/14,the best roll plan isIC00-IC01,annualized roll yield in monthly term is9.25%。
Graph 31: IC Current month contract roll yield comparison (index point)
Graph 32: IC Current month contract roll yield comparison (annualized return)
(5) Basis Tracking of Stock Index Futures
For long side, if the base difference is positive, the change of the base difference brings losses, and if the base difference is negative, the change of the base difference brings profits.
(a)IF
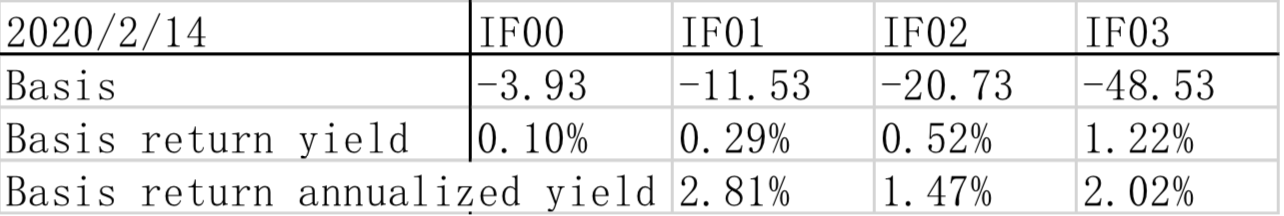
For long side hedge, up to 2020/2/14, all IF contracts were in discount. Here IF next month contract basis return annualized yield is 2.81%。
Graph 33: IF contracts basis
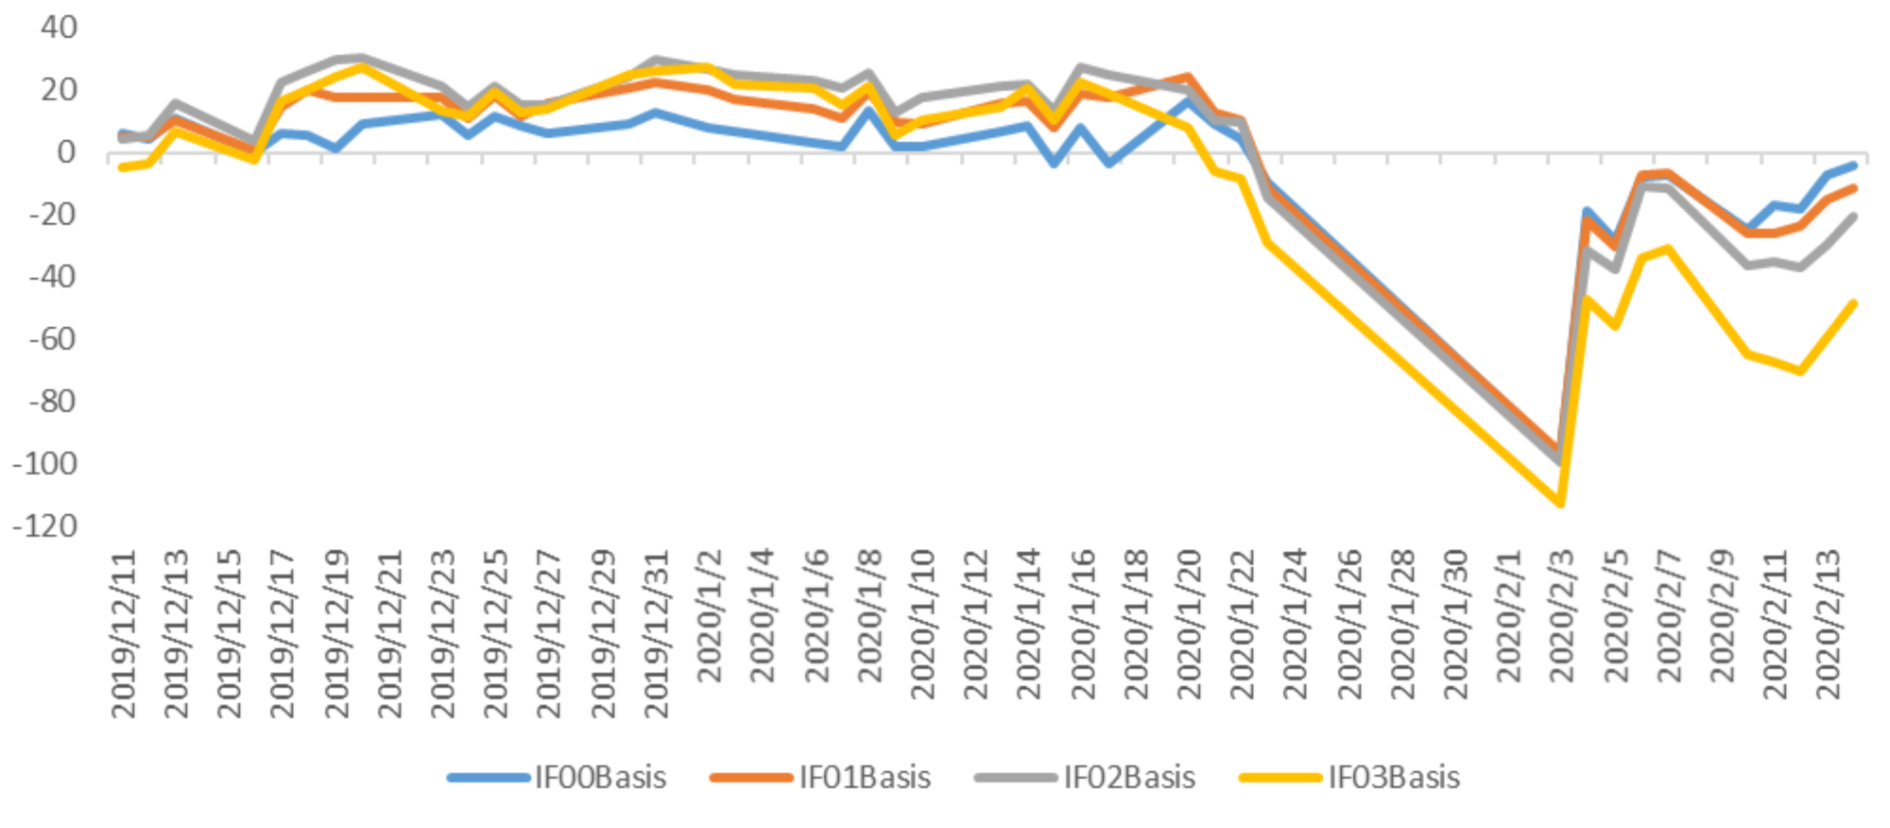
Table 1: IF basis return calculation
(b)IH
For long side hedge, up to 2020/2/14,all IH contracts were in discount. Here IH next month contract
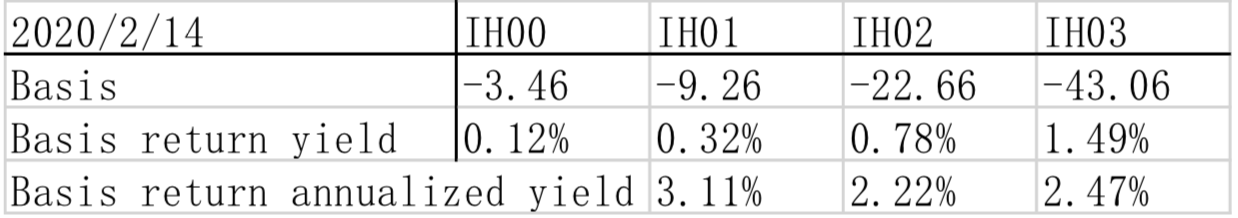
basis return annualized yield is 3.11%。
Graph 34: IH contracts basis
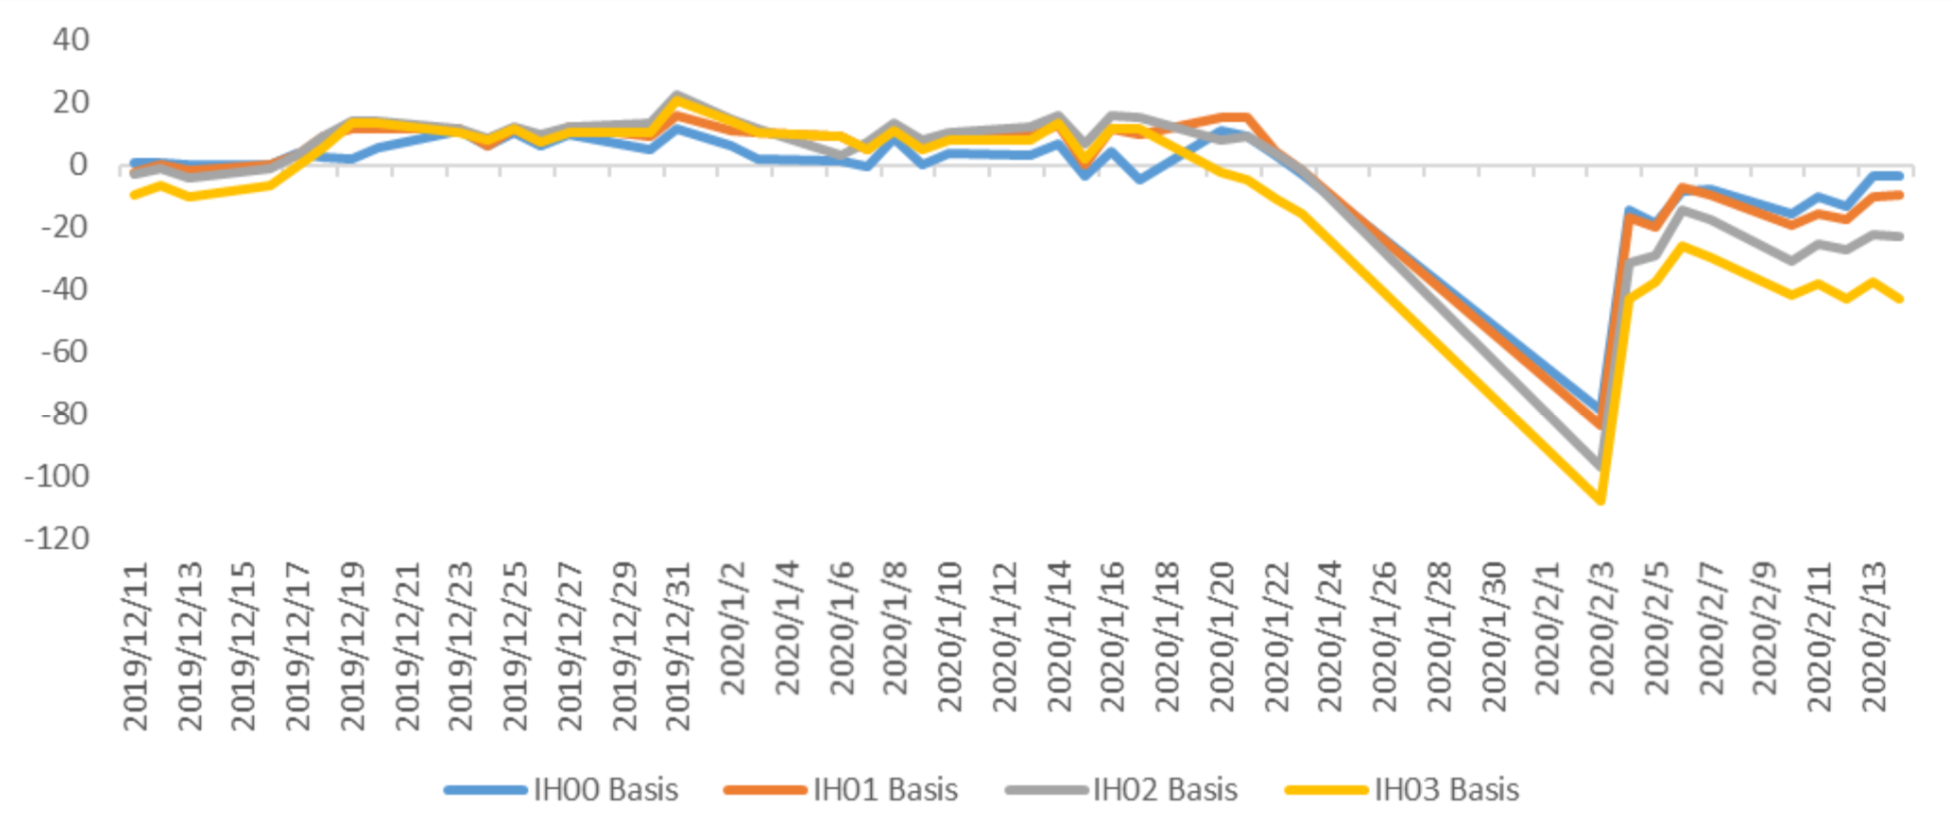
Table 2: IH basis return calculation
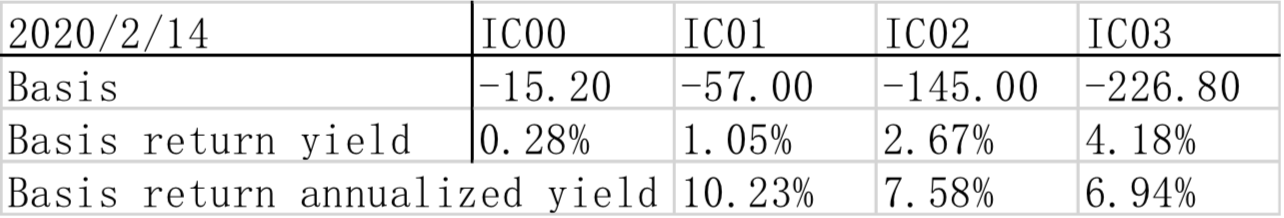
(c)IC
Graph 35: IC contracts basis
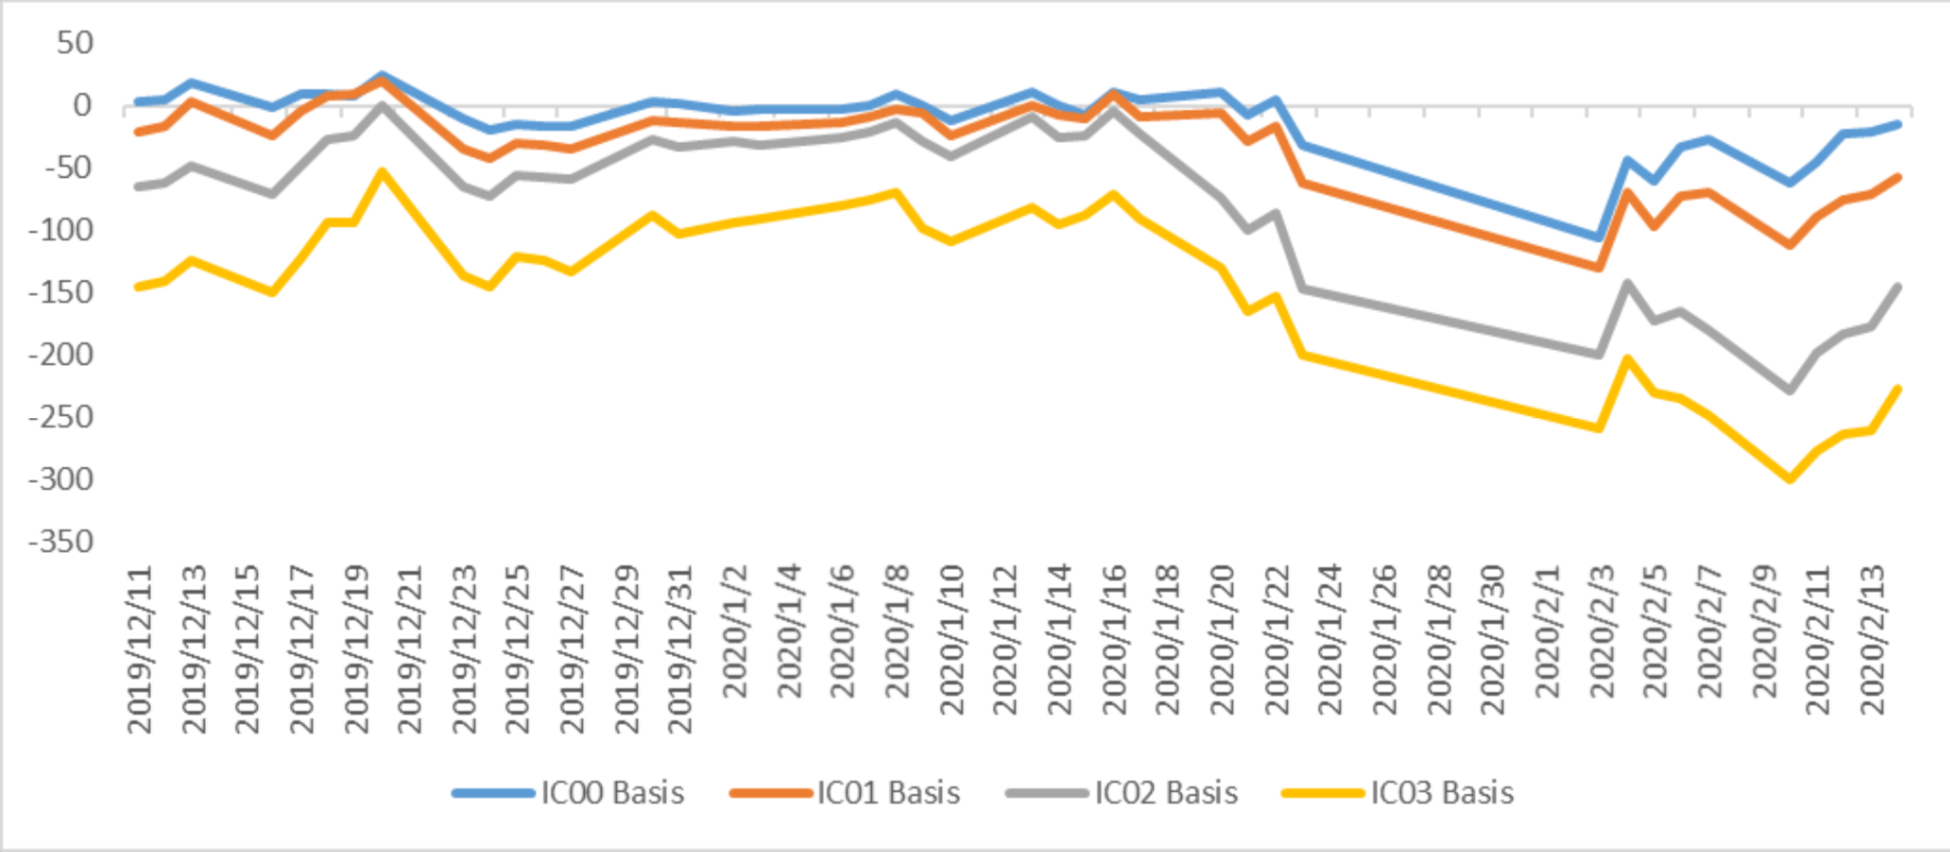
Table 3: IC basis return calculation
3. Financial Markets
(1) Interest Rates
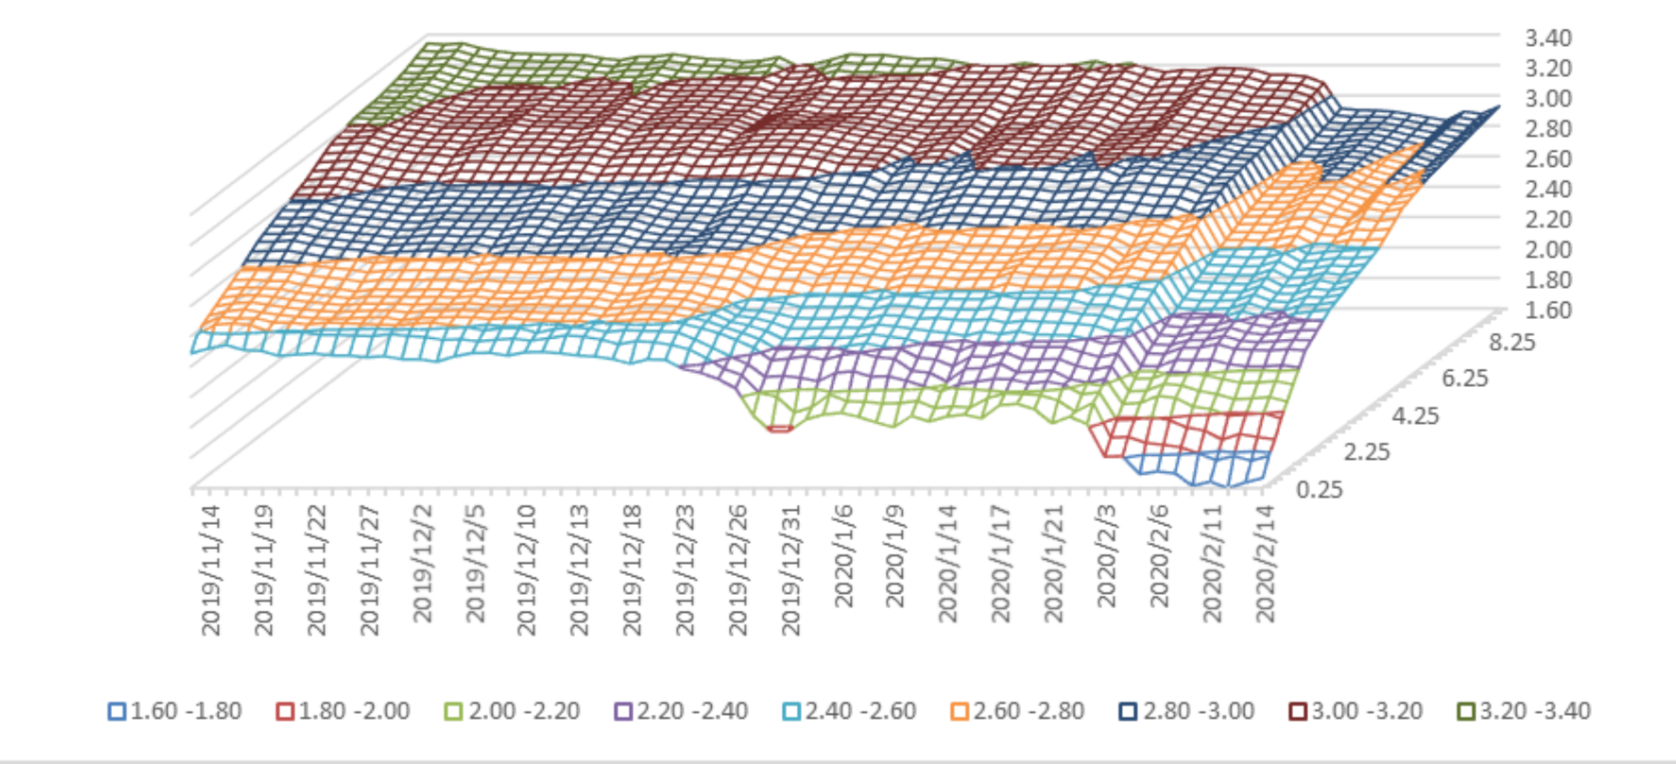
The term structure of treasury bonds’ yields is currently upward sloping in concave shape.
Specifically, last week, short-term yields short term yield of Treasury bond experienced some fluctuation and 3M yield now at 1.6%-1.8% level. Furthermore, as for long-term yield, there is a small drop. 10Y yield is about 2.8%-3.0%.
Graph 36: Term Structure Evolvement of Treasury Bonds Yields During Recent 3 Months (%)
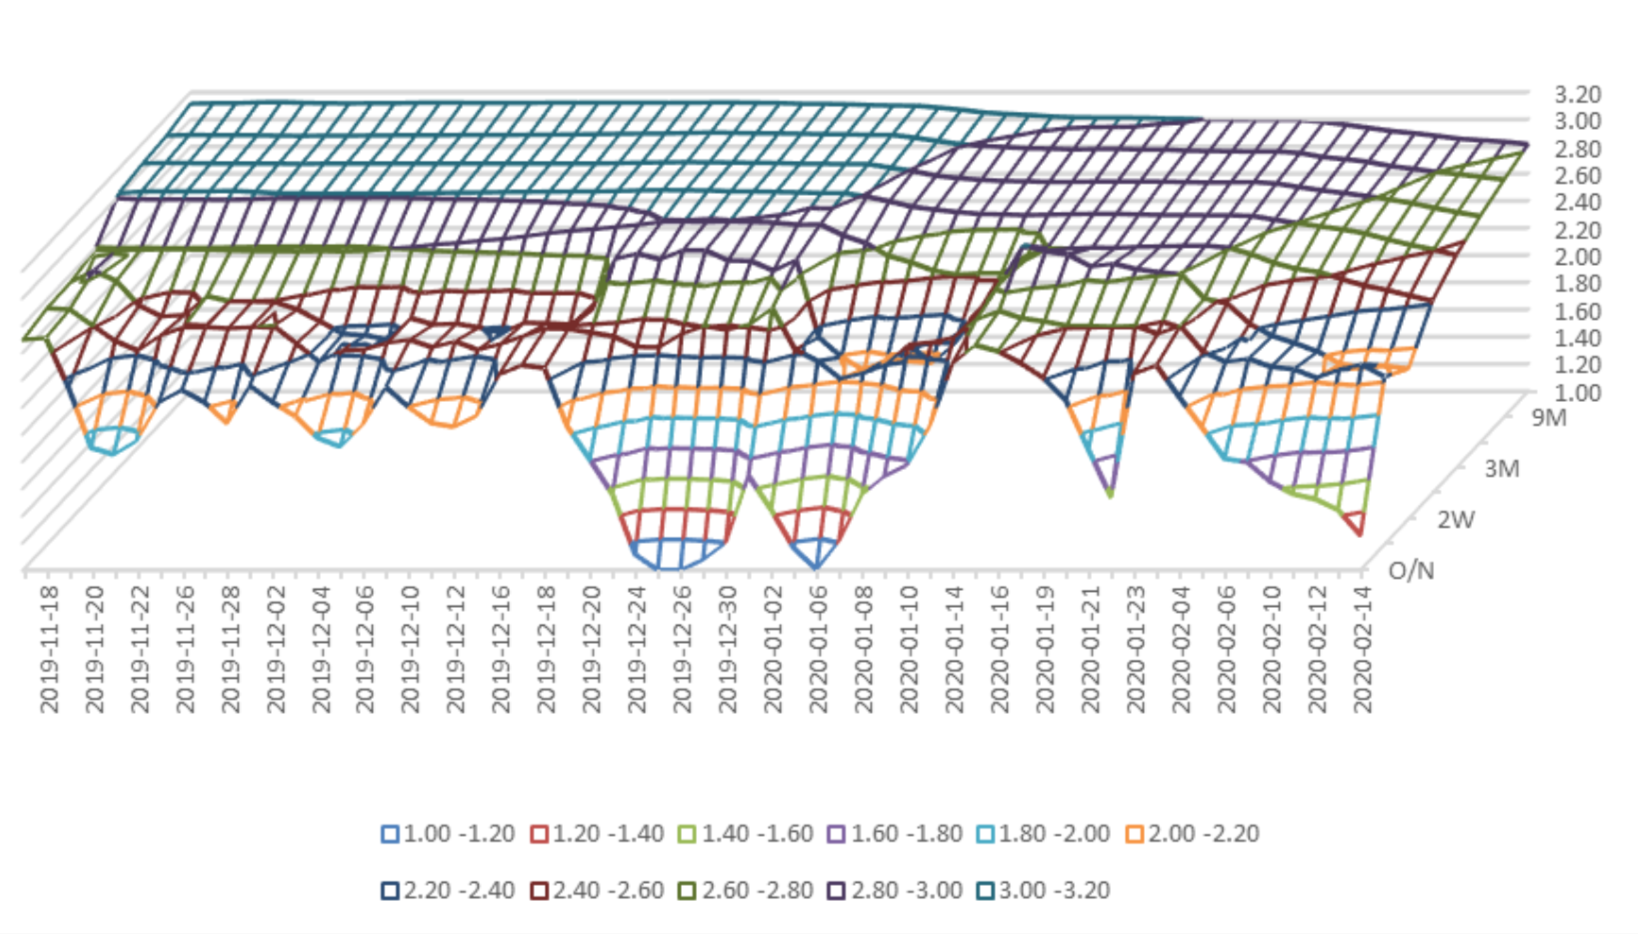
As for Shibor rates, short-term rates experienced significant fluctuation. Specifically, O/N rate experienced obvious fluctuation to 1.6%-1.8% level.
Graph 37: Term Structure Evolvement of Shibor Rates During Recent 3 Months (%)
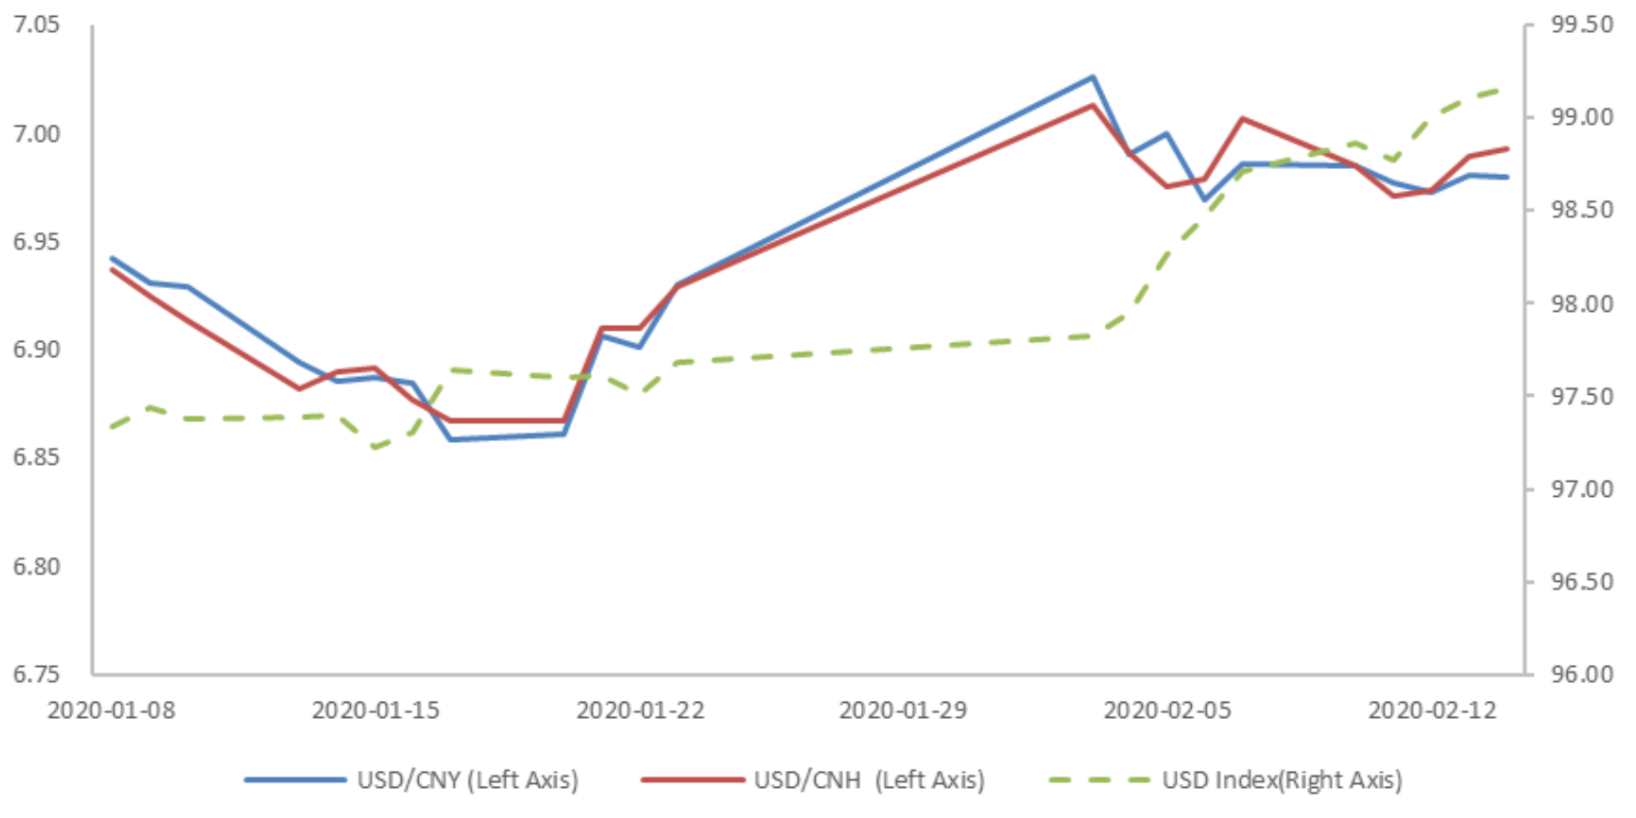
(2) ExchangeRates
During last week, CNY/USD changed -0.093% to 6.9795 and offshore rate, CNH/USD, changed -0.20% to 6.9930 and USD index changed 0.46%.
Graph 38: USD/CNY, USD/CNH and USD Index
Macroeconomic Topic:
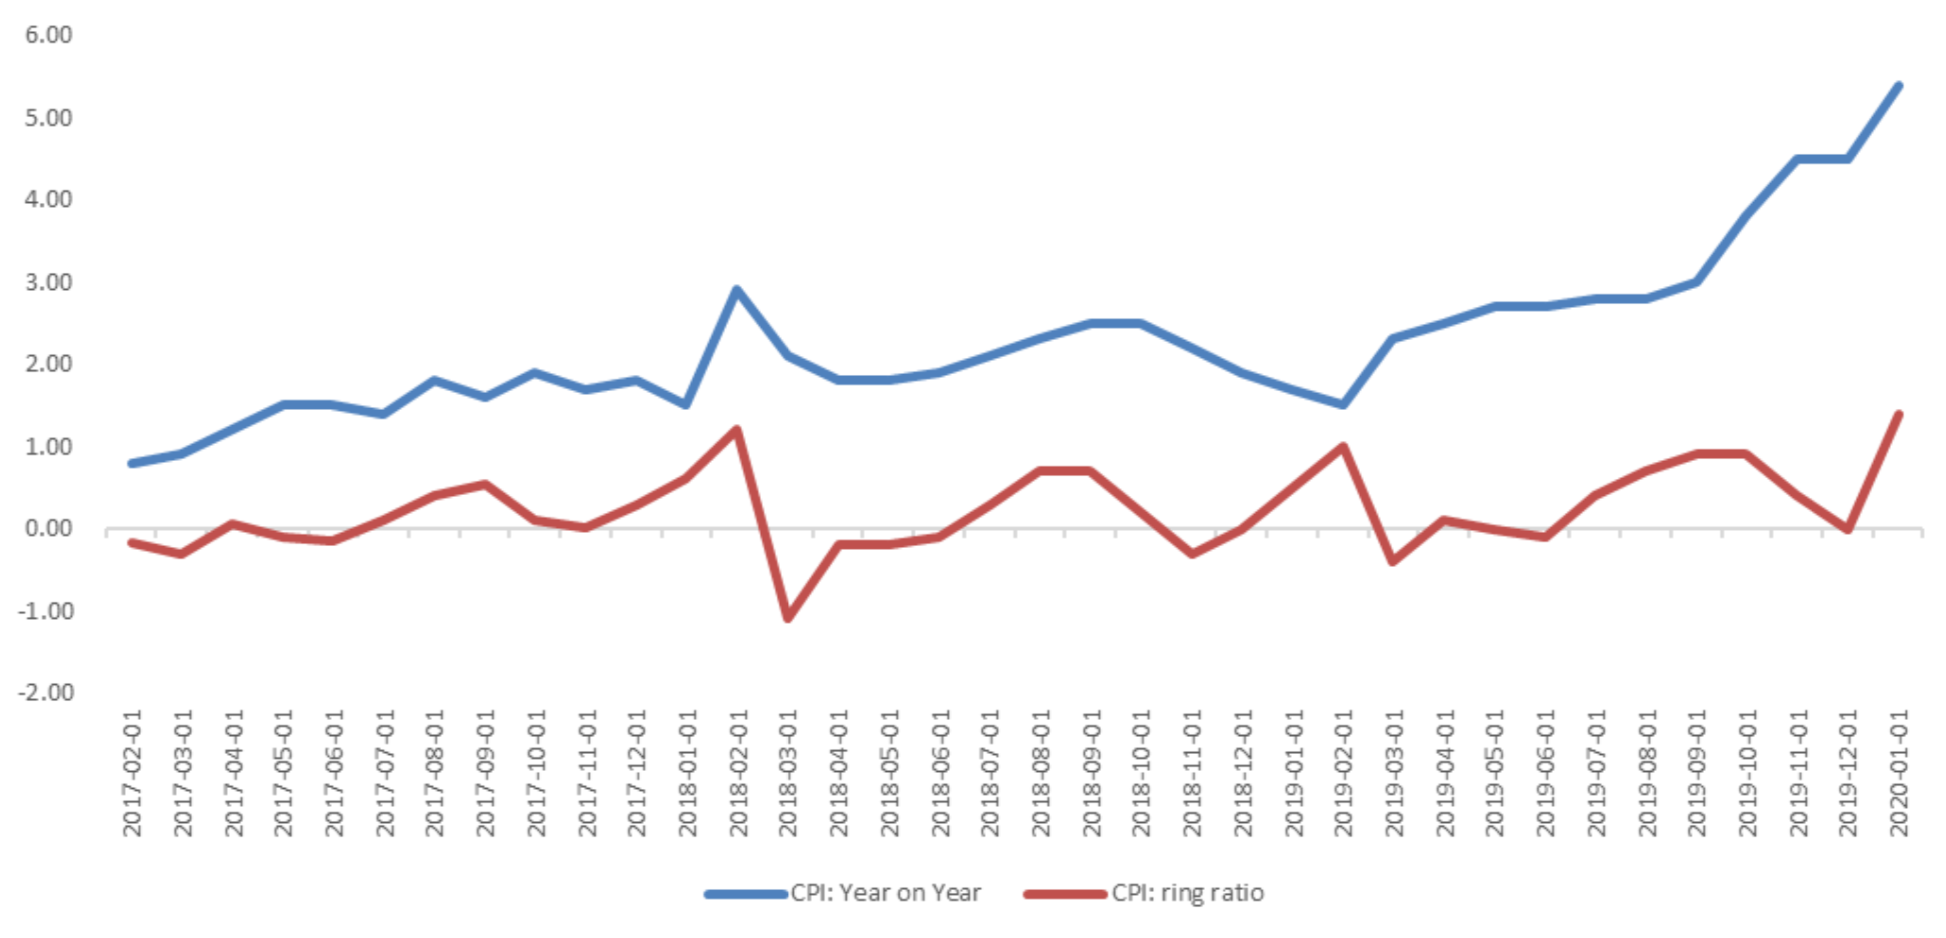
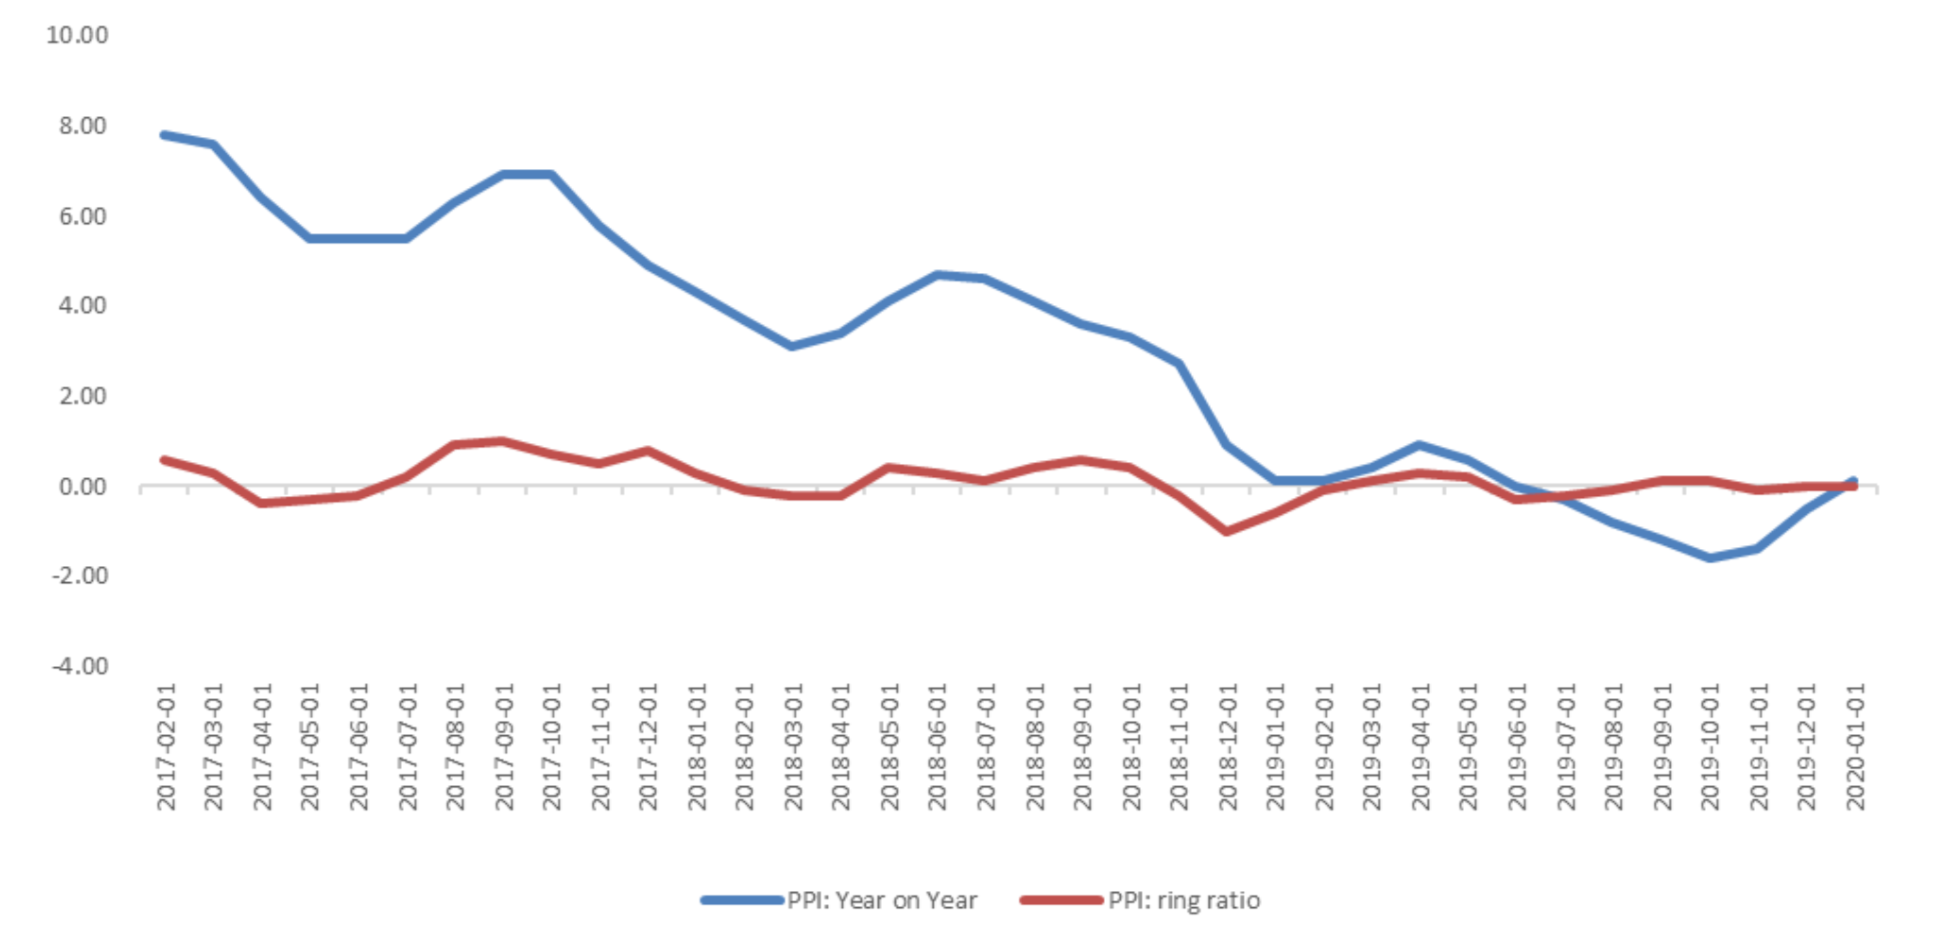
According to the released price data by the national bureau of statistics. The data showed that year-on-year CPI rose again. PPI is back to inflation region. The data showed that the year-on-year and ring ratio CPI were 5.4 percent and 1.4 percent, respectively, compared with pre value of 4.5 percent and 0.0 percent, respectively. Year-on-year and ring ratio PPI were 0.1 percent and 0 percent, respectively, compared with the previous figures of -0.5 percent and 0 percent, respectively.
January Price Data
(1) CPI Data Graph A: CPI Data
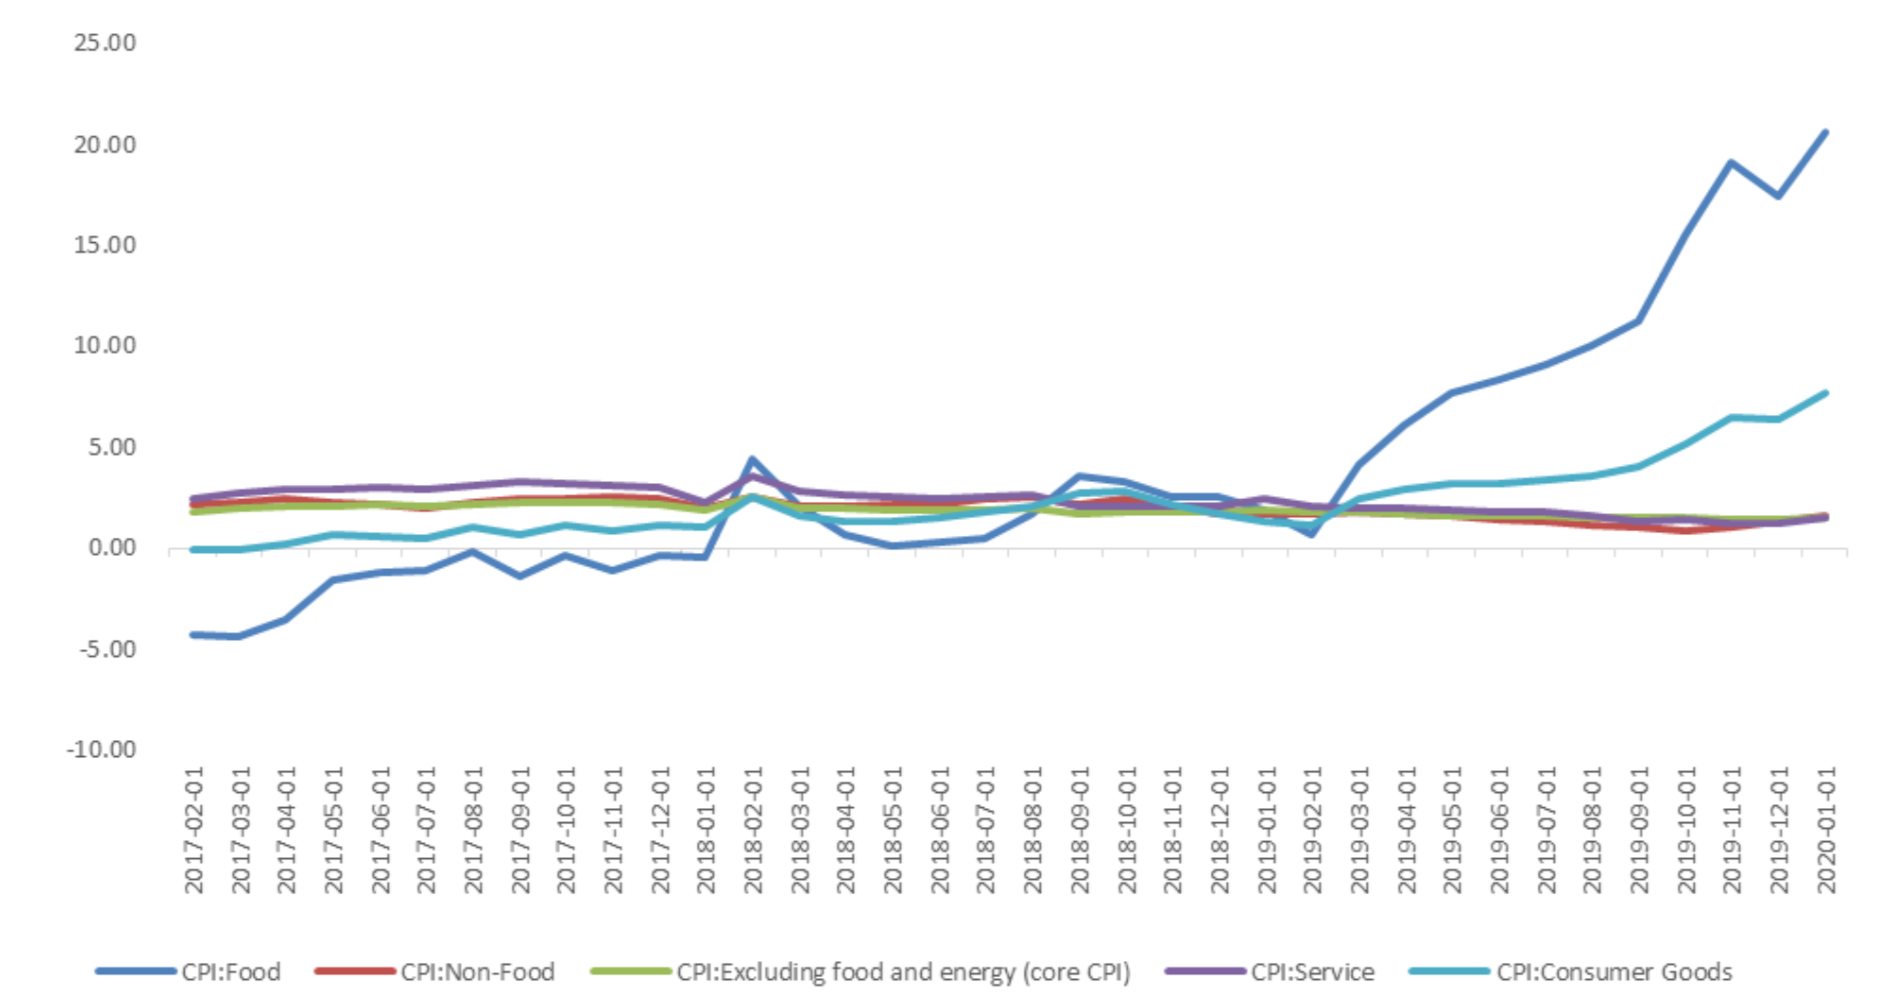
The main reason for CPI rising is the rising of food price. Food CPI increased by 20.6% year-on-year, while non-food CPI increased by 1.6%. The core CPI rose 0.1%, still quite stable.
Graph B: year-on-year CPI: by Food, Non-Food, Core, Services, Consumer Goods (%)
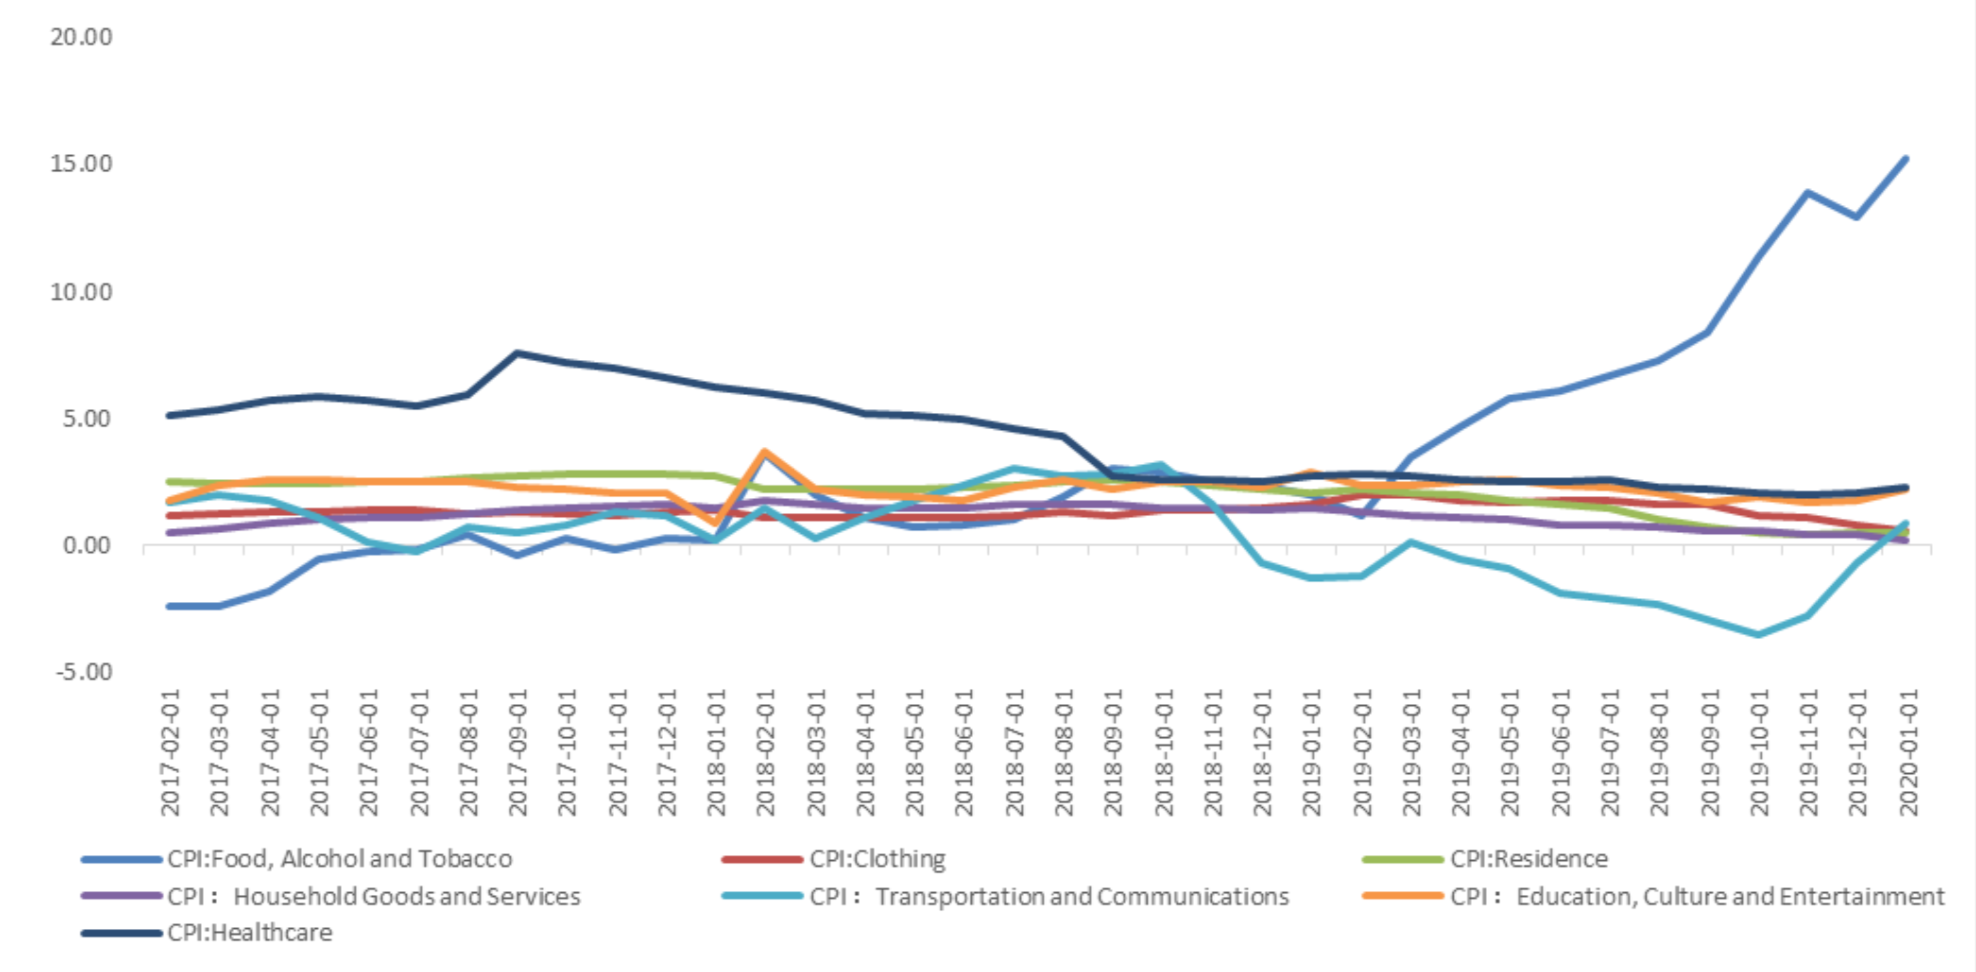
Residence, education, culture and entertainment, healthcare, household goods and service prices rose slightly, with growth rates of 0.5%, 2.2%, 2.3% and 0.2% respectively. Transportation and communication rose 0.9%, back to inflation region.
Graph C: year-on-year CPI: by Food Alcohol and Tobacco, Clothing, Residence, Household Goods & Services, Transportation & Communications, Education, Culture & Entertainment, Healthcare (%)
(2) PPI Data
Graph D: PPI Data (%)
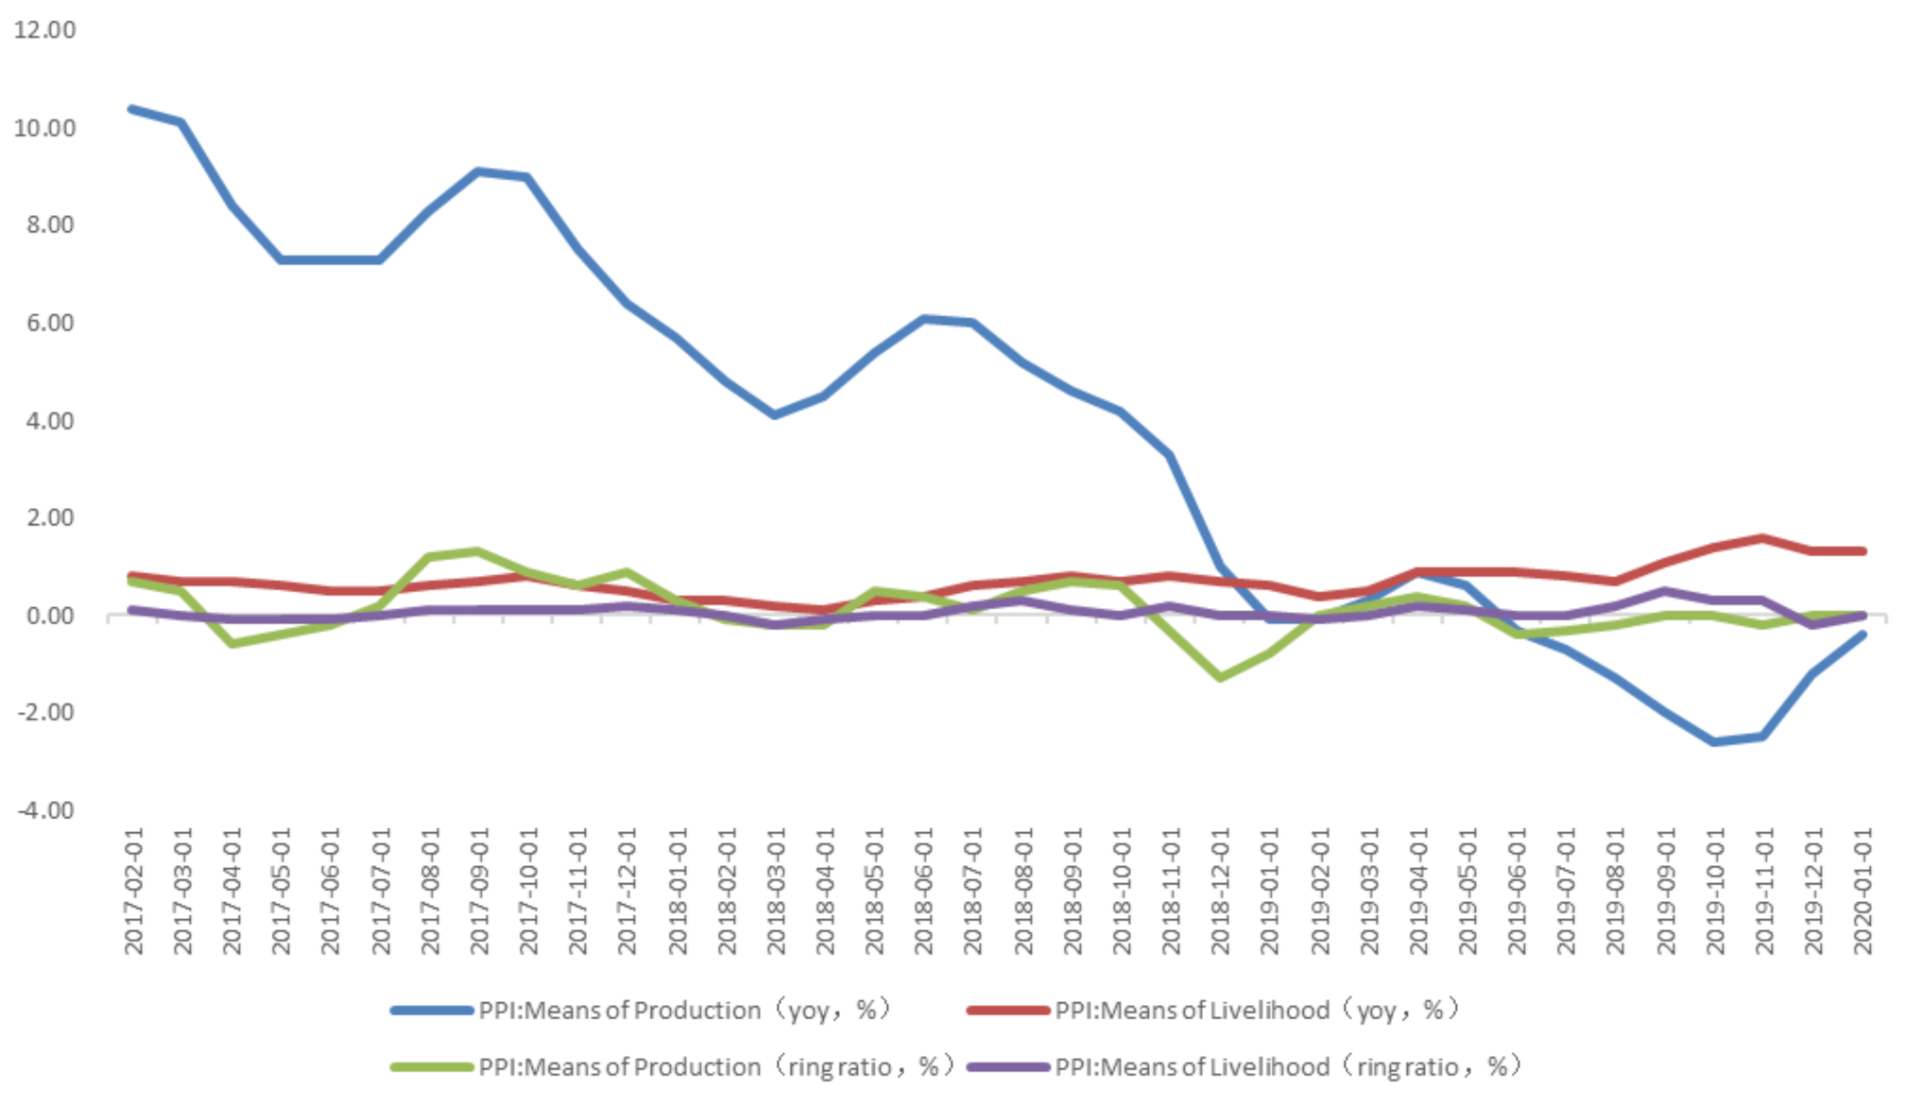
The means of production PPI was -0.4 percent year-on-year, increased 0.8 percentage point from the previous month. The means of livelihoods PPI, was 1.3 percent, compared with the previous value of 1.3 percent.
Graph E: PPI Data, by means of production and means of livelihoods
(3) Summary
In January, CPI was 5.4% year on year (4.5% of the previous value), a new high in 8 years. It is significantly higher than the market expectation of 4.9%. The reason why CPI exceeded expectations is that the Spring Festival effect of agricultural product prices has been extended.
Currently no Comments.
Hot Topics
The 13rd China International Future Forum
The Shanghai Derivatives Energy Forum has received extensive attention from relevant industries both within and outside the borders.
Financial institutions deep explore commodity market opportunities, commodity index financial products show full-scale trend
R-Code for analysis: getKDJ
R-Code@June 06, 2016
New indicator to analyze the arbitrage opportunities between sse50 and csi500
Market review: January 11, 2017
The Great China Bubble: Anniversary Lessons and Outlook
Quant Investment in China A-share market
The hedge strategy between SSE50 and A50--Jan 13,2017
The arbitraging strategy between CSI300 and SSE50
Market review: June 17, 2016
Sleepless in London--Enda Homan(Allied Irish Banks Plc)
MSCI Rebuffs Chinese Equities for Third Time in Blow to Xi
Soros, Druckenmiller among hedgies profiting in market plunge