FangQuant › Option
(1) trading volume and OI
All dollar trading and OI amounts are for notional value. Newest data: 2020/2/14.
Graph 1: Huatai-PB CSI 300 ETF Option Volume and Position (lots)
Graph 2: Harvest CSI 300 ETF Option Volume and Position (lots)

Graph 3: CSI 300 INDEX Option Volume and Position (lots)

Currently Shanghai 300ETF option have the activist trading in quantity
Graph 4: Huatai-PB CSI 300 ETF Option Amount(mUSD)

Graph 5: Harvest CSI 300 ETF Option Amount(mUSD)
Graph 6: CSI 300 INDEX Option Amount(mUSD)
Currently Shanghai 300ETF option have the activist trading in amount
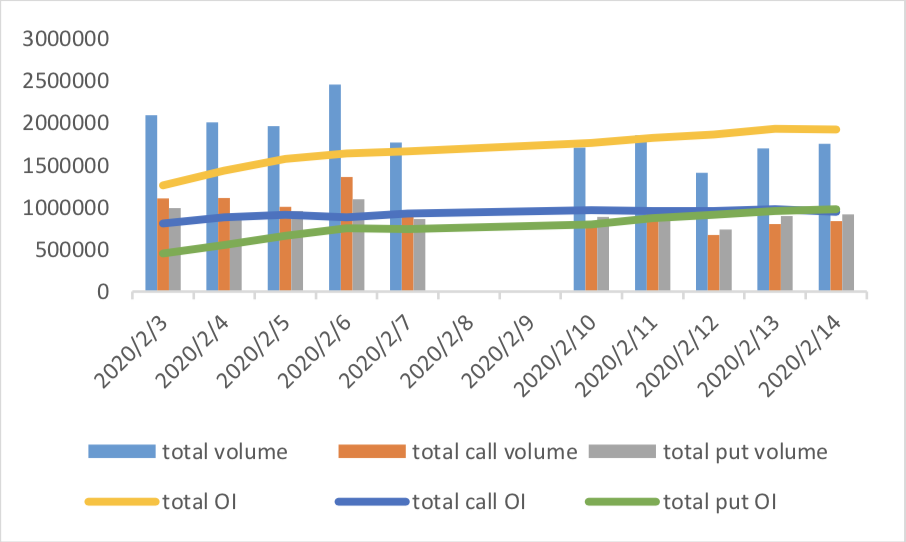
Graph 7: Daily Position and Volume (Lots)

Currently, Shanghai 300ETF option have the activist trading in quantity. Positions are steadily increase after listing.
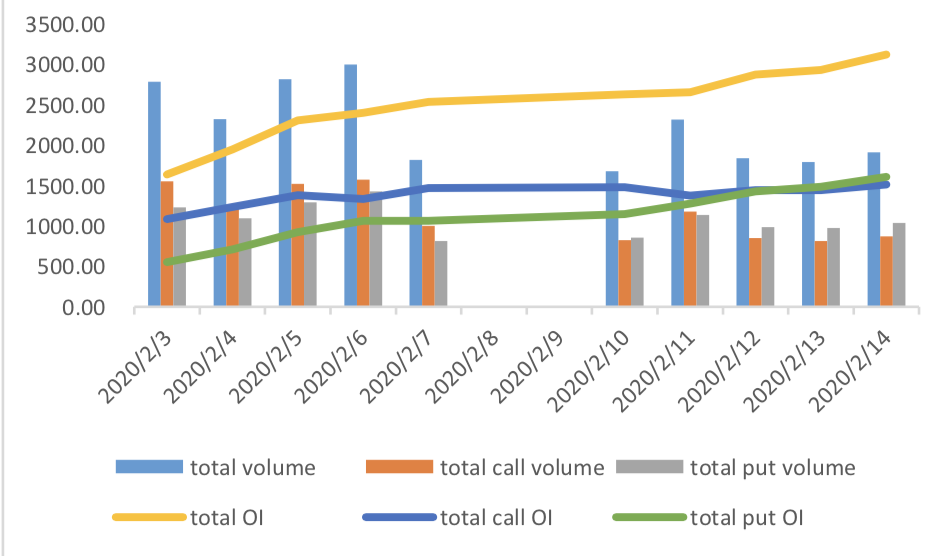
Graph 8: Daily Call Position and Volume (Lots)

Graph 9: Daily Put Position and Volume (Lots)

Currently, Shanghai 300ETF option have the activist trading in quantity in both call and put. Positions are steadily increase after listing.
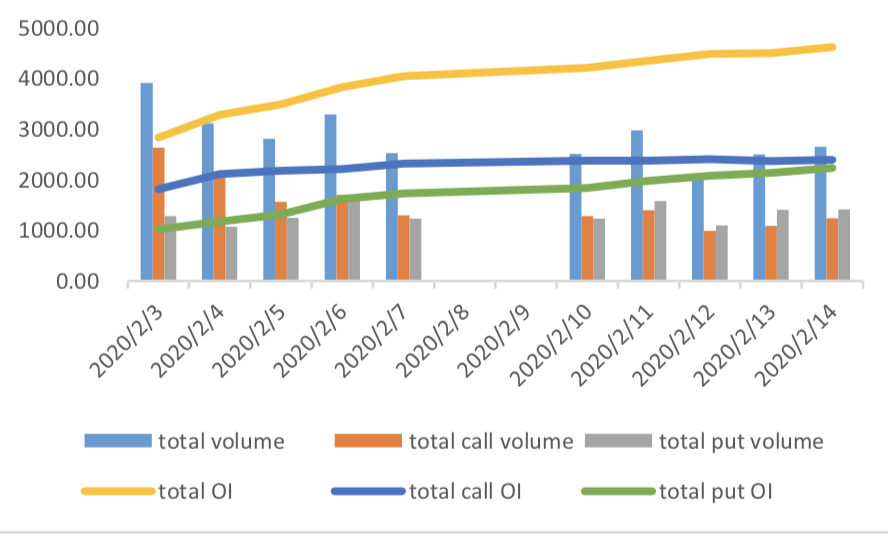
Graph 10: Daily Amount of Position and Volume (mUSD)

Currently, Shanghai 300ETF option have the activist trading in amount. Amount are steadily increase after listing.
Graph 11: Daily Call Amount of Position and Volume (USD Millions)

Graph 12: Daily Put Amount of Position and Volume (USD Millions)
Currently, Shanghai 300ETF option have the activist trading in amount in both call and put. Amounts are steadily increase after listing.
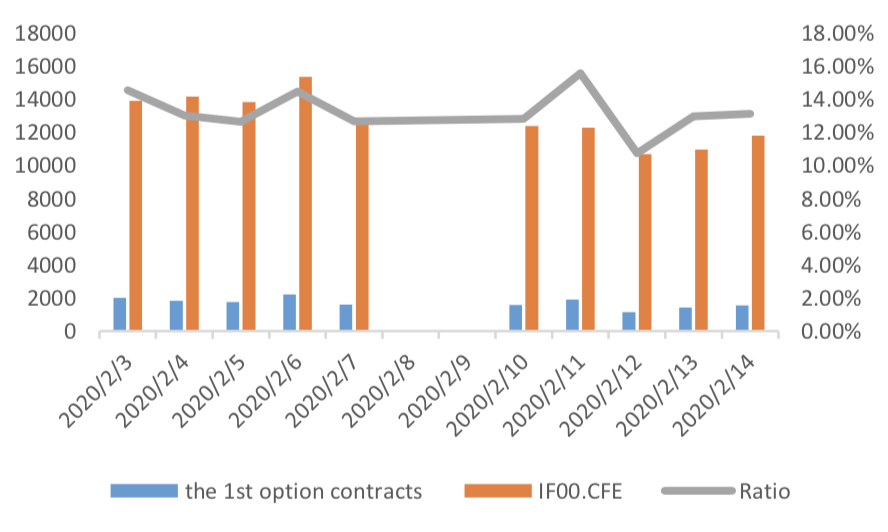
Graph 13: shanghai 300ETF option VS IF contracts: volume & OI (mUSD)

Graph 14: Shenzhen 300ETF option VS IF contracts:volume & OI (mUSD)

Graph 15: CSI300 index option VS IF contracts: volume & OI (mUSD)

Futures still have obvious higher activity than options in term of notional value.
Based on the data of 2020/2/14, the trading volume (in notional value of underlying):
Shanghai 300ETF Options vs IF : 54.61% Shenzhen 300ETF Options vs IF:10.47% CSI300 Index Options vs IF: 14.50%
Graph 16: Shanghai 300ETF option contracts trading by month (mUSD)

Graph 17: Shenzhen 300ETF option contracts trading by month (mUSD)

Graph 18: CSI300 index option contracts trading by month (mUSD)

For 3 options, contracts with nearest month are the most liquid one.
Graph 19 Trading comparison of IF's current month's contract with Shanghai 300ETF option contracts over the same period (mUSD)
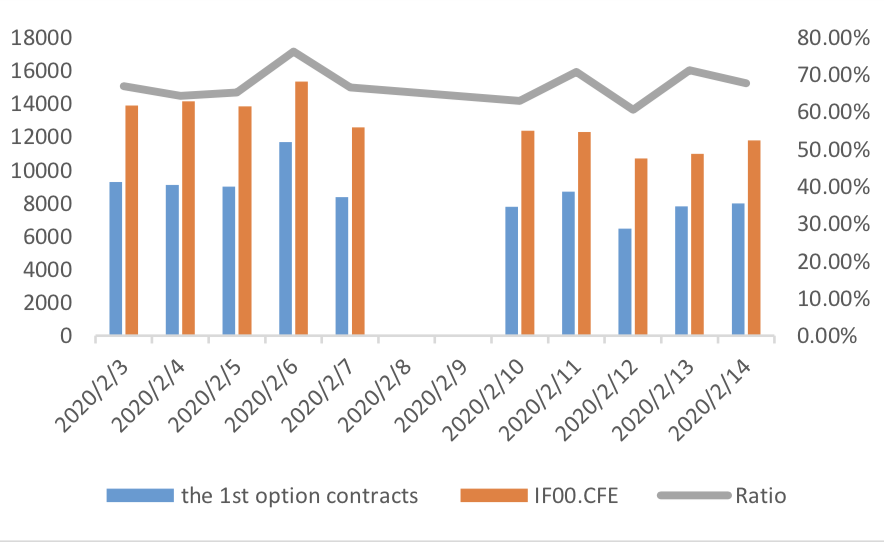
Graph 20: Trading comparison of IF's next month's contract with Shanghai 300ETF option contracts over the same period (mUSD)

Graph 21: Trading comparison of IF's current season's contract with Shanghai 300ETF option contracts over the same period (mUSD)
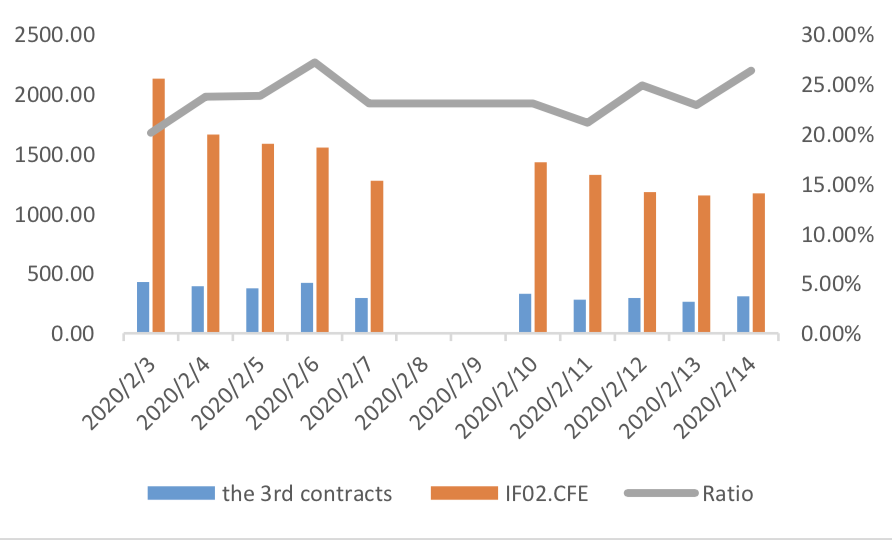
Graph 22: Trading comparison of IF's next season's contract with Shanghai 300ETF option contracts over the same period (mUSD)

Graph 23: Trading comparison of IF's current month's contract with Shenzhen 300ETF option contracts over the same period (mUSD)
Graph 24: Trading comparison of IF's next month's contract with Shenzhen 300ETF option contracts over the same period (mUSD)

Graph 25: Trading comparison of IF's current season's contract with Shenzhen 300ETF option contracts over the same period (mUSD)
Graph 26: Trading comparison of IF's next season's contract with Shenzhen 300ETF option contracts over the same period (mUSD)

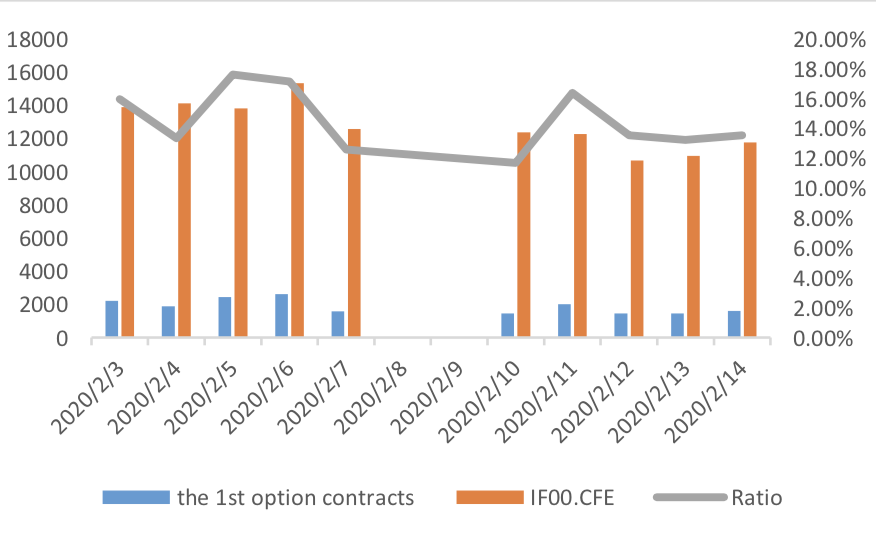
Graph 27: Trading comparison of IF's current month's contract with CSI300 stock index option contracts over the same period (mUSD)
Graph 28: Trading comparison of IF's next month's contract with CSI300 stock index option contracts over the same period (mUSD)

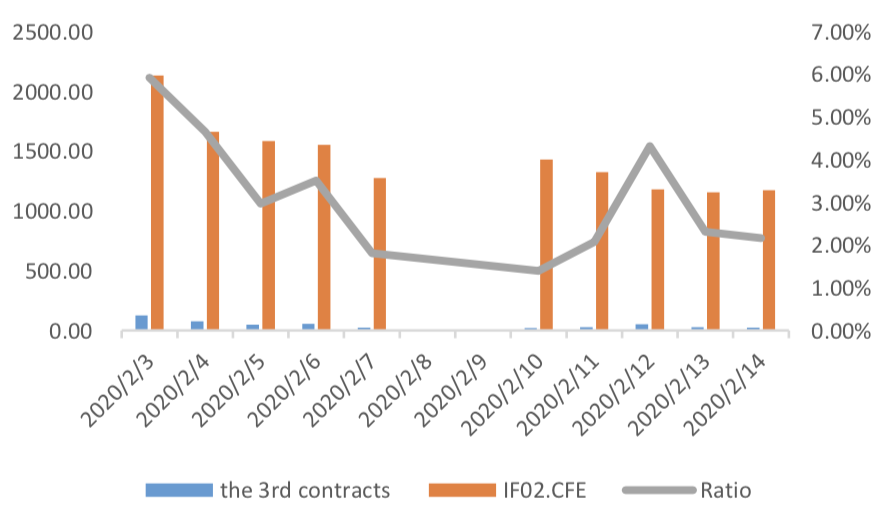
Graph 29: Trading comparison of IF's current season's contract with CSI300 stock index option contracts over the same period (mUSD)

Graph 30: Trading comparison of IF's next season's contract with CSI300 stock index option contracts over the same period (mUSD)

(2)synthetic futures
Synthetic futures basis went negative after Spring Festival. We can see extreme value due to the huge market fluctuation on the first day after holidays, then it rose but still negative.
Graph 31: Shanghai 300ETF option synthetic futures basis rate

Graph 32: Shenzhen 300ETF option synthetic futures basis rate

Graph 33: CSI300 index option synthetic futures basis rate

(3)Implied Volatility
GVX(current month ‘ATM’ contracts IV)
GVX is based on average IV of closest OTM call and put weighted by distance. If spot price equal to an execution price, then it is the average IV of call and put with that execution price.
Graph 34 GVX of 3 option contracts

Here, IVs are from Wind, it sets interest rate to be 3M YTM of Treasury bond and using BSM to imply IVs.
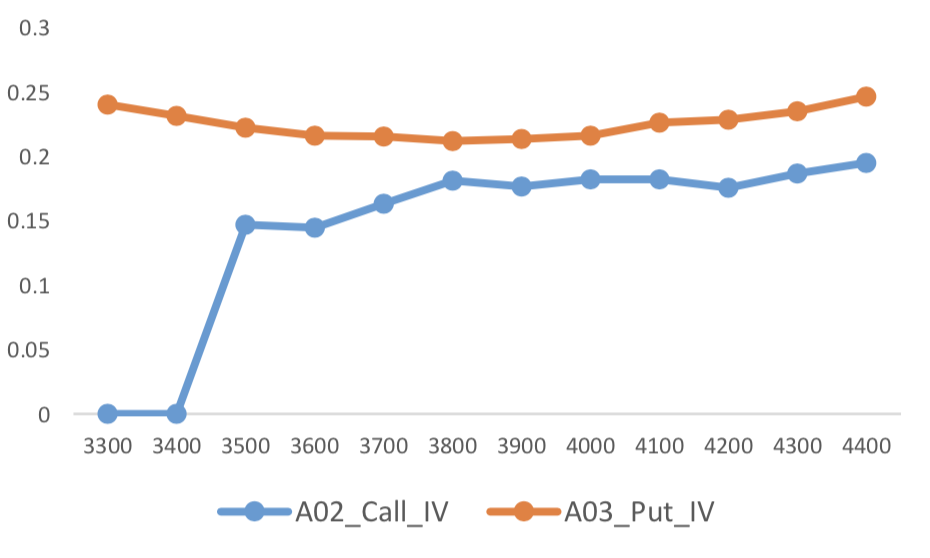
IV Smiles
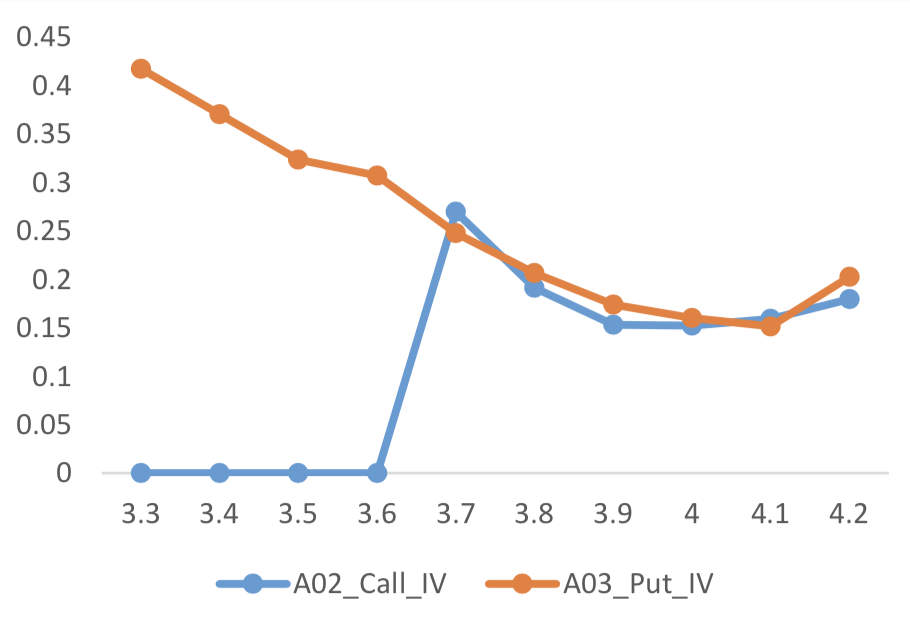
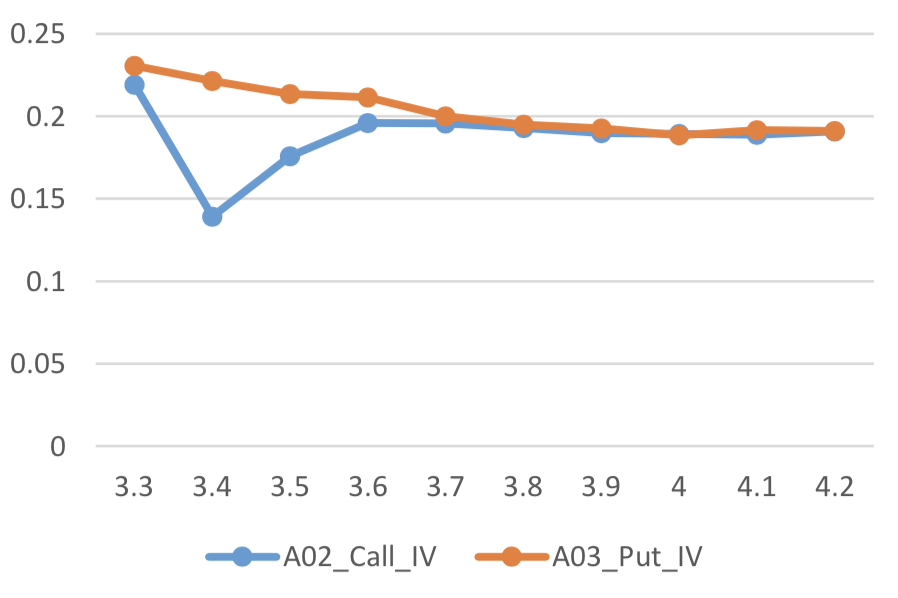
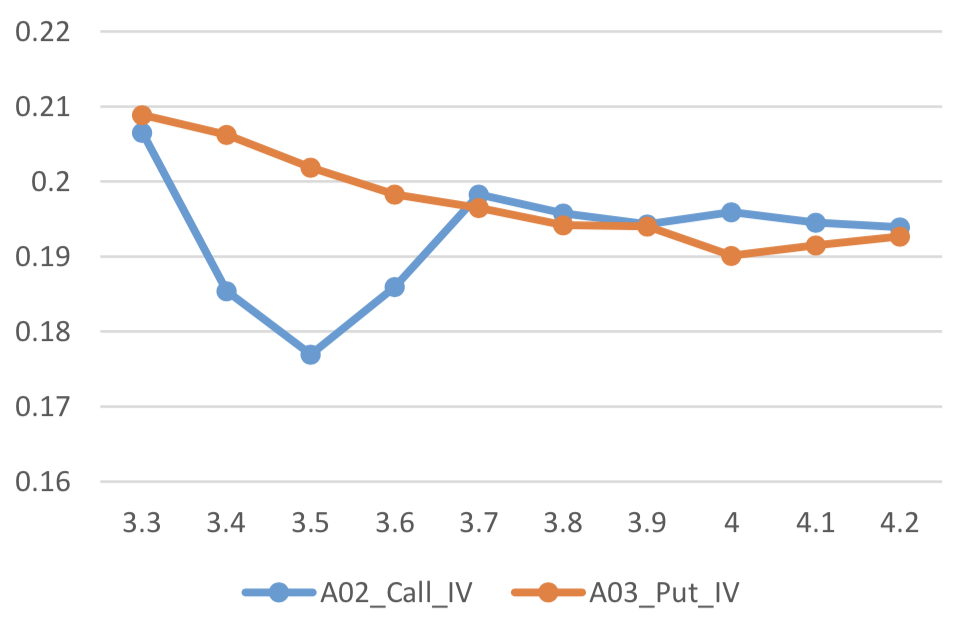
The data is for 2020/2/14 .
Graph 35 Shanghai 300ETF Option Current Month contracts IV curves
Graph 36: Shanghai 300ETF Option Next Month contracts IV curves

Graph 37 Shanghai 300ETF Option Current Season contracts IV curves
Graph 38: Shanghai 300ETF Option Next Season contracts IV curves
Graph 39 Shenzhen 300ETF Option Current Month contracts IV curves

Graph 40: Shenzhen 300ETF Option Next Month contracts IV curves

Graph 41 Shenzhen 300ETF Option Current Season contracts IV curves

Graph 42: Shenzhen 300ETF Option Next Season contracts IV curves

Graph 43 CSI300 Index Option 1st Month contracts IV curves

Graph 44: CSI300 Index Option 2nd Month contracts IV curves

Graph 45: CSI300 Index Option 3rd Month contracts IV curves

Graph 46: CSI300 Index Option 1st Season contracts IV curves
Graph 47: CSI300 Index Option 2nd Season contracts IV curves

Graph 48: CSI300 Index Option 3rd Season contracts IV curves

Currently no Comments.
Hot Topics
The 13rd China International Future Forum
The Shanghai Derivatives Energy Forum has received extensive attention from relevant industries both within and outside the borders.
Financial institutions deep explore commodity market opportunities, commodity index financial products show full-scale trend
R-Code for analysis: getKDJ
New indicator to analyze the arbitrage opportunities between sse50 and csi500
R-Code@June 06, 2016
Market review: January 11, 2017
The Great China Bubble: Anniversary Lessons and Outlook
Quant Investment in China A-share market
The hedge strategy between SSE50 and A50--Jan 13,2017
The arbitraging strategy between CSI300 and SSE50
Market review: June 17, 2016
Sleepless in London--Enda Homan(Allied Irish Banks Plc)
MSCI Rebuffs Chinese Equities for Third Time in Blow to Xi
Soros, Druckenmiller among hedgies profiting in market plunge