FangQuant › Financial Futures
Market Summary:
Last week, there was generally increase over the market. Shanghai SE Composite Index (000001.SH) changed 4.21 % to 3039.67. Specifically, small cap shares perform better than large cap shares and we can observe that CSI500 did better than SSE50 (6.70% vs 2.52%). The average daily turnover of the whole market during past 5 trading days is 1043.08 billion CNY, it increased 25.79% compared with the previous 5-trading day period.
During the week, the epidemic situation shows a sign of controlling, with new increase far less than curing number (2000). This indicates that the time with over economic impact by the epidemic situation should come to an end in near future. The overall impact should be limited.
As for arbitrage opportunity, all futures current-month contracts show some room for arbitrage opportunities. No price spread for next-month/current month contracts show room for arbitrage.
News:
(1) Xinhua News Agency: Xi Jinping: macro policy focuses on counter cyclical adjustment, rhythm and intensity should be able to hedge the impact of the epidemic, prevent the economic operation from sliding out of a reasonable range, and prevent short-term shocks from becoming a trend change. Economic society is a dynamic cycle system, which can not be suspended for a long time. On the premise of ensuring the epidemic prevention and control in place, promoting the resumption of work and production of enterprises and institutions in key areas of non epidemic prevention and control, restoring the order of production and life, providing a strong material guarantee for epidemic prevention and control, ensuring people's livelihood and social stability, realizing the economic and social development goals and tasks of the whole year, building a moderately prosperous society in an all-round way and completing the 13th five year plan, are related To China's opening up and world economic stability.
(2) Sina: according to media reports, ultra-low interest rates and a large number of U.S. corporate bonds have led to the gradual accumulation of some of the world's largest bond fund risks. GMO, the Boston fund manager, said the surge in US Treasury prices and record low yields increased the risk of loss for AGG tracking fund investors. In September, the yield on 10-year US Treasury bonds fell to a record low of 1.47%, while the average yield on US investment grade bonds is currently hovering at a record low of 2.57%. As a result, AGG's yield fell to 2.6%, which led to a substantial increase in its duration - that is, if interest rates rise, there is a risk of loss.
(3) Wind: Xi Jinping made 8 requests for orderly resumption of work and resumption of production. First, we will return to work in different areas and levels. In low-risk areas, the prevention and control strategy should be adjusted to the input of external prevention as soon as possible, and the order of production and life should be restored in an all-round way. In medium risk areas, the work should be resumed orderly according to the prevention and control situation, and in high-risk areas, the work of epidemic prevention and control should be focused on. Second, we will increase macro policy adjustment. Active fiscal policy should be more active and promising. We should continue to study and introduce phased and targeted tax reduction and fee reduction policies to help small and medium-sized micro enterprises overcome difficulties. A sound monetary policy should pay more attention to flexibility and moderation, make good use of existing financial support policies, and timely introduce new policy measures. Third, we will comprehensively strengthen measures to stabilize employment. Fourth, we will resolutely complete the task of overcoming poverty. Fifth, we will promote the resumption of production. It is necessary to implement the strategy of precise prevention and control at different levels, break through the blocking points of people flow and logistics, release the restrictions of freight logistics, and promote the coordinated resumption of production in all links of the industrial chain. We should actively expand effective domestic demand, accelerate the construction progress of projects under construction and new projects, and strengthen the guarantee of employment, land use, capital and other elements. Sixth, we should seize every opportunity to do a good job in agricultural production in spring. Seventh, we should ensure the basic people's livelihood. Eighth, stabilize the foreign trade and foreign capital base. We should make full use of export tax rebate, export credit insurance and other compliant foreign trade policy tools.
(4) China's novel coronavirus epidemic situation has brought a certain negative impact on the current Chinese economy, but the overall impact is short and limited, Chen Yulu, vice president of the central bank, said in the financial times. China's economy is resilient and has ample policy space. The epidemic will not affect the fundamentals of long-term economic growth. At present, the Chinese government has taken strong measures to prevent and control the epidemic and achieved remarkable results. After the epidemic, the consumption and investment demand suppressed in the early stage will be fully released, and the economic growth will rebound rapidly.
(5) CCTV news: the IMF said the Chinese government is taking measures such as crisis management, liquidity supply, fiscal measures and financial support to alleviate the negative impact of the epidemic on the economy. In the case of effective prevention and control of the epidemic by the above policies and measures, China's economy will return to normal in the second quarter. In the future, the global economy may be less affected and the duration may be shorter.
1. StockMarket
(1) Indices Performance
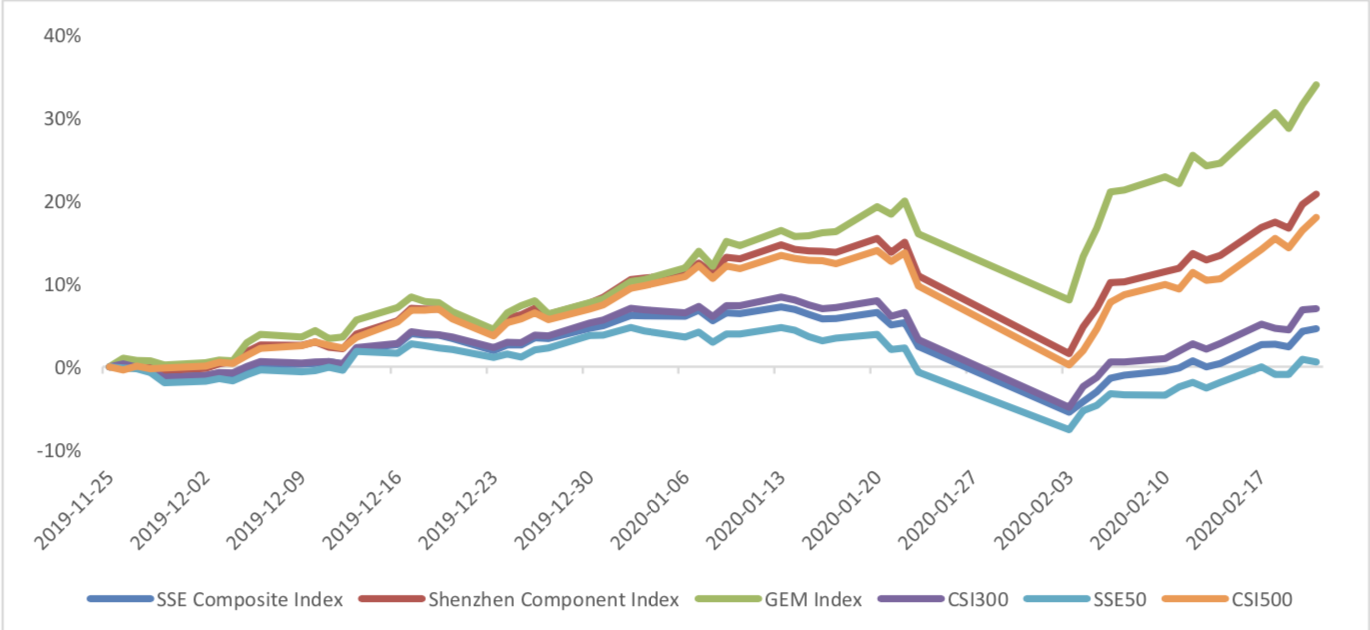
During last week, Shanghai SE Composite Index (000001.SH) changed 4.21 % to 3039.67, Shenzhen Component Index (399001.SZ) changed 6.54 % to 11629.70, ChiNext Price Index (399006.SZ) changed 7.61 % to 2226.64, CSI 300 INDEX (000300.SH) changed 4.06 % to 4149.49, CSI SmallCap 500 index (000905.SH) changed 6.70 % to 5784.03, SSE 50 Index (000016.SH) changed 2.52 % to 2968.14.
Graph 1: Indices Performance over past 3 months
The average daily turnover of the whole market during past 5 trading days is 1043.08 billion CNY, it increased 25.79% compared with the previous 5-trading day period.
Graph 2: Market turnover

(2) Sectors Performance
In the view of sectors, during last week (from 2020-02-14 to 2020-02-21), 24 of 24 Wind Level- 2 sector(s) increased while 0 sector(s) dropped. Specifically, Semiconductors & Semiconductor Equipment (13.20%), Diversified Financials(13.16%) and Technology Hardware & Equipment(12.33%) did the best performance while Pharmaceuticals & Biotechnology(1.55%), Food & Staples Retailing (1.56%) and Banks(2.48%) did the worst performance.
Graph 3: Sectors performance under Wind Level-2 classification (%)

(3) Indices Valuation (TTM)
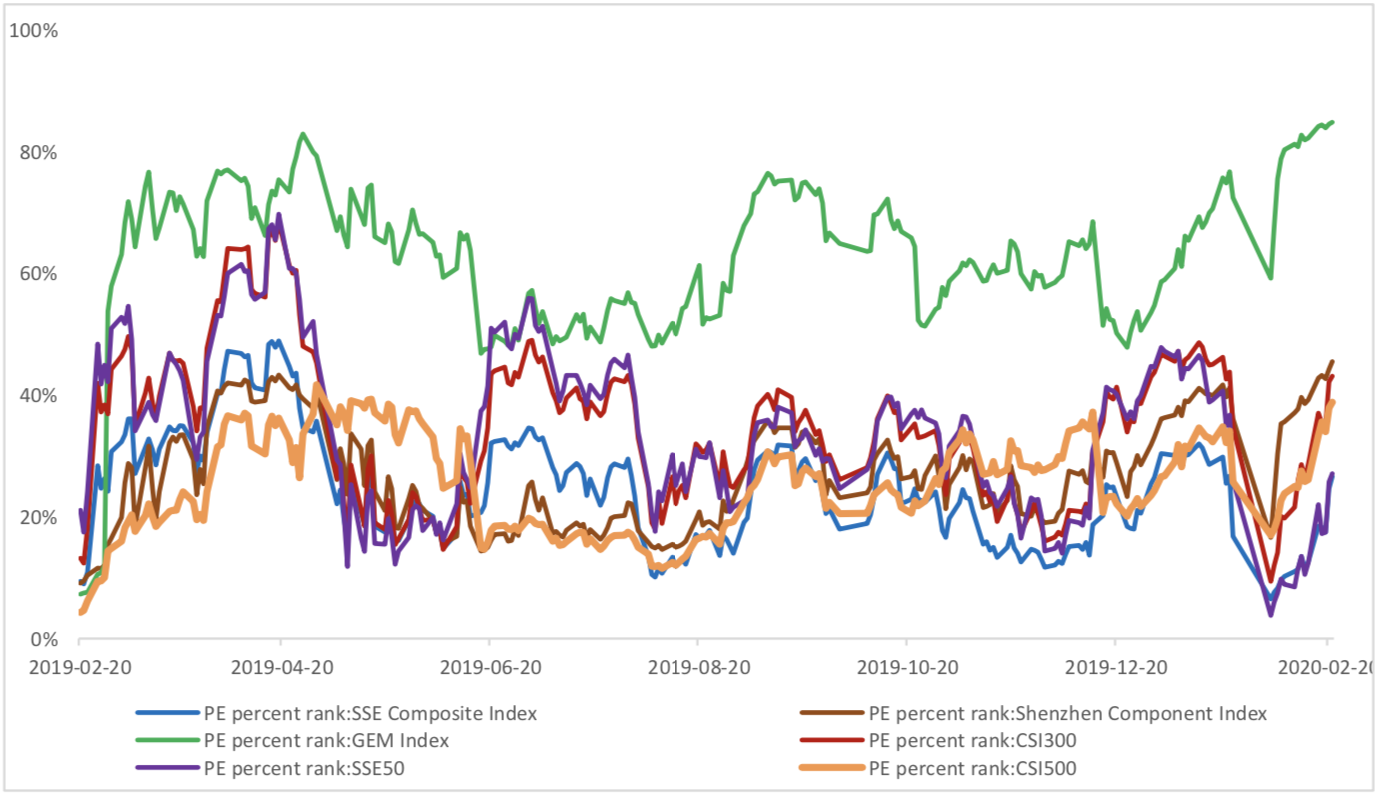
The current PE for SSE Composite Index, Shenzhen Component Index, GEM Index, CSI300, SSE50, CSI500 are 13.1179, 27.0926, 63.8587, 12.4518, 9.5842, 27.0968respectively; and these indices are at 26.60%, 45.50%, 84.80%, 43.10%, 27.10%, 38.80% percent rank level of their historic data, respectively
Graph 4: PE of 6 indices

Graph 5: PE percent rank of 6 indices (calculated by data of past 1200 trading days, only 1Y data is presented on the graph)
The current PB for SSE Composite Index, Shenzhen Component Index, GEM Index, CSI300, SSE50, CSI500 are 1.3926,2.9605,6.7025,1.4914,1.1715, 1.9887respectively, and these indices are at 16.80%, 44.30%, 80.60%, 46.50%, 21.60%, 30.60% percent rank level of their historic data, respectively.
Graph 6: PB of 6 indices

Graph 7: PB percent rank of 6 indices (calculated by data of past 1200 trading days, only 1Y data is presented on the graph)

(4) Foreign Fund Flow
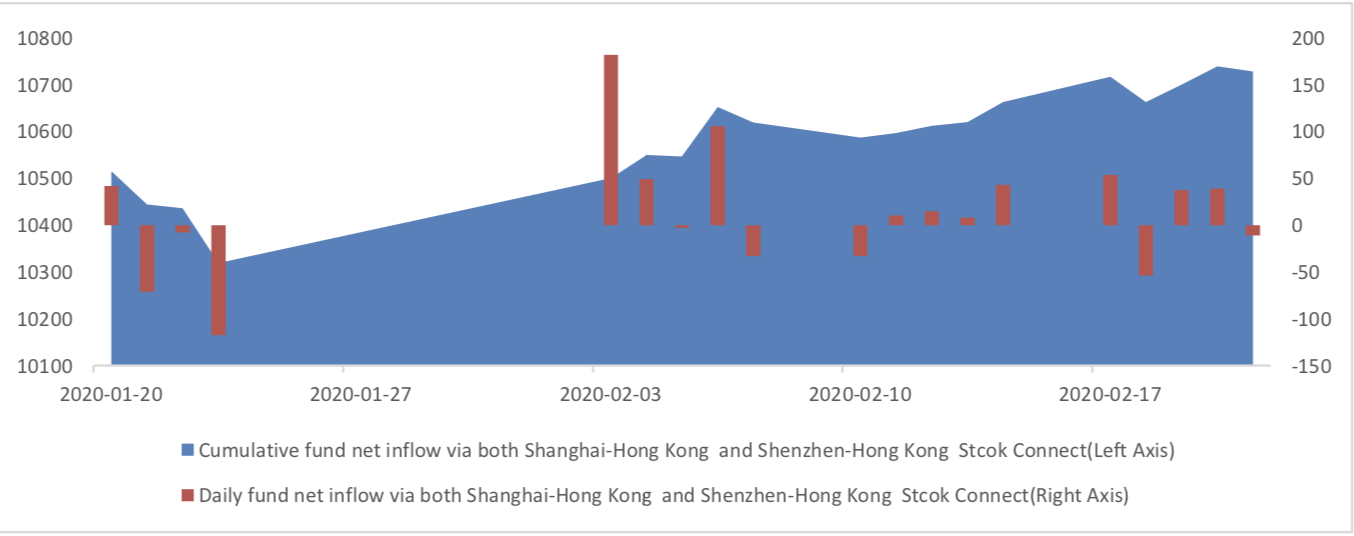
During last 5 trading days the total foreign fund flow via Stock Connect is 6.49 billion RMB, and the cumulative inflows was 1072.79 billion RMB. Specifically, the fund flow via Shanghai-Hong Kong Stock Connect is 1.23 billion RMB and the fund flow via Shenzhen-Hong Kong Stock Connect is 5.26 billion RMB.
Graph 8: Fund flow via both Shanghai and Shenzhen-Hong Kong Stock Connect in past 1M (100 million CNY)
Graph 9: Fund flow via Shenzhen-Hong Kong Stock Connect in past 1M (100 million CNY)

Graph 10: Fund flow via both Shanghai-Hong Kong Stock Connect in past 1M (100 million CNY)

(5) Margin Trading
According to the newest data, the margin financing balance is 967.84 billion, securities borrowing is
13.47 billion, totally 981.31 billion.
Graph 11: Margin Trading(100m RMB)

2. Index Futures
(1) Trading Volume and Open Interests
During past 5 trading days the average trading volume for CSI300(IF), SSE50(IH), CSI500(IC) contracts
are 120320 (16.16%, the previous 5-trading day period),41299 (21.94%),144730 (18.99%) lots, respectively. On the last trading day, the total open interests for them are 134573 (-6.45%),60440 (- 0.28%),181631 (-1.41%) lots respectively.
Graph 12: CSI300 Index futures’ trading volume

Graph 13: CSI300 Index futures’ open interests

Graph 14:SSE50 Index futures’ trading volume

Graph 15: SSE50 Index futures’ open interests

Graph 16: CSI500 Index futures’ trading volume

Graph 17: CSI500 Index futures’ open interests

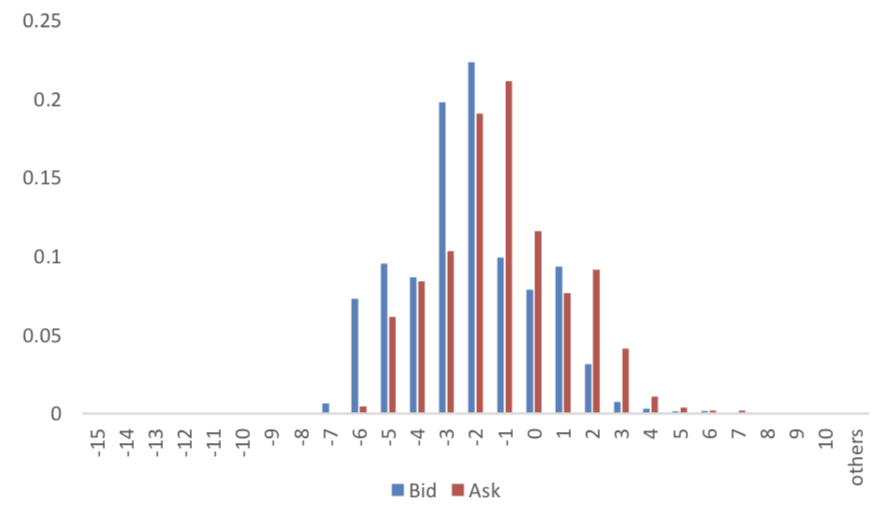
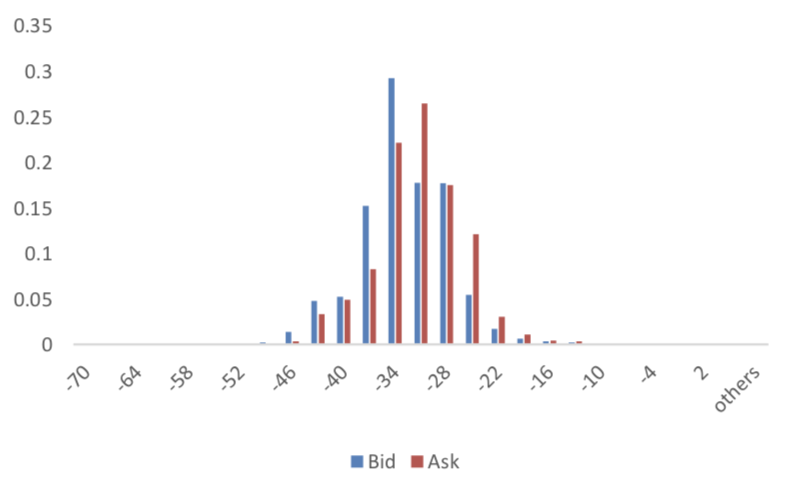
(2) Roll Level Bid-Ask Distribution Worked form last 3 trading days.
Graph 18: CSI300 Current/Next Month Contract Roll Spread Distribution (2s frequency)

Graph 19: SSE50 Current/Next Month Contract Roll Spread Distribution (2s frequency)
Graph 20: CSI500 Current/Next Month Contract Roll Spread Distribution (2s frequency)
Assumption: risk-free rate: 3%; security borrowing cost: 8%; trading expense for spot: 0.025%; trading expense for futures: 0.005%; margin rates for futures contracts: 0.11 for CSI300 and SSE50, 0.13 for CSI500; margin rate for security borrowing: 0.3 (or 130% maintain rate).
When real price spread is out of theoretical range (calculated by our assumption), there exists absolute future-spot arbitrage opportunity.
Graph 21: Future (Current Month)-Spot Arbitrage Opportunity for CSI300 contract (in the view of price difference)
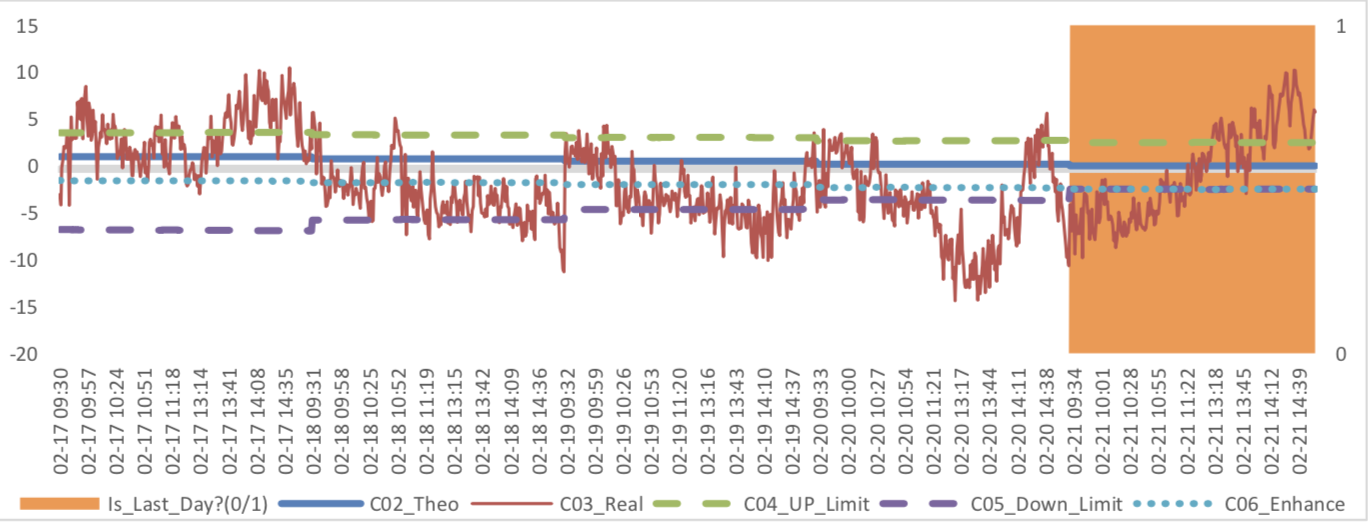
Graph 22: Future (Current Month)-Spot Arbitrage Opportunity for SSE50 contract (in the view of price difference)

Graph 23: Future (Current Month)-Spot Arbitrage Opportunity for CSI500 contract (in the view of price difference)

Graph 24: Future (Next Month-Current Month) Arbitrage Opportunity for CSI300 contract (in the view of price difference)

Graph 25: Future (Next Month-Current Month) Arbitrage Opportunity for SSE50 contract (in the view of price difference)

Graph 26: Future (Next Month-Current Month) Arbitrage Opportunity for CSI500 contract (in the view of price
difference)

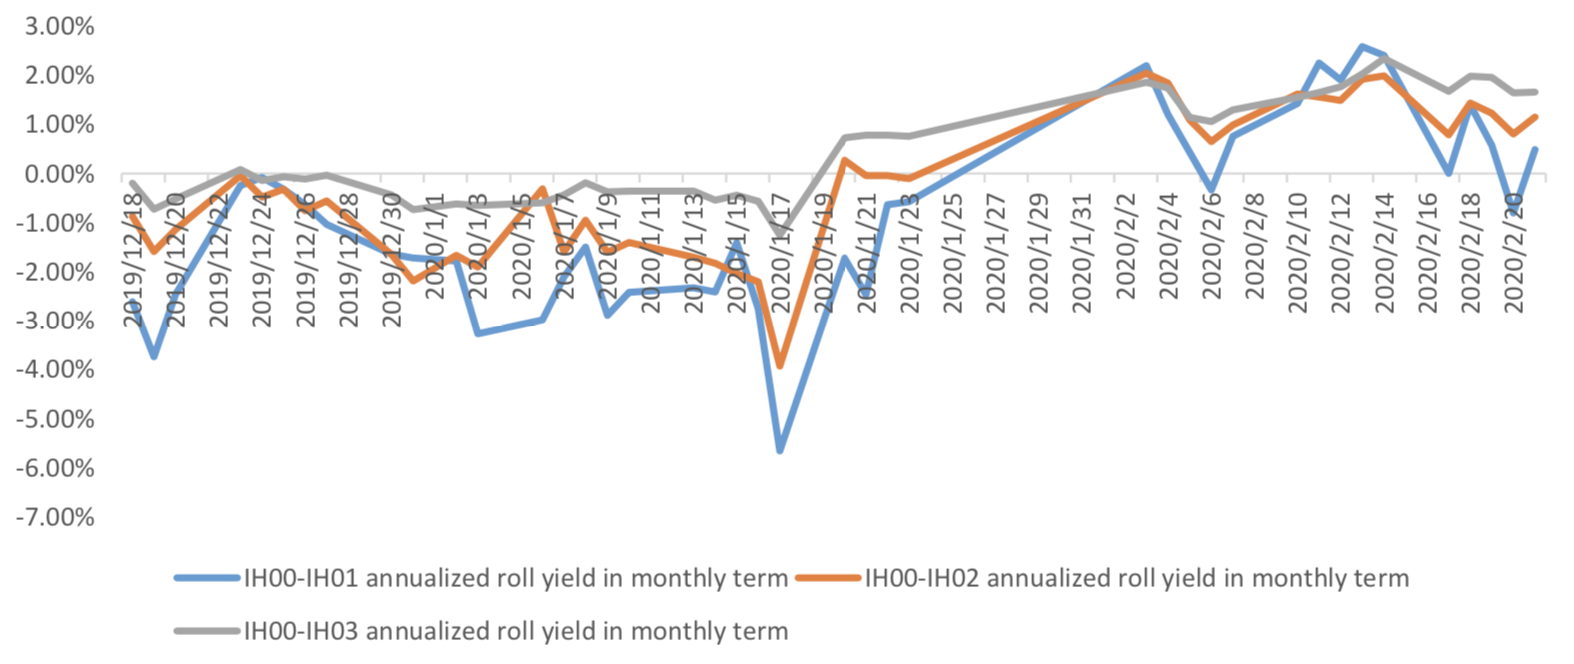
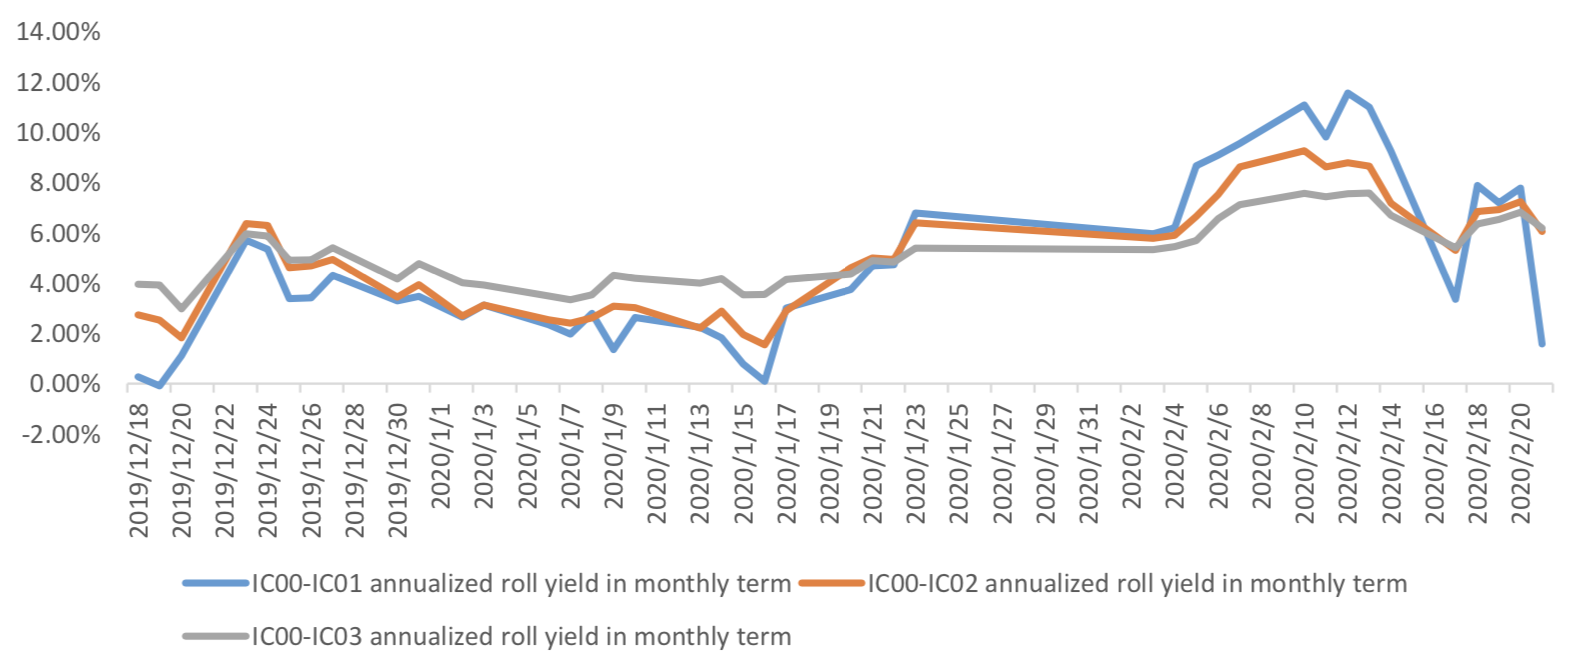
(4) Roll Spread of Stock Index Futures Tracking
Calculated as the contract price of the current month minus the contract price of the following month, for the long roll, the positive calculation results are gains, the negative calculation results are losses. Code 00 in the figure represents the current month contract, 01 the next month contract, 02 the current quarter contract, 03 the next quarter contract.
(a)IF
Up to2020/2/21,the best roll plan is IF00-IF03,annualized roll yield in monthly term is1.90%。
Graph 27: IF Current month contract roll yield comparison (index point)

Graph 28: IF Current month contract roll yield comparison (annualized return)

(b)IH
Up to 2020/2/21,the best roll plan is IH00-IH03,annualized roll yield in monthly term is1.66%。
Graph 29: IH Current month contract roll yield comparison (index point)

Graph 30: IH Current month contract roll yield comparison (annualized return)
(c)IC
Up to2020/2/21,the best roll plan isIC00-IC03,annualized roll yield in monthly term is6.19%。
Graph 31: IC Current month contract roll yield comparison (index point)

Graph 32: IC Current month contract roll yield comparison (annualized return)
(5) Basis Tracking of Stock Index Futures
For long side, if the base difference is positive, the change of the base difference brings losses, and if the base difference is negative, the change of the base difference brings profits.
(a)IF
For long side hedge, up to 2020/2/21, IF02 and IF03 was in discount, other IF contracts were in premium. Here IF next month contract basis return annualized yield is -2.63%。
Graph 33: IF contracts basis
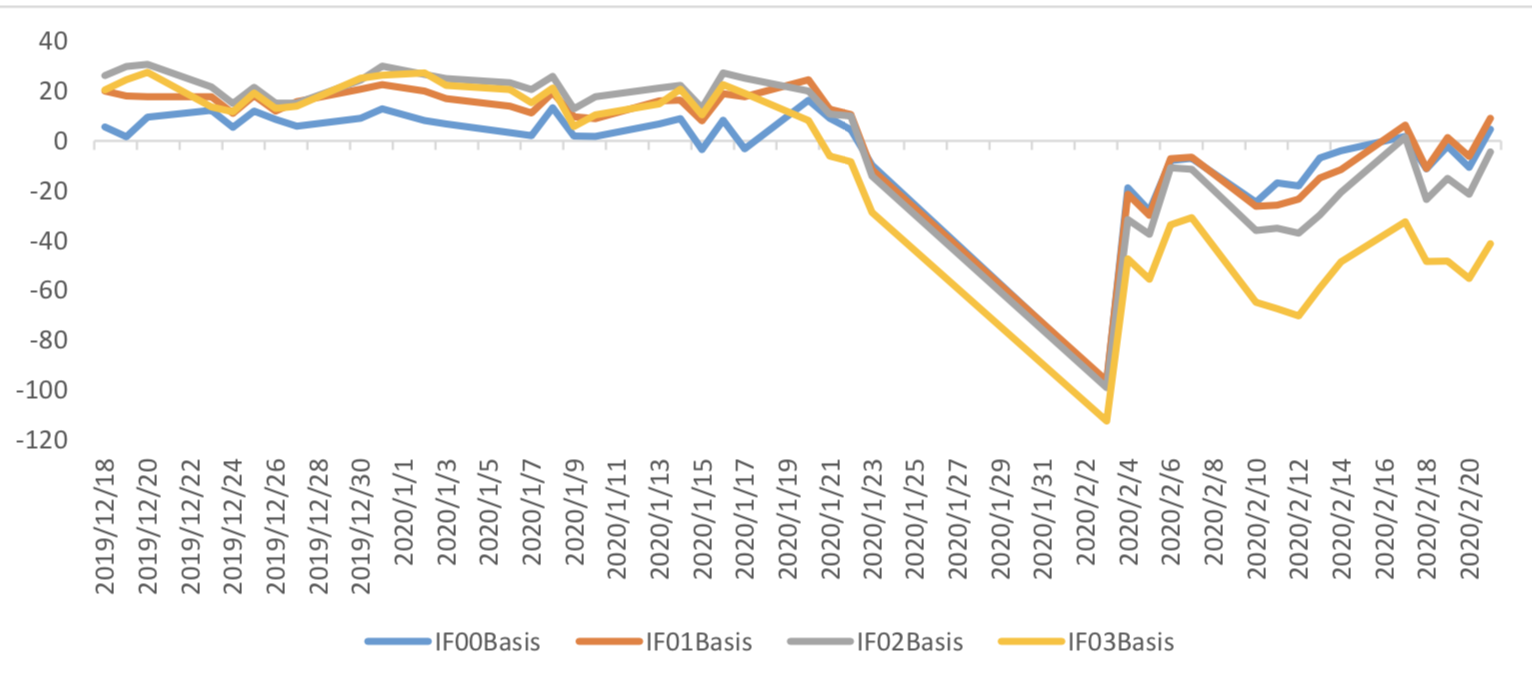
Table 1: IF basis return calculation

(b)IH
For long side hedge, up to 2020/2/21,IH02 and IH03 was in discount, other IH contracts were in
premium. Here IH next month contract basis return annualized yield is -0.59%。
Graph 34: IH contracts basis

Table 2: IH basis return calculation

(c)IC
For long side hedge, up to 2020/2/21, all IC contracts were in discount. Here IC next month contract
basis return annualized yield is 1.87%。
Graph 35: IC contracts basis

Table 3: IC basis return calculation

3. Financial Markets
(1) Interest Rates
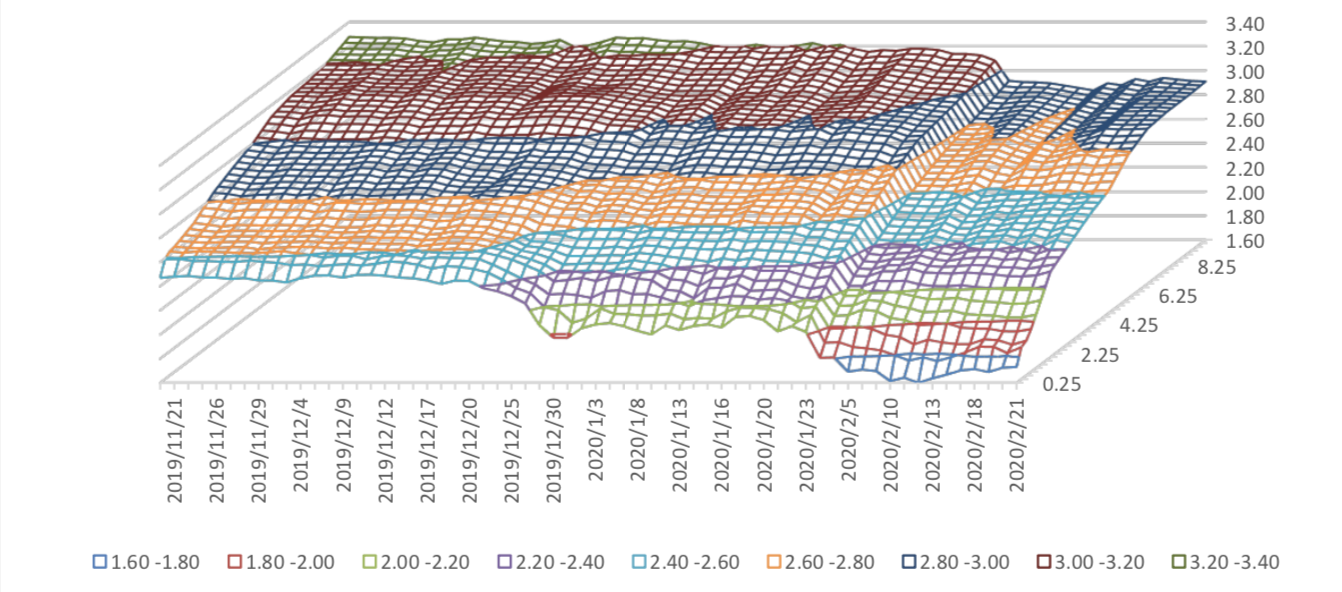
The term structure of treasury bonds’ yields is currently upward sloping in concave shape.
Specifically, last week, short-term yields short term yield of Treasury bond experienced some fluctuation and 3M yield now at 1.6%-1.8% level. Furthermore, as for long-term yield, there is a small drop. 10Y yield is about 2.8%-3.0%.
Graph 36: Term Structure Evolvement of Treasury Bonds Yields During Recent 3 Months (%)
As for Shibor rates, short-term rates experienced significant fluctuation. Specifically, O/N rate experienced obvious fluctuation to 1.2%-1.4% level.
Graph 37: Term Structure Evolvement of Shibor Rates During Recent 3 Months (%)

(2) ExchangeRates
During last week, CNY/USD changed 0.847% to 7.0386 and offshore rate, CNH/USD, changed 0.61% to 7.0357 and USD index changed 0.19%.
Graph 38: USD/CNY, USD/CNH and USD Index

Macroeconomic Topic:
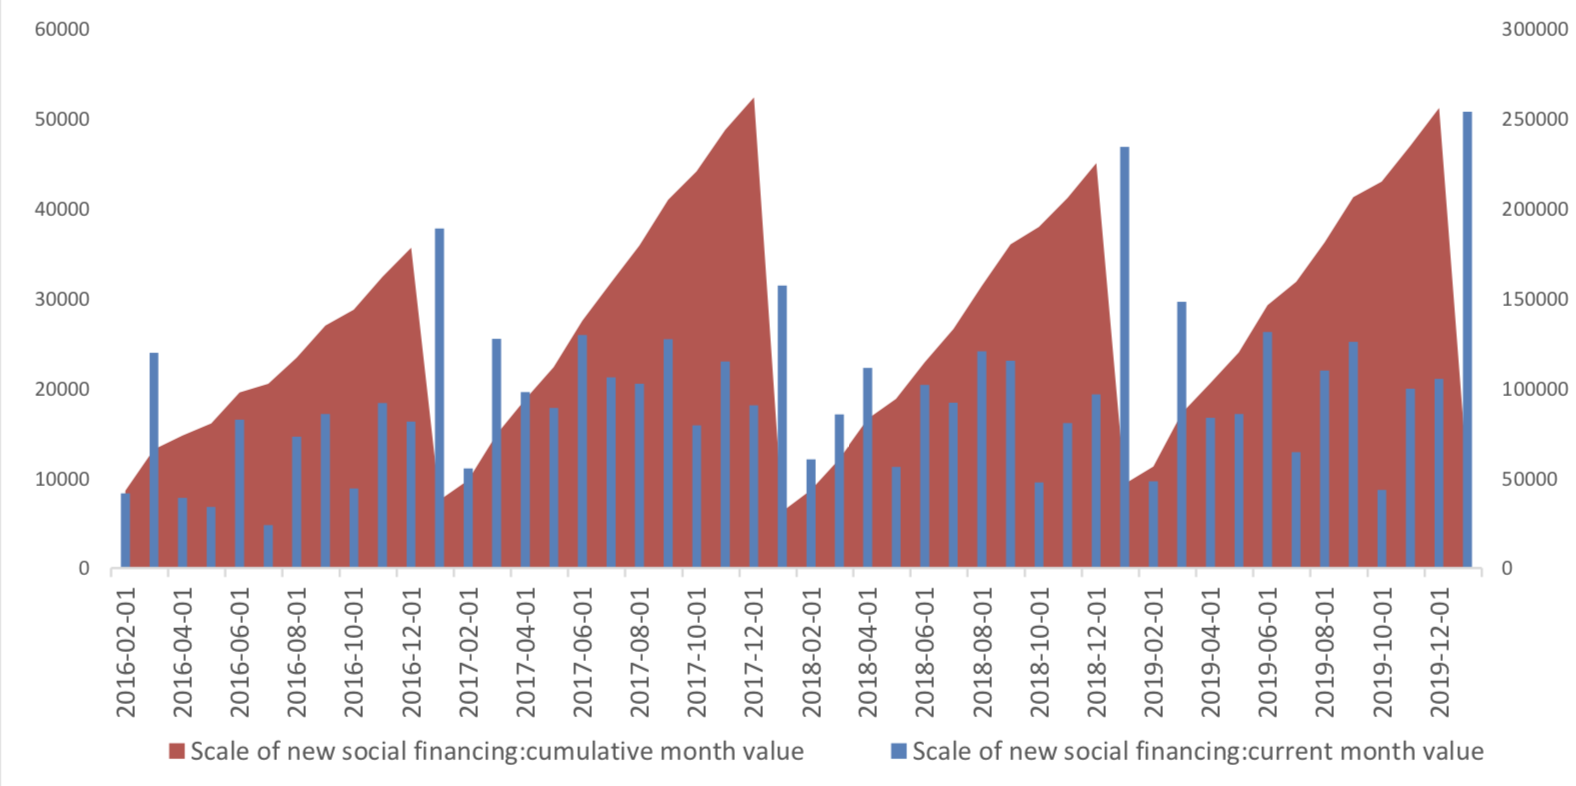
The data show that, in January, the scale of new social financing increased, reached 5070 billion yuan, up from 4679.114 billion yuan last year.
January Finance Data
(1) Social Financing Data
Graph A: Total Social Financing Data(100m RMB)
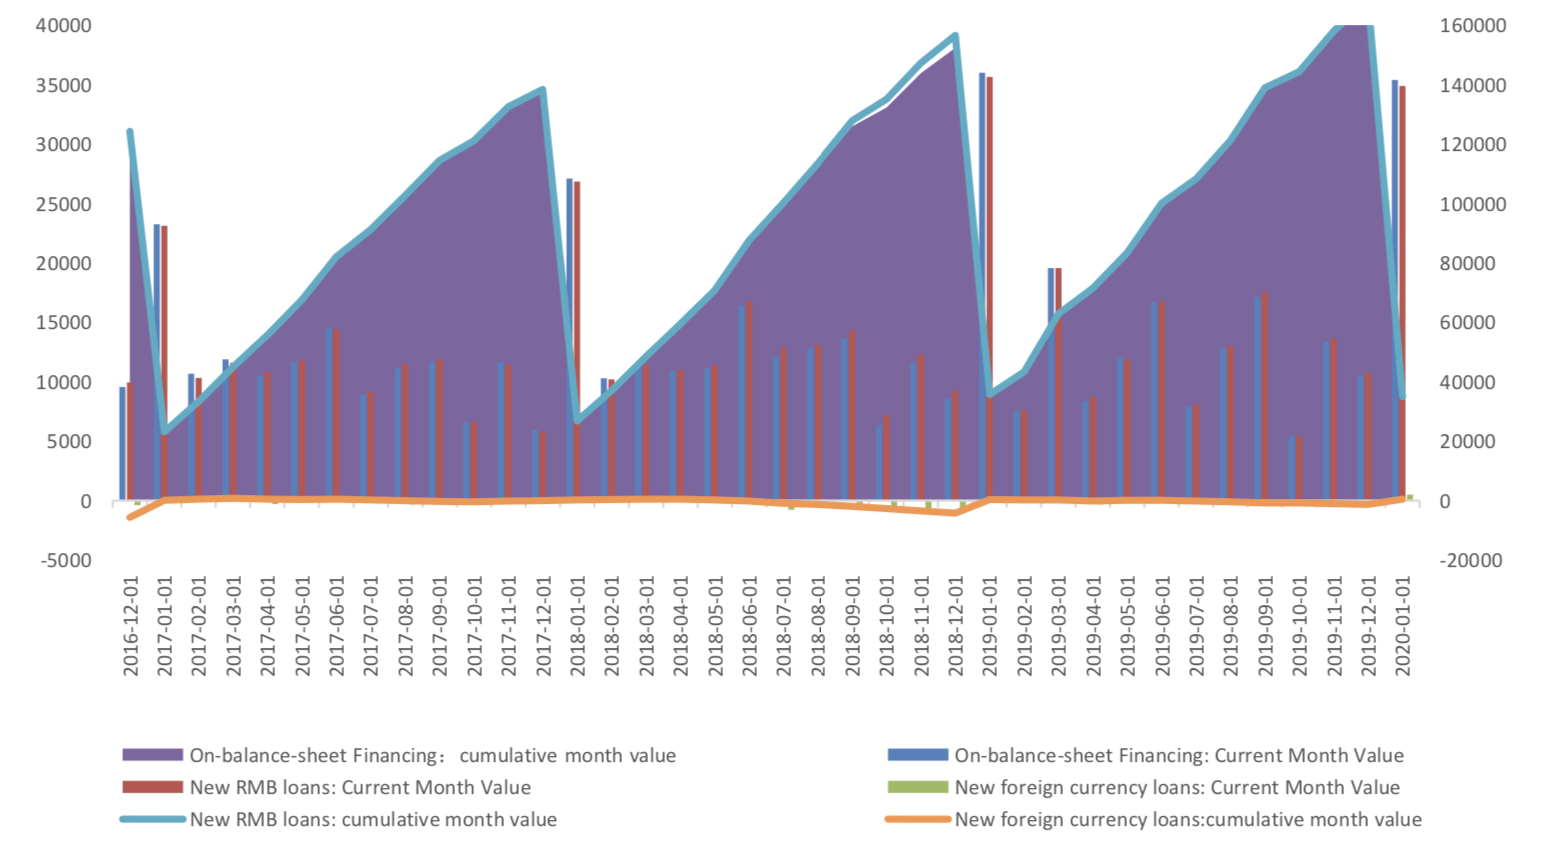
In on-balance-sheet financing, in terms of RMB loans, 3490 billion yuan was added in January, rose from 1076.9 billion yuan from last month, but lower than the value, 3566.8 billion, at the same period of last year. New RMB loans accounted for 68.8% of the new social financing scale.
Graph B: On-balance-sheet Financing Data(100m RMB)
From the perspective of new off-balance sheet financing, it still faced an obvious expansion in January.. In January it report 180.9 billion yuan, the previous value is – 145.5 billion yuan.
Graph C: Off-balance-sheet Financing Data(100m RMB)

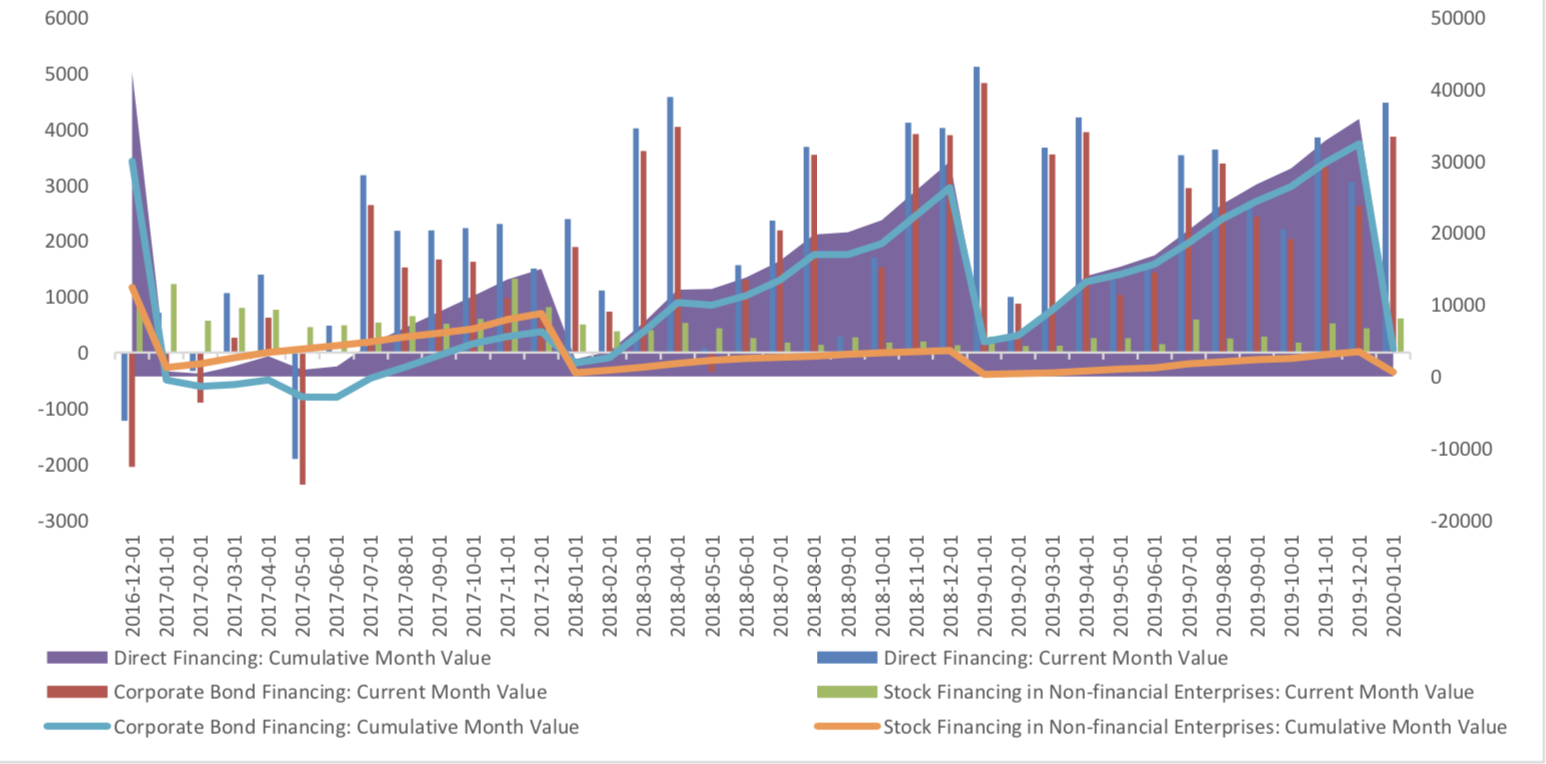
In terms of the direct financing, the direct financing of enterprises was 447.4 billion yuan, obviously lower compared with the same period last year, 511.8 billion, but with the ring ratio increased substantially, 46.3%, mainly because of the increase in corporate bond financing.
Graph D: Direct Financing Data(100m RMB)
(2) Monetary Data
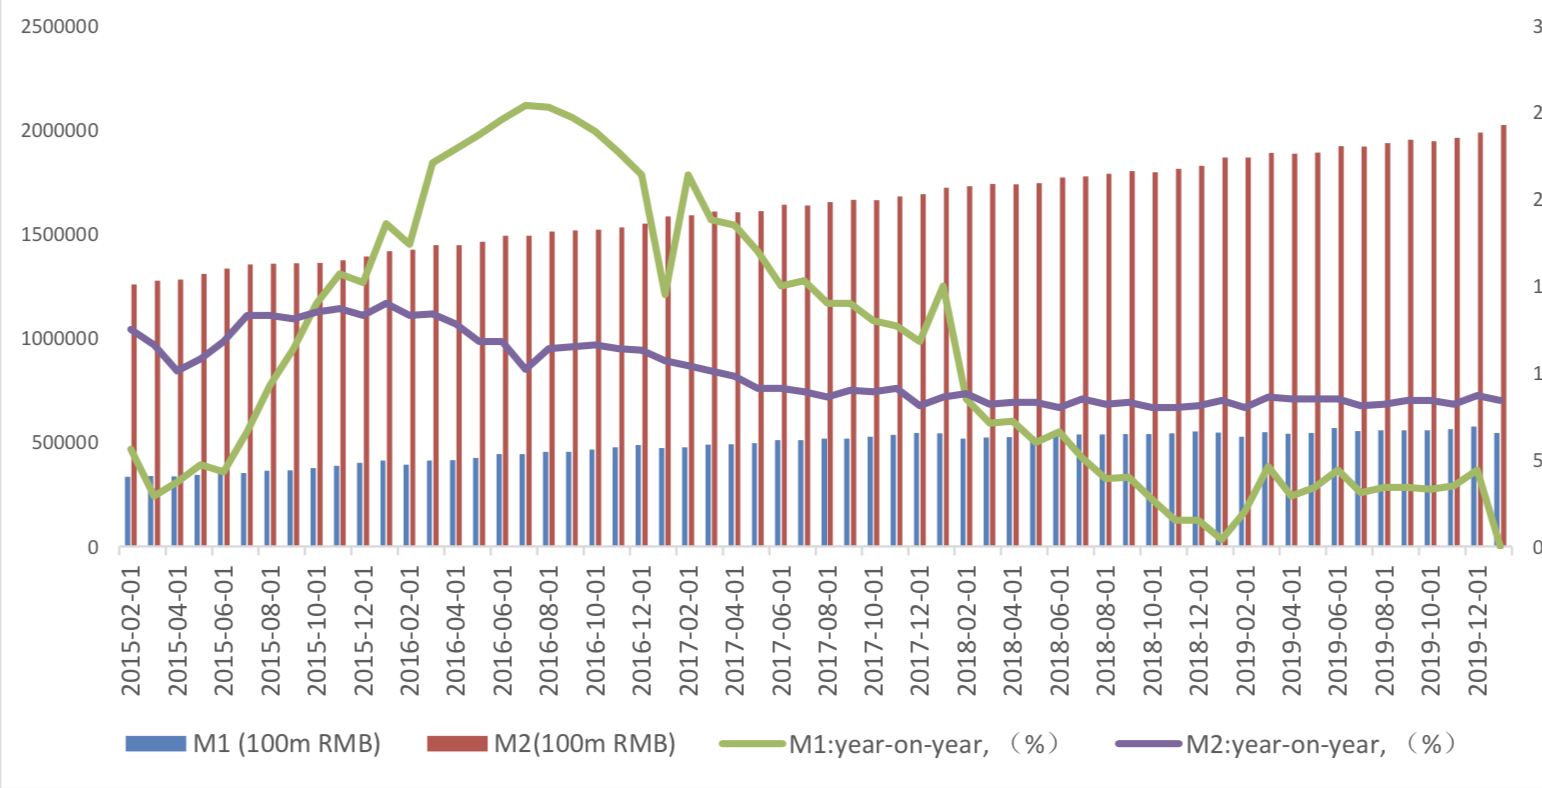
In January, M2 dropped to 8.4%, and M1 dropped from 4.4% to 0%, and the difference between M2 and M1 increase from 4.3% to 8.4%.
Graph E: M1 and M2 data
(3) Summary
The central bank released its fourth quarter monetary performance report. Although novel coronavirus epidemic situation has a limited downtown pressure on the economy and the scale of its impact on China's economy, the short-term impact is mainly on the reduction of consumption and the late recovery of enterprises. However, the central bank also believes that the domestic economy is in a period of adjustment, and the domestic economic downward pressure is greater. In addition, two new definitions have been added: "keep innovation and take responsibility". In counter cyclical regulation, monetary policy should play a greater role. It also emphasizes the role of reform in countercyclical regulation. In this context, the scale of new social financing is expected to accelerate the recovery driven by new RMB loans, new local special bonds and new direct financing.
Currently no Comments.
Hot Topics
The 13rd China International Future Forum
The Shanghai Derivatives Energy Forum has received extensive attention from relevant industries both within and outside the borders.
Financial institutions deep explore commodity market opportunities, commodity index financial products show full-scale trend
R-Code for analysis: getKDJ
R-Code@June 06, 2016
New indicator to analyze the arbitrage opportunities between sse50 and csi500
Market review: January 11, 2017
The Great China Bubble: Anniversary Lessons and Outlook
Quant Investment in China A-share market
The hedge strategy between SSE50 and A50--Jan 13,2017
The arbitraging strategy between CSI300 and SSE50
Market review: June 17, 2016
Sleepless in London--Enda Homan(Allied Irish Banks Plc)
MSCI Rebuffs Chinese Equities for Third Time in Blow to Xi
Soros, Druckenmiller among hedgies profiting in market plunge