FangQuant › Financial Futures
Market Summary:
Last week, there was generally decrease over the market. Shanghai SE Composite Index (000001.SH) changed -5.24 % to 2880.30. Specifically, large cap shares perform better than small cap shares and we can observe that SSE50 did better than CSI500 (-4.96% vs -5.75%). The average daily turnover of the whole market during past 5 trading days is 1226.03 billion CNY, it increased 17.54% compared with the previous 5- trading day period.
During the week, the epidemic situation still shows a sign of further controlling in China, with new increase far less, especially outside Wuhan. However, the global situation is getting worse. In Korea, Japan, Italy, the confirmed cases experienced explosive increase, and more countries reported the first case. This greatly increased the uncertainty of the market.
As for arbitrage opportunity, CSI300 and CSI500 futures current-month contracts show some room for arbitrage opportunities. No price spread for next-month/current month contracts show room for arbitrage.
News:
1. The joint prevention and control mechanism of the State Council issued a notice to further guide the implementation of differentiated prevention and control strategies at different levels. Hubei Province and Wuhan city should comprehensively strengthen the prevention and control of the epidemic, continue to implement strict control measures for the channel from Han to Hubei, and resolutely curb the spread and output of the epidemic. Beijing should do a good job in epidemic prevention and control in accordance with the strategy of "external input and internal non-proliferation". The neighboring provinces of Hubei Province should take the initiative to establish the inter provincial joint defense and control mechanism with Hubei Province, not only to prevent the epidemic from spreading to the surrounding provinces, but also to do a good job in material and personnel assistance and transportation guarantee for Hubei Province.
2. In February, the official manufacturing PMI of China was 35.7, with a top value of 50; in February, the non manufacturing PMI was 29.6, with a top value of 54.1, indicating that the overall non manufacturing economy dropped significantly under the impact of the epidemic. Novel coronavirus pneumonia index was significantly lower in February, but China's recovery rate is rising faster, and production and business activities are recovering in an orderly manner, which will push the purchasing managers' index up in March, the Bureau said.
3. The Ministry of Finance and the State Administration of Taxation clearly support the VAT policy of individual industrial and commercial households returning to work: from March 1 to May 31, small-scale VAT payers in Hubei Province are exempt from VAT by applying the taxable sales revenue with a 3% collection rate; the VAT projects with a 3% pre collection rate are applied, and the VAT in advance is suspended; the VAT in other regions is levied at a 1% reduction rate.
4. The general office of the State Council issued the notice on the implementation of the revised Securities Law: fully understand the significance of the revision of the securities law, steadily promote the registration system of public issuance of securities, punish illegal securities crimes in accordance with the law, strengthen the protection of the legitimate rights and interests of investors, and accelerate the liquidation and improvement of relevant rules and regulations.
5. CSRC solicits public opinions on the provisions on the record management of securities service institutions engaging in securities service business. There are 20 provisions on filing, which mainly stipulate the filing subject, filing scope, filing time point and filing procedure. It is clear that the filing of securities service institutions belongs to the legal nature of "post filing" and "informative filing". It does not set pre-set conditions for securities service institutions to engage in securities service business.
6, China Daily: on the afternoon of February 29th, President Trump and vice president Burns and CDC officials attended the conference to announce the latest situation and prevention of the new crown pneumonia in the United States. The main points are as follows: 1. 2. Travel restrictions have been imposed on Iran, banning foreigners from entering or leaving the country in the past 14 days. Set travel warnings for South Korea and Italy to the highest level. 3. The risk of the new coronavirus to the American public is still very low, and the American public can live a normal life. 4. Ordinary people don't need to buy masks. At present, there are 43 million masks in the United States, which are communicating with medical material manufacturers to guarantee the supply. 5. The Federal Reserve is of great importance. It should take action in time when it needs to cut interest rates. 6. China has made progress in the epidemic, with a sharp drop in cases. The joint response to the new coronavirus has made the relationship between the two countries closer.
7. The people's Daily reported that as of 24:00 on February 29, 31 provinces (autonomous regions, municipalities directly under the central government) and Xinjiang production and Construction Corps had reported 41625 discharged cases and 79824 confirmed cases. The cumulative number of cases cured and discharged accounted for 52.1% of the total confirmed cases, accounting for more than half.
8. Securities Times: World Health Organization: as of 10:00 a.m. Central European time (17:00 Beijing time on 29th), 6009 cases were confirmed outside China.
1. StockMarket
(1) Indices Performance
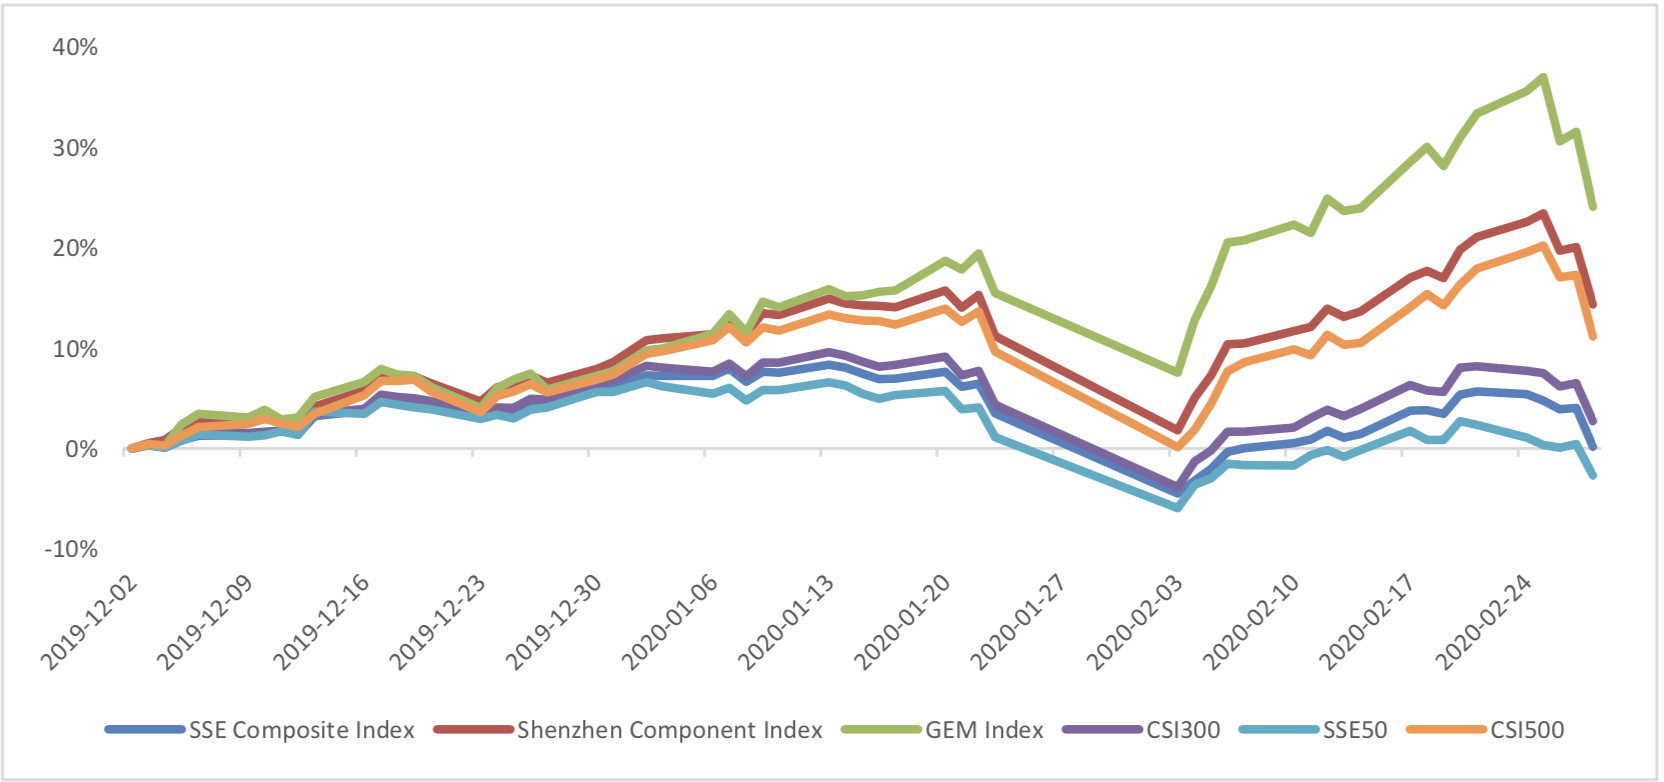
During last week, Shanghai SE Composite Index (000001.SH) changed -5.24 % to 2880.30, Shenzhen Component Index (399001.SZ) changed -5.58 % to 10980.77, ChiNext Price Index (399006.SZ) changed - 6.96 % to 2071.57, CSI 300 INDEX (000300.SH) changed -5.05 % to 3940.05, CSI SmallCap 500 index (000905.SH) changed -5.75 % to 5451.29, SSE 50 Index (000016.SH) changed -4.96 % to 2821.04.
Graph 1: Indices Performance over past 3 months
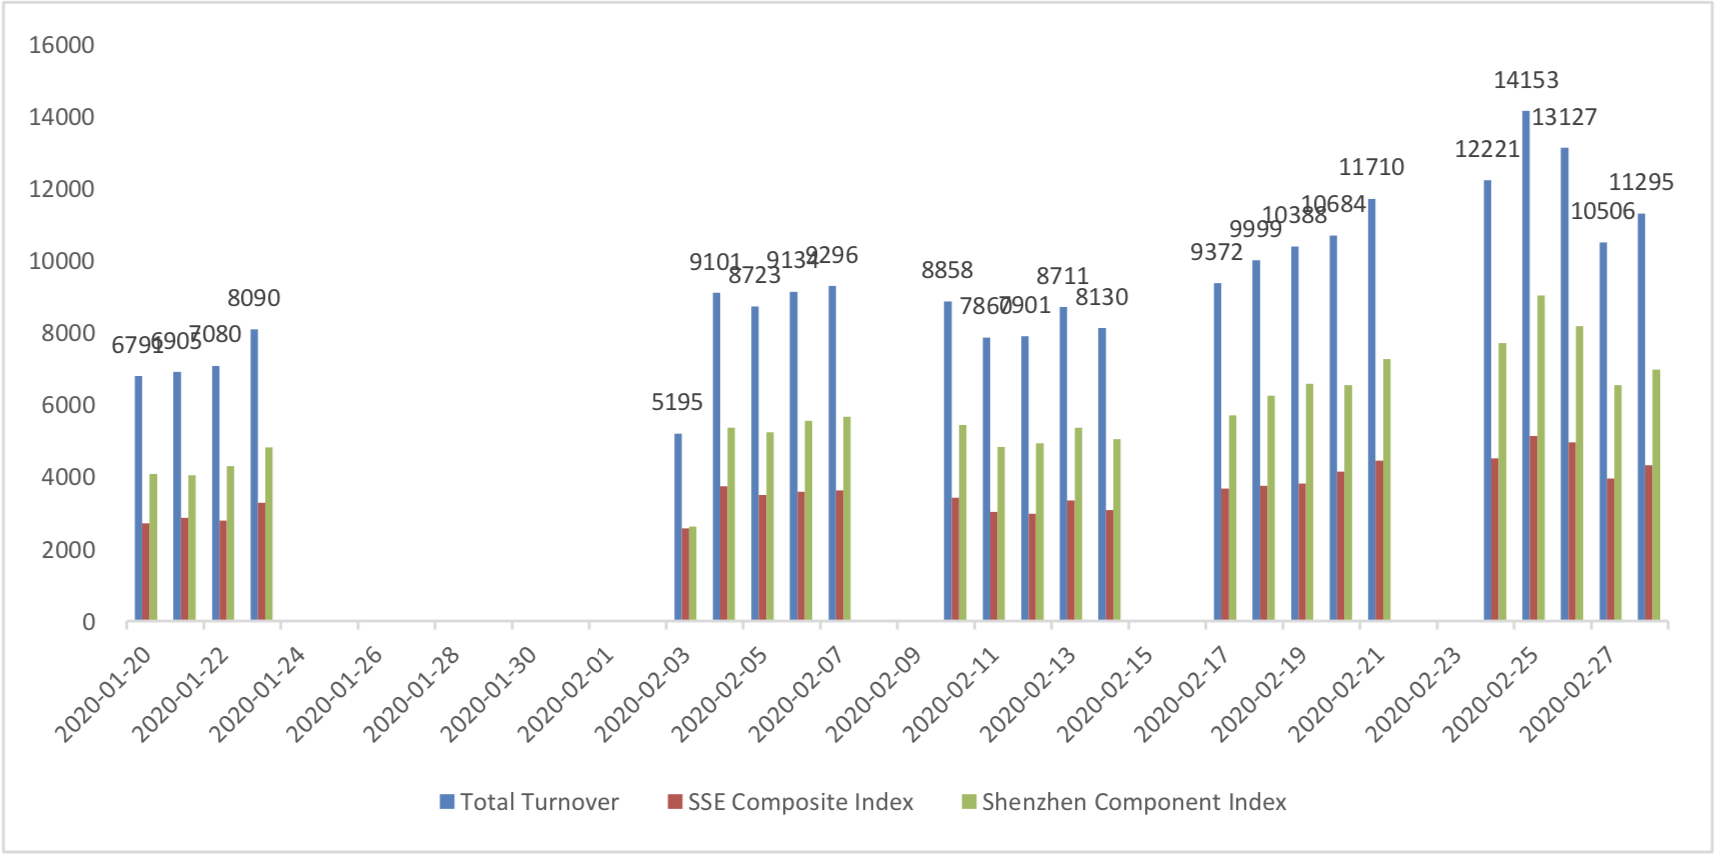
The average daily turnover of the whole market during past 5 trading days is 1226.03 billion CNY, it increased 17.54% compared with the previous 5-trading day period.
Graph 2: Market turnover
(2) Sectors Performance
In the view of sectors, during last week (from 2020-02-21 to 2020-02-28), 1 of 24 Wind Level-2 sector(s) increased while 23 sector(s) dropped. Specifically, Telecommunication Services (1.05%), Health Care Equipment & Services(-0.81%) and Commercial & Professional Services(-2.78%) did the best
performance while Semiconductors & Semiconductor Equipment (-8.91%), Diversified Financials(-7.21%) did the worst performance.
Graph 3: Sectors performance under Wind Level-2 classification (%)
(3) Indices Valuation (TTM)
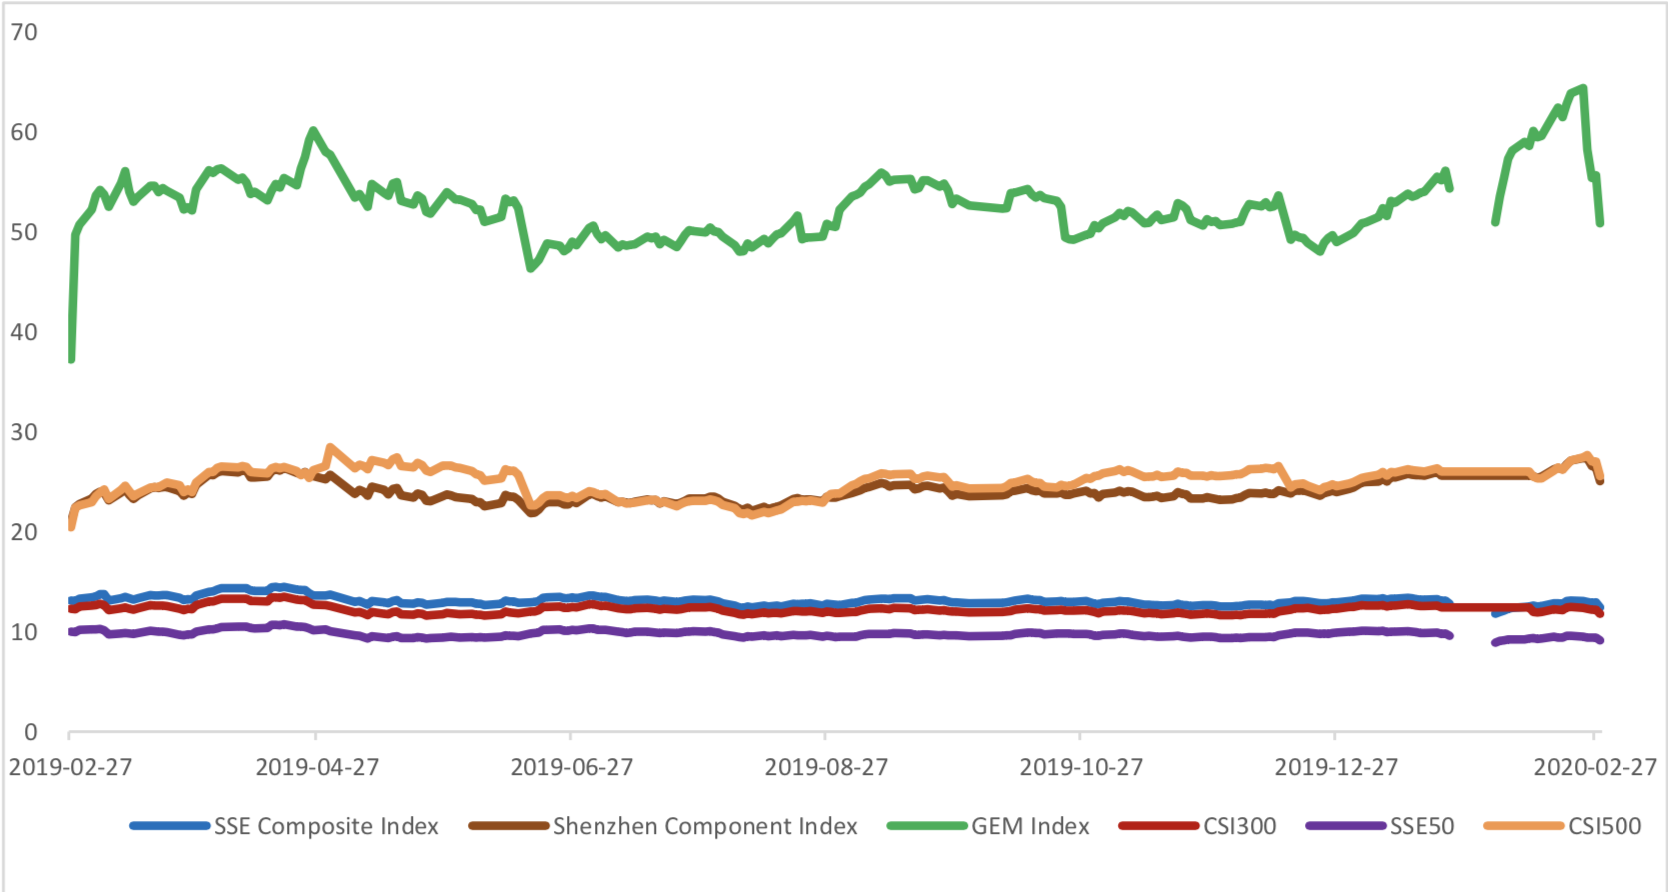
The current PE for SSE Composite Index, Shenzhen Component Index, GEM Index, CSI300, SSE50, CSI500 are 12.4414, 25.0658, 50.8516, 11.7710, 9.1264, 25.5552respectively; and these indices are at 10.90%, 35.80%, 58.80%, 19.80%, 7.40%, 27.10% percent rank level of their historic data, respectively
Graph 4: PE of 6 indices
Graph 5: PE percent rank of 6 indices (calculated by data of past 1200 trading days, only 1Y data is presented on the graph)
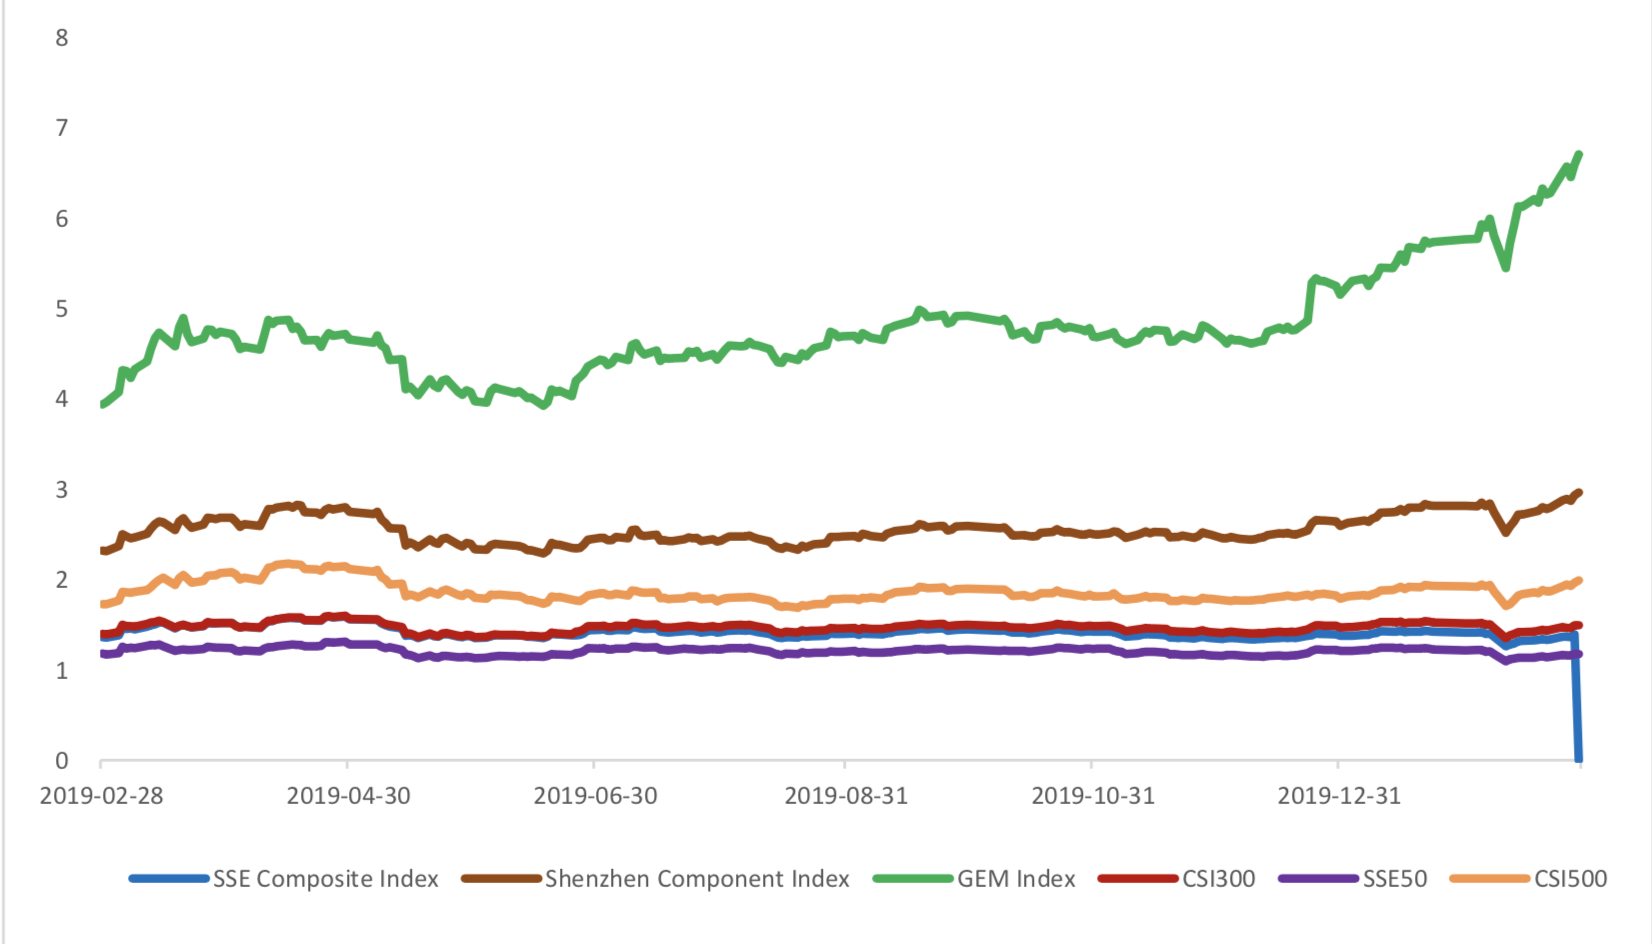
The current PB for Shenzhen Component Index, GEM Index, CSI300, SSE50, CSI500 are 2.9605,6.7025,1.4914,1.1715, 1.9887 respectively, and these indices are at #VALUE!, 44.30%, 80.60%, 46.50%, 21.60%, 30.60% percent rank level of their historic data, respectively.
Graph 6: PB of 6 indices


Graph 7: PB percent rank of 6 indices (calculated by data of past 1200 trading days, only 1Y data is presented on the graph)

(4) Foreign Fund Flow
During last 5 trading days the total foreign fund flow via Stock Connect is -29.34 billion RMB, and the cumulative inflows was 1043.45 billion RMB. Specifically, the fund flow via Shanghai-Hong Kong Stock Connect is -15.44 billion RMB and the fund flow via Shenzhen-Hong Kong Stock Connect is -13.90 billion RMB.
Graph 8: Fund flow via both Shanghai and Shenzhen-Hong Kong Stock Connect in past 1M (100 million CNY)

Graph 9: Fund flow via Shenzhen-Hong Kong Stock Connect in past 1M (100 million CNY)
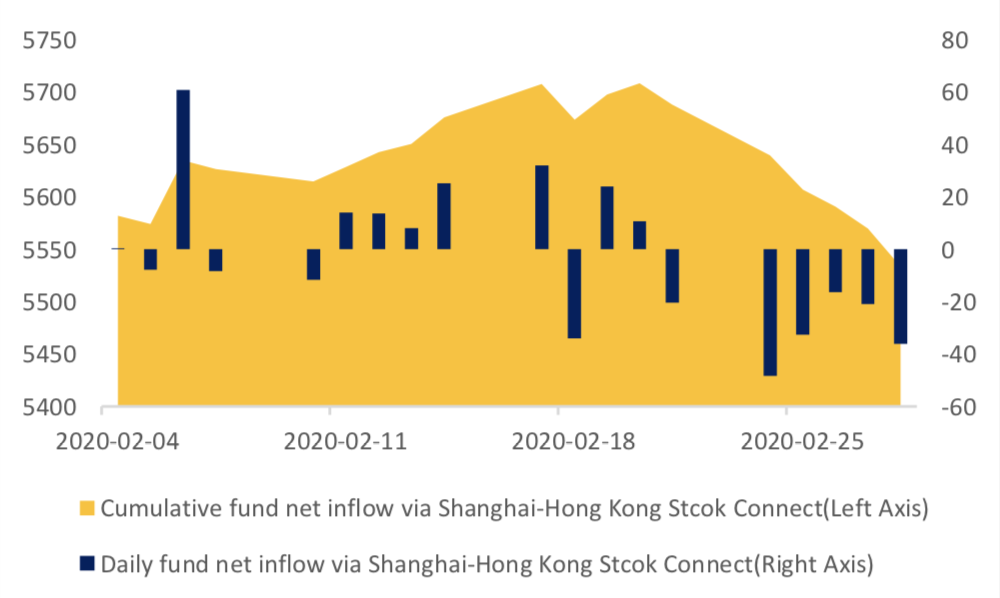
Graph 10: Fund flow via both Shanghai-Hong Kong Stock Connect in past 1M (100 million CNY)

(5) Margin Trading
According to the newest data, the margin financing balance is 967.84 billion, securities borrowing is
13.47 billion, totally 981.31 billion.
Graph 11: Margin Trading(100m RMB)

2. Index Futures
(1) Trading Volume and Open Interests
During past 5 trading days the average trading volume for CSI300(IF), SSE50(IH), CSI500(IC) contracts
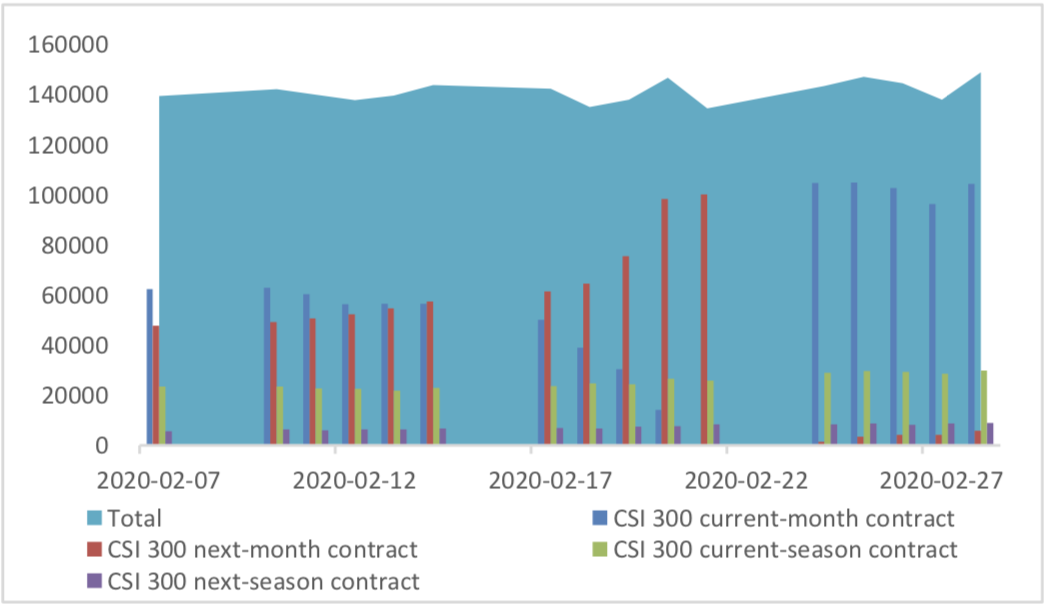
are 133003 (10.54%, the previous 5-trading day period),46633 (12.92%),187185 (29.33%) lots, respectively. On the last trading day, the total open interests for them are 148875 (10.63%),71640 (18.53%),203273 (11.92%) lots respectively.
Graph 12: CSI300 Index futures’ trading volume
Graph 13: CSI300 Index futures’ open interests
Graph 14:SSE50 Index futures’ trading volume
Graph 15: SSE50 Index futures’ open interests
Graph 16: CSI500 Index futures’ trading volume
Graph 17: CSI500 Index futures’ open interests
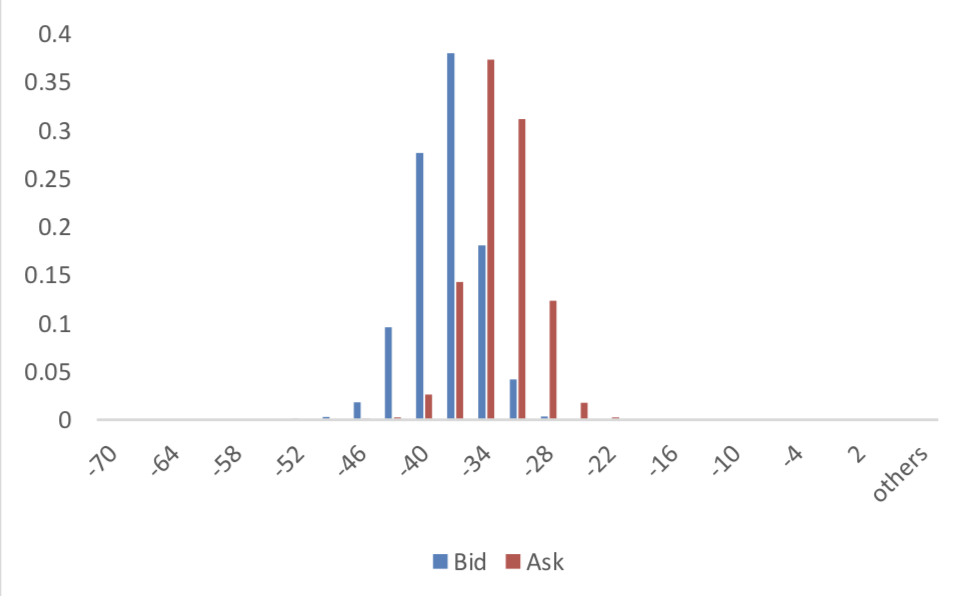
(2) Roll Level Bid-Ask Distribution Worked form last 3 trading days.
Graph 18: CSI300 Current/Next Month Contract Roll Spread Distribution (2s frequency)
Graph 19: SSE50 Current/Next Month Contract Roll Spread Distribution (2s frequency)


Graph 20: CSI500 Current/Next Month Contract Roll Spread Distribution (2s frequency)
(3) Weekly Review of Future/Spot Arbitrage Opportunity
Assumption: risk-free rate: 3%; security borrowing cost: 8%; trading expense for spot: 0.025%; trading expense for futures: 0.005%; margin rates for futures contracts: 0.11 for CSI300 and SSE50, 0.13 for CSI500; margin rate for security borrowing: 0.3 (or 130% maintain rate).
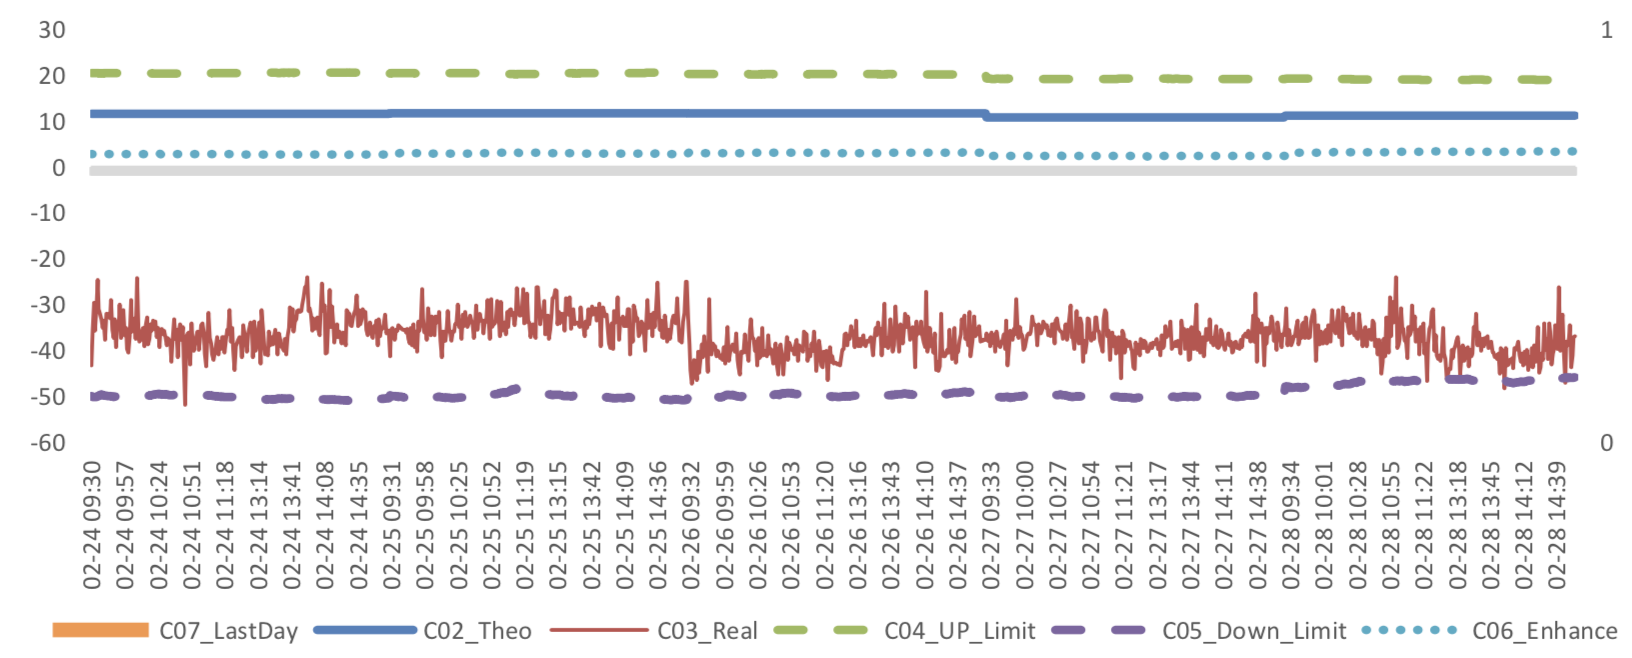
When real price spread is out of theoretical range (calculated by our assumption), there exists absolute future-spot arbitrage opportunity.
Graph 21: Future (Current Month)-Spot Arbitrage Opportunity for CSI300 contract (in the view of price difference)
Graph 22: Future (Current Month)-Spot Arbitrage Opportunity for SSE50 contract (in the view of price difference)
Graph 23: Future (Current Month)-Spot Arbitrage Opportunity for CSI500 contract (in the view of price difference)
Graph 24: Future (Next Month-Current Month) Arbitrage Opportunity for CSI300 contract (in the view of price difference)
Graph 25: Future (Next Month-Current Month) Arbitrage Opportunity for SSE50 contract (in the view of price difference)
Graph 26: Future (Next Month-Current Month) Arbitrage Opportunity for CSI500 contract (in the view of price
difference)
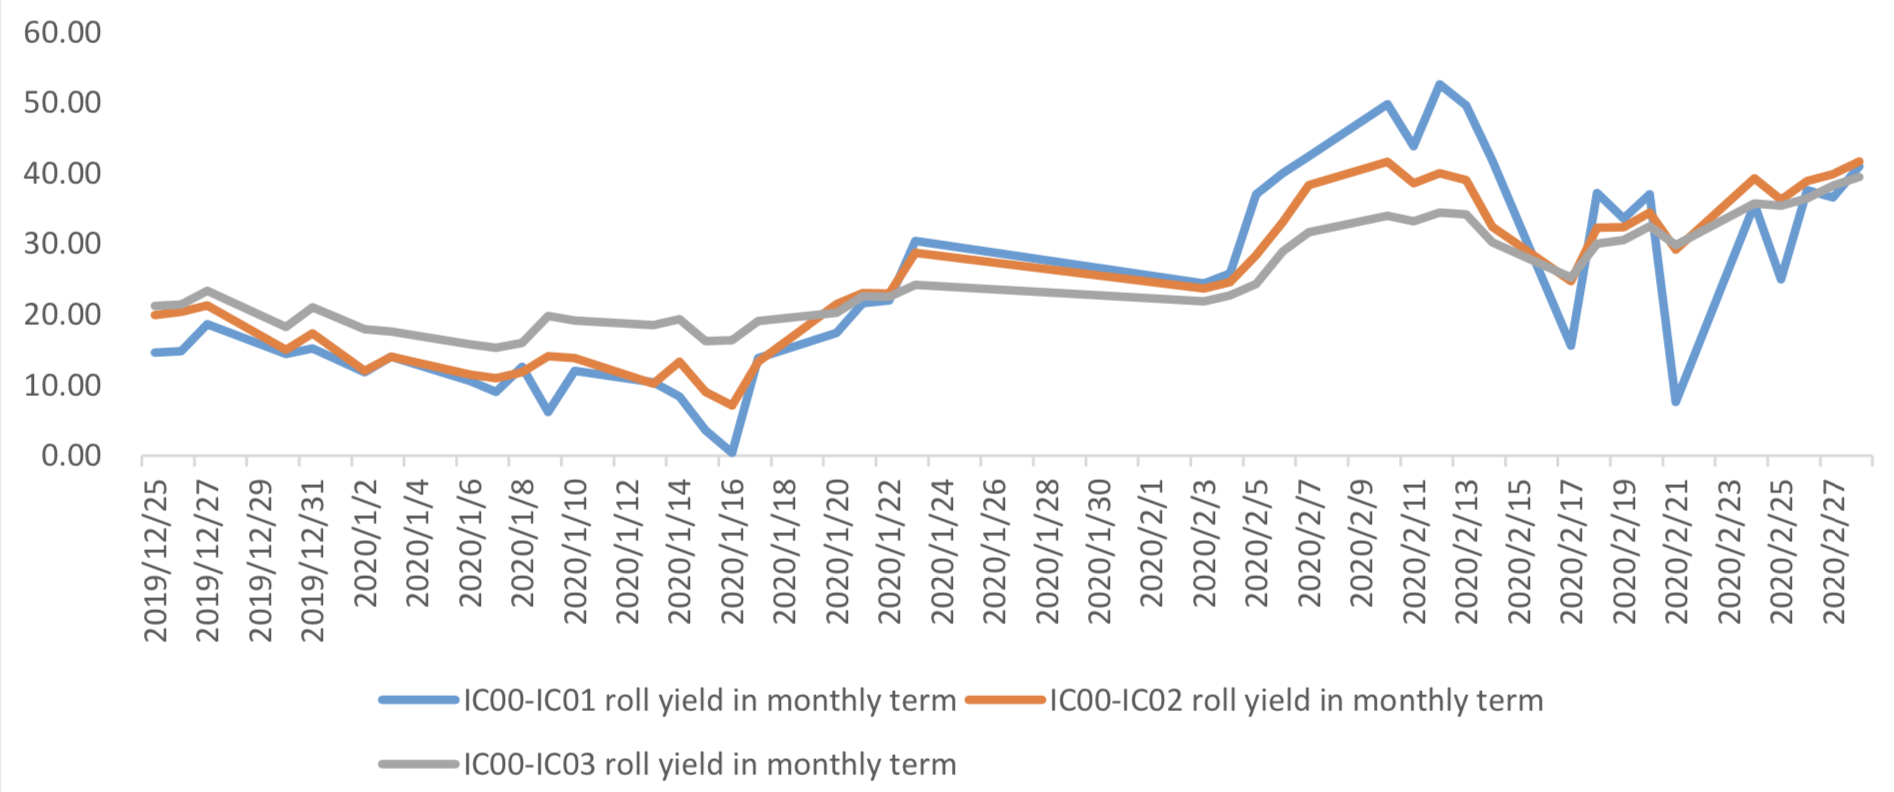
(4) Roll Spread of Stock Index Futures Tracking
Calculated as the contract price of the current month minus the contract price of the following month, for the long roll, the positive calculation results are gains, the negative calculation results are losses. Code 00 in the figure represents the current month contract, 01 the next month contract, 02 the current quarter contract, 03 the next quarter contract.
(a)IF
Up to2020/2/28,the best roll plan is IF00-IF03,annualized roll yield in monthly term is2.64%。
Graph 27: IF Current month contract roll yield comparison (index point)
Graph 28: IF Current month contract roll yield comparison (annualized return)
(b)IH
Up to 2020/2/28,the best roll plan is IH00-IH03,annualized roll yield in monthly term is2.84%。
Graph 29: IH Current month contract roll yield comparison (index point)
Graph 30: IH Current month contract roll yield comparison (annualized return)
(c)IC
Up to2020/2/28,the best roll plan isIC00-IC02,annualized roll yield in monthly term is9.17%。
Graph 31: IC Current month contract roll yield comparison (index point)
Graph 32: IC Current month contract roll yield comparison (annualized return)
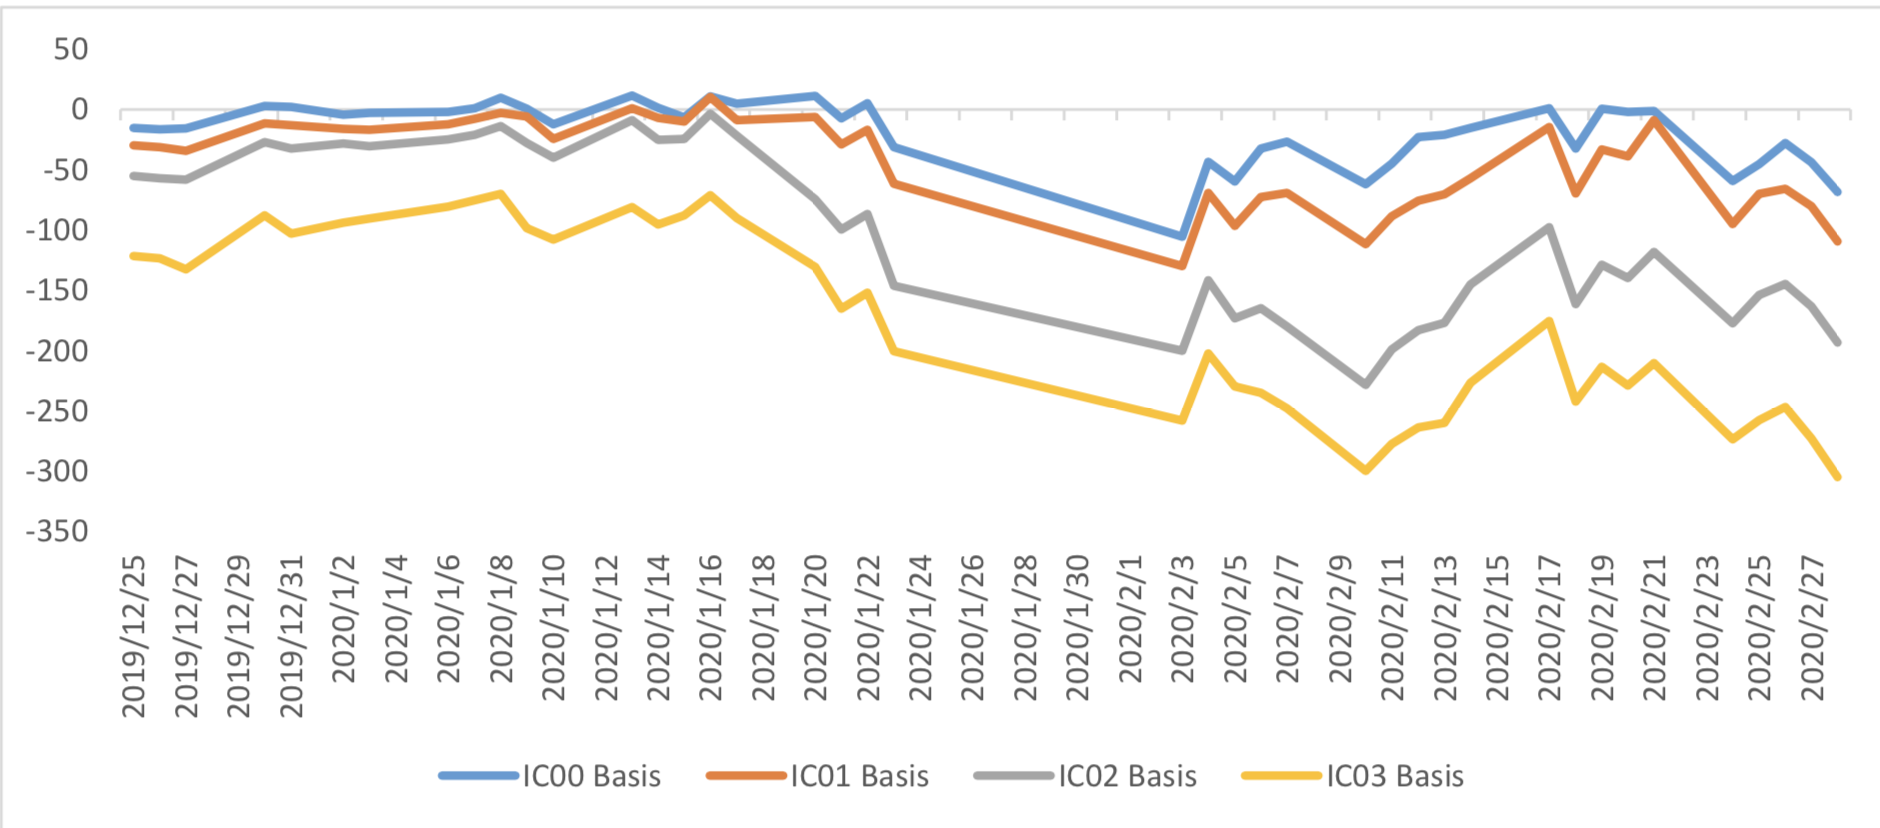
(5) Basis Tracking of Stock Index Futures
For long side, if the base difference is positive, the change of the base difference brings losses, and if the base difference is negative, the change of the base difference brings profits.
(a)IF
For long side hedge, up to 2020/2/28, all IF contracts were in discount. Here IF next month contract basis return annualized yield is 3.81%。
Graph 33: IF contracts basis
Table 1: IF basis return calculation
(b)IH
For long side hedge, up to 2020/2/28,all IH contracts were in discount. Here IH next month contract
basis return annualized yield is 0.26%。
Graph 34: IH contracts basis
Table 2: IH basis return calculation
(c)IC
For long side hedge, up to 2020/2/28, all IC contracts were in discount. Here IC next month contract
basis return annualized yield is 14.15%。
Graph 35: IC contracts basis
Table 3: IC basis return calculation
3. Financial Markets
(1) Interest Rates
The term structure of treasury bonds’ yields is currently upward sloping in concave shape.
Specifically, last week, short-term yields short term yield of Treasury bond experienced some fluctuation and 3M yield now at 1.6%-1.8% level. Furthermore, as for long-term yield, there is a small drop. 10Y yield is about 2.8%-3.0%.
Graph 36: Term Structure Evolvement of Treasury Bonds Yields During Recent 3 Months (%)
As for Shibor rates, short-term rates experienced significant fluctuation. Specifically, O/N rate experienced obvious fluctuation to 1.2%-1.4% level.
Graph 37: Term Structure Evolvement of Shibor Rates During Recent 3 Months (%)
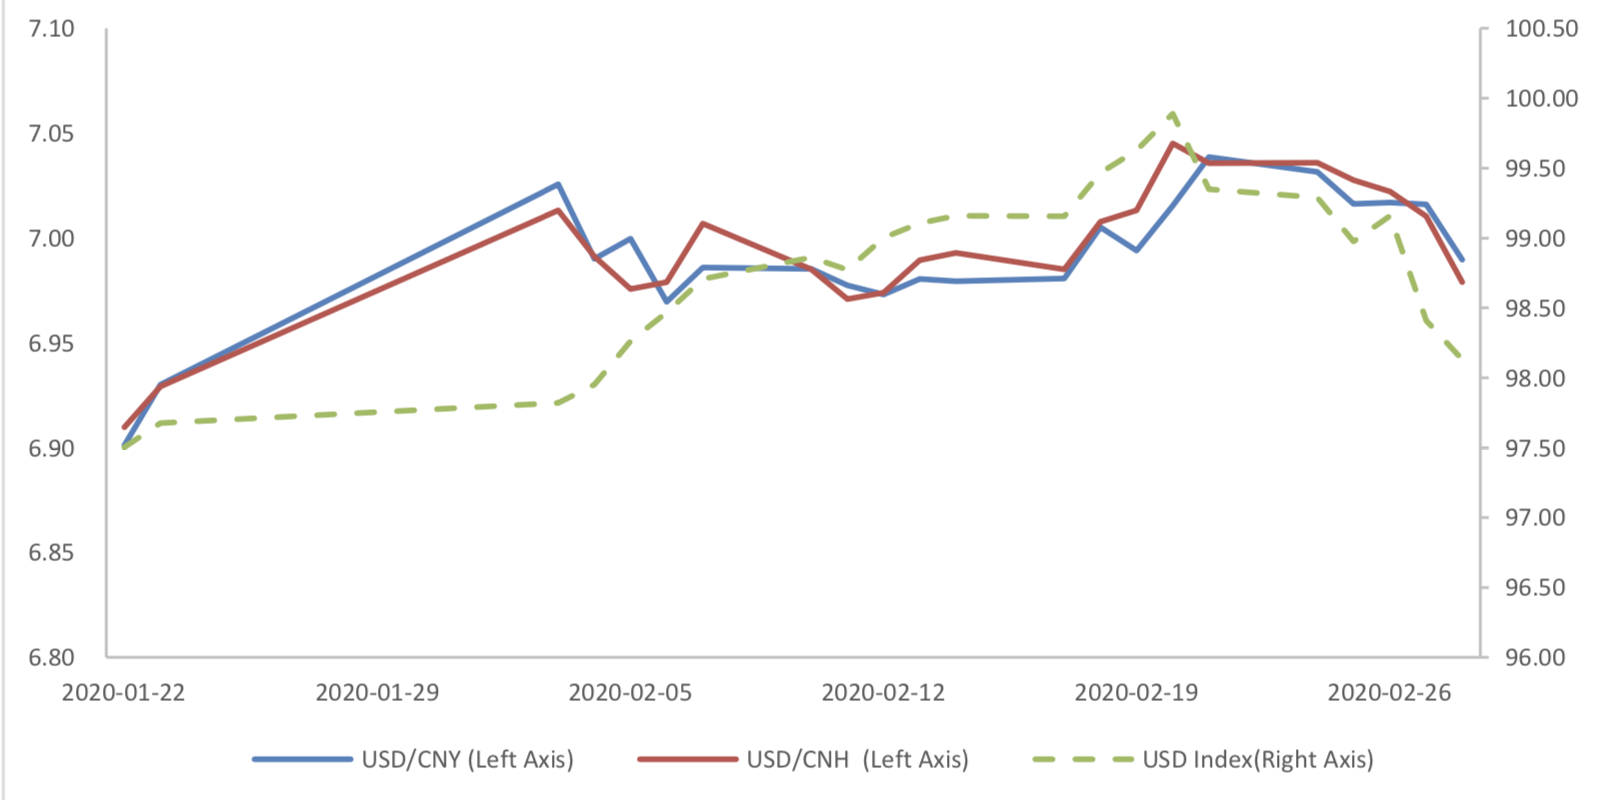
(2) ExchangeRates
During last week, CNY/USD changed -0.696% to 6.9896 and offshore rate, CNH/USD, changed - 0.81% to 6.9789 and USD index changed -1.22%.
Graph 38: USD/CNY, USD/CNH and USD Index
Macroeconomic Topic:
On 2020/2/29, the February PMI data was released. The data showed PMI in February dropped dramatically. The manufacturing PMI was 35.7 percent, with pre-value of 50.0 percent. The non- manufacturing PMI was at 29.6 percent, with pre-value of 54.1percent, while the composite PMI was at 28.9 percent, with pre-value of 53.0 percent.
February PMI Data
Graph A: PMI Data 60
(1) About 5 Sub-indexes for manufacturing PMI calculation
From the point of view of 5 sub-indexes: (1) the decrease of PMI: new orders is a major force to drags manufacturing PMI. It was reported at 29.3%, back to contraction zone, with preceding value of 51.4% and it drags PMI for 6.63 percentage points. (2) The decrease of PMI: production is another major force to drag manufacturing PMI. It was reported at 27.8%, back to contraction zone, with preceding value of 51.3% and it drags PMI for 5.88 percentage points. (3) The decrease of PMI: employees is another force to drags manufacturing PMI. It was reported at 31.8%, still in contraction zone, with preceding value of 47.5% and it drags PMI for 3.14 percentage points. (4) The decrease of PMI: raw material storage, gave another force to drag manufacturing PMI. It was reported at 33.9%, still in contraction zone, with preceding value of 47.1% and it drags PMI for 1.32 percentage points. (5) The dropping of PMI: delivery time of supplier, is the only force to promote manufacturing PMI. It was reported at 32.1%, still in expansion zone, with preceding value of 49.9% and it promotes PMI for 2.67 percentage points.
Graph B: PMI 5 sub-indexes
Graph C: PMI Change Contribution by 5 Sub-indexes
(2) About 8 Sub-indexes not for manufacturing PMI calculation
1 of 8 sub-indexes are above 50, in expansion zone and the remaining indexes are in contraction zone.
Graph D: PMI for 8 Sub-indexes not for manufacturing PMI calculation
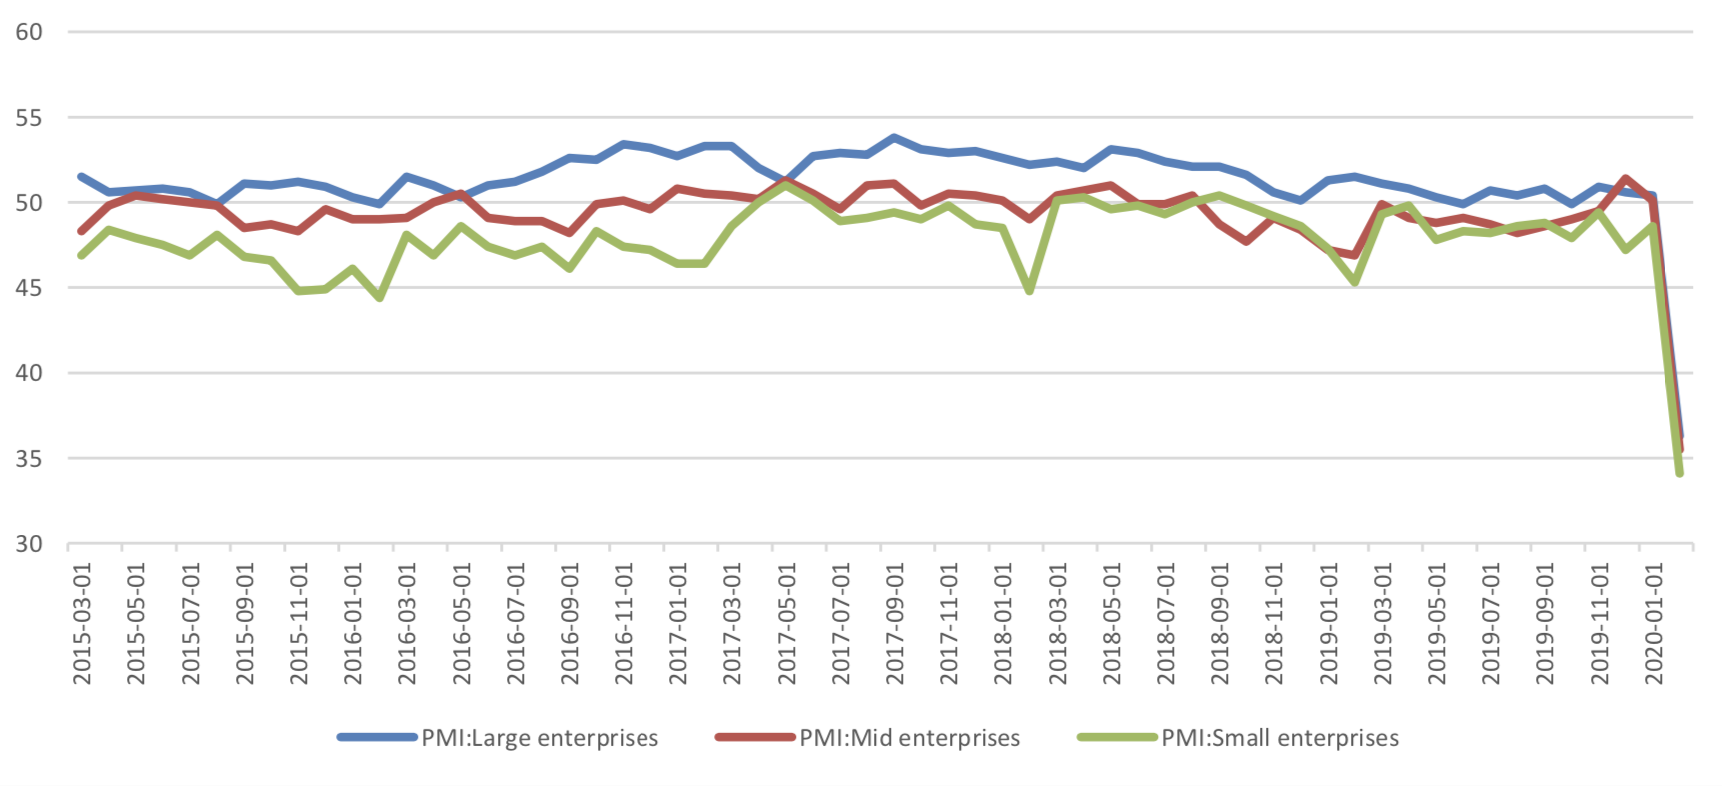
(3) PMI by enterprises size
PMI for all size enterprises dropped dramatically to deep contraction zone
Graph E: PMI by enterprises size
(4) Summary
The epidemic slowed down the production activities of enterprises, but the resumption of production has started orderly. The Bureau of Statistics said that the epidemic led to an increase in delayed delivery and order cancellation. But at the same time, the new order index is better than the production index, and the manufacturing demand is relatively good. With the sustained support of recent policies, the rate of enterprises returning to work has picked up rapidly. The Statistics Bureau said that as of February 25, the rate of large and medium-sized enterprises returning to work was 78.9%.
The resumption of work and production is advancing steadily, and PMI is expected to pick up significantly in March.


Currently no Comments.
Hot Topics
The 13rd China International Future Forum
The Shanghai Derivatives Energy Forum has received extensive attention from relevant industries both within and outside the borders.
Financial institutions deep explore commodity market opportunities, commodity index financial products show full-scale trend
R-Code for analysis: getKDJ
R-Code@June 06, 2016
New indicator to analyze the arbitrage opportunities between sse50 and csi500
Market review: January 11, 2017
The Great China Bubble: Anniversary Lessons and Outlook
Quant Investment in China A-share market
The hedge strategy between SSE50 and A50--Jan 13,2017
The arbitraging strategy between CSI300 and SSE50
Market review: June 17, 2016
Sleepless in London--Enda Homan(Allied Irish Banks Plc)
MSCI Rebuffs Chinese Equities for Third Time in Blow to Xi
Soros, Druckenmiller among hedgies profiting in market plunge