FangQuant › Financial Futures
Market Summary:
Last week, there was generally increase over the market. Shanghai SE Composite Index (000001.SH) changed 5.35 % to 3034.51. Specifically, small cap shares perform better than large cap shares and we can observe that CSI500 did better than SSE50 (5.73% vs 5.1%). The average daily turnover of the whole market during past 5 trading days is 1065.36 billion CNY, it decreased 13.10% compared with the previous 5-trading day period.
During the week, the spread of the epidemic situation is obvious and it caused significant impact on global market. There is still no sign of controlling on global outbreak, then such impact should still continue.
As for arbitrage opportunity, CSI500 futures current-month contracts show some room for arbitrage opportunities. No price spread for next-month/current month contracts show room for arbitrage.
News:
1. Mi Feng, spokesman of the National Health Commission and deputy director of the publicity department, said that the newly confirmed cases in other provinces outside Hubei were all confirmed overseas, and there were no confirmed cases at home for the first time. There were no new cases in Hubei except for Wuhan for three consecutive days, and the newly confirmed cases in Wuhan dropped to less than 50, indicating that the current prevention and control measures are effective and the situation of epidemic prevention and control continues to be good. However, with the continuous occurrence of international imported cases in China, the epidemic prevention is still facing great pressure of risk.
2. Chen Yixin, deputy leader of the central steering group: while concentrating on fighting the war of annihilation, he planned to return to work in advance and promote the departure of the people staying in Wuhan in batches.
3. The front page of Economic Reference: in order to promote the resumption of work and production, it is necessary to remove obstacles and diseases. At present, it is indeed a difficult problem to coordinate the prevention and control of the epidemic and the resumption of production, but it is also a question that must be answered. Only by removing the blocking points one by one, solving the problems one by one, and conscientiously doing all kinds of work in detail, can we realize the orderly flow of people and property, the organic connection of production, supply and marketing, and the effective connection of domestic and foreign trade, minimize the losses caused by the epidemic situation, and create conditions for achieving the decisive goal of building a moderately prosperous society in an all-round way and overcoming poverty in a decisive battle.
4. According to the China Securities Journal, wind data shows that as of March 6, 87 insurance companies and branches have conducted 498 surveys this year, compared with 134 in the same period in 2019. Affected by the epidemic, half of the insurance executives involved in the survey expect the company to adjust its asset allocation plan this year, with stocks and alternative investment as the majority of options. In the next quarter, equity assets will become the most attractive asset category among respondents, 29% of whom are optimistic about a shares and 19% are optimistic about Hong Kong shares.
5. Sina quoted foreign media as saying that Saudi Arabia plans to increase oil production next month, with a daily output of more than 10 million barrels, as a fierce reaction to the collapse of the country's OPEC + alliance with Russia. Saudi Crude oil production is likely to grow to 10 million barrels a day in April from about 9.7 million barrels a day this month, people familiar with the situation said. In addition, Saudi Arabia has significantly reduced the price of crude oil sold to foreign markets such as Europe, the Far East and the United States, with the largest discount in more than 20 years, in order to attract foreign refineries to buy Saudi Crude oil.
6. CCTV news: a number of foreign media reports: the Italian Prime Minister announced that control measures will be implemented on about a quarter of the country's population to restrict the flow of people in order to control the expansion of the epidemic; a draft decree of the Italian government shows that the country will block the Lombardy region in the North and 11 neighboring provinces to curb the spread of the new coronavirus. Milan and Venice are also under siege, with about 10 million people expected to be affected.
1. StockMarket
(1) Indices Performance
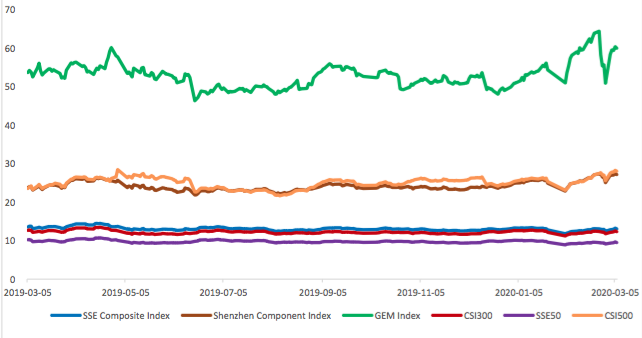
During last week, Shanghai SE Composite Index (000001.SH) changed 5.35 % to 3034.51, Shenzhen Component Index (399001.SZ) changed 5.48 % to 11582.82, ChiNext Price Index (399006.SZ) changed 5.86 % to 2192.94, CSI 300 INDEX (000300.SH) changed 5.04 % to 4138.51, CSI SmallCap 500 index (000905.SH) changed 5.73 % to 5763.86, SSE 50 Index (000016.SH) changed 5.10 % to 2964.83.
Graph 1: Indices Performance over past 3 months
The average daily turnover of the whole market during past 5 trading days is 1065.36 billion CNY, it decreased 13.10% compared with the previous 5-trading day period.
Graph 2: Market turnover
In the view of sectors, during last week (from 2020-03-02 to 2020-03-06), 23 of 24 Wind Level- 2 sector(s) increased while 1 sector(s) dropped. Specifically, Food & Staples Retailing (10.83%), Retailing(9.35%) and Food, Beverage & Tobacco(8.91%) did the best performance while Semiconductors & Semiconductor Equipment (-1.38%), Banks(3.29%) and Software & Services(3.68%) did the worst performance.
Graph 3: Sectors performance under Wind Level-2 classification (%)


(3) Indices Valuation (TTM)
The current PE for SSE Composite Index, Shenzhen Component Index, GEM Index, CSI300, SSE50, CSI500 are 13.0687, 27.1709, 59.9744, 12.3286, 9.5107, 28.0117respectively; and these indices are at 25.90%, 45.40%, 83.20%, 40.60%, 24.10%, 41.50% percent rank level of their historic data, respectively
Graph 4: PE of 6 indices
Graph 5: PE percent rank of 6 indices (calculated by data of past 1200 trading days, only 1Y data is presented on the graph)
The current PB for SSE Composite Index, Shenzhen Component Index, GEM Index, CSI300, SSE50, CSI500 are 1.3883,2.9440,6.6173,1.4798,1.1624, 1.9872respectively, and these indices are at 16.50%, 43.70%, 79.70%, 40.70%, 17.60%, 31.00% percent rank level of their historic data, respectively.
Graph 6: PB of 6 indices
Graph 7: PB percent rank of 6 indices (calculated by data of past 1200 trading days, only 1Y data is presented on the graph)
(4) Foreign Fund Flow
During last 5 trading days the total foreign fund flow via Stock Connect is 5.62 billion RMB, and the cumulative inflows was 1049.07 billion RMB. Specifically, the fund flow via Shanghai-Hong Kong Stock Connect is 5.67 billion RMB and the fund flow via Shenzhen-Hong Kong Stock Connect is -0.05 billion RMB.
Graph 8: Fund flow via both Shanghai and Shenzhen-Hong Kong Stock Connect in past 1M (100 million CNY)
Graph 9: Fund flow via Shenzhen-Hong Kong Stock Connect in past 1M (100 million CNY)
Graph 10: Fund flow via both Shanghai-Hong Kong Stock Connect in past 1M (100 million CNY)
(5) Margin Trading
According to the newest data, the margin financing balance is 967.84 billion, securities borrowing is
13.47 billion, totally 981.31 billion.
Graph 11: Margin Trading(100m RMB)
2. Index Futures
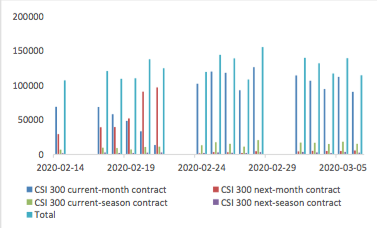
(1) Trading Volume and Open Interests
During past 5 trading days the average trading volume for CSI300(IF), SSE50(IH), CSI500(IC) contracts
are 128226 (-3.59%, the previous 5-trading day period),47840 (2.59%),165261 (-11.71%) lots, respectively. On the last trading day, the total open interests for them are 137498 (-7.64%),68288 (-4.68%),189998 (- 6.53%) lots respectively.
Graph 12: CSI300 Index futures’ trading volume
Graph 13: CSI300 Index futures’ open interests
Graph 14:SSE50 Index futures’ trading volume
Graph 15: SSE50 Index futures’ open interests
Graph 16: CSI500 Index futures’ trading volume
Graph 17: CSI500 Index futures’ open interests
(2) Roll Level Bid-Ask Distribution Worked form last 3 trading days.
Graph 18: CSI300 Current/Next Month Contract Roll Spread Distribution (2s frequency)
Graph 19: SSE50 Current/Next Month Contract Roll Spread Distribution (2s frequency)


Graph 20: CSI500 Current/Next Month Contract Roll Spread Distribution (2s frequency)
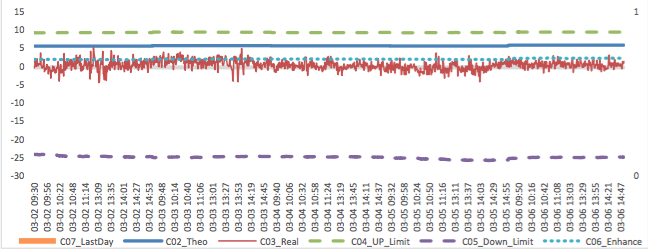
Assumption: risk-free rate: 3%; security borrowing cost: 8%; trading expense for spot: 0.025%; trading expense for futures: 0.005%; margin rates for futures contracts: 0.11 for CSI300 and SSE50, 0.13 for CSI500; margin rate for security borrowing: 0.3 (or 130% maintain rate).
When real price spread is out of theoretical range (calculated by our assumption), there exists absolute future-spot arbitrage opportunity.
Graph 21: Future (Current Month)-Spot Arbitrage Opportunity for CSI300 contract (in the view of price difference)


Graph 22: Future (Current Month)-Spot Arbitrage Opportunity for SSE50 contract (in the view of price difference)
Graph 23: Future (Current Month)-Spot Arbitrage Opportunity for CSI500 contract (in the view of price difference)
Graph 24: Future (Next Month-Current Month) Arbitrage Opportunity for CSI300 contract (in the view of price difference)
Graph 25: Future (Next Month-Current Month) Arbitrage Opportunity for SSE50 contract (in the view of price difference)
Graph 26: Future (Next Month-Current Month) Arbitrage Opportunity for CSI500 contract (in the view of price
difference)
(4) Roll Spread of Stock Index Futures Tracking
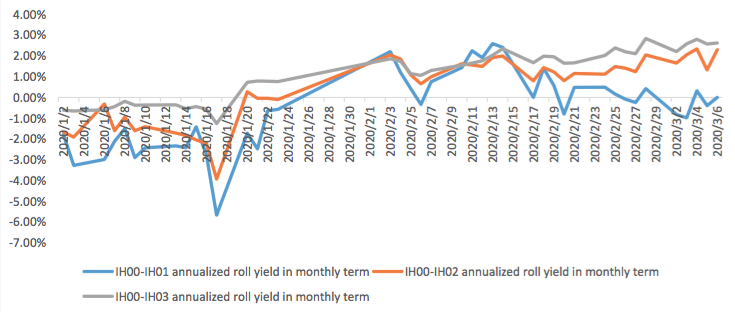
Calculated as the contract price of the current month minus the contract price of the following month, for the long roll, the positive calculation results are gains, the negative calculation results are losses. Code 00 in the figure represents the current month contract, 01 the next month contract, 02 the current quarter contract, 03 the next quarter contract.
(a)IF
Up to2020/3/6,the best roll plan is IF00-IF03,annualized roll yield in monthly term is2.85%。
Graph 27: IF Current month contract roll yield comparison (index point)
Graph 28: IF Current month contract roll yield comparison (annualized return)
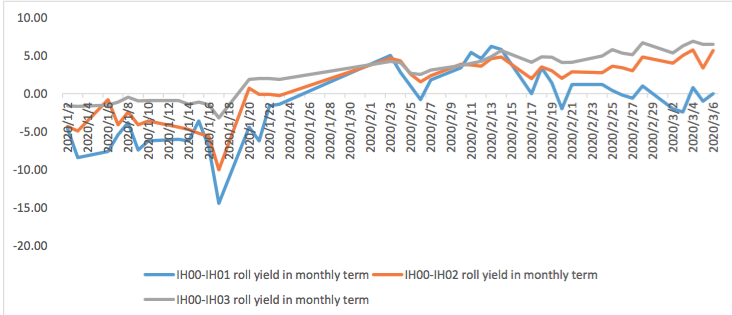
(b)IH
Up to 2020/3/6,the best roll plan is IH00-IH03,annualized roll yield in monthly term is2.62%。
Graph 29: IH Current month contract roll yield comparison (index point)
Graph 30: IH Current month contract roll yield comparison (annualized return)
(c)IC
Up to2020/3/6,the best roll plan isIC00-IC02,annualized roll yield in monthly term is10.13%。
Graph 31: IC Current month contract roll yield comparison (index point)
Graph 32: IC Current month contract roll yield comparison (annualized return)
(5) Basis Tracking of Stock Index Futures
For long side, if the base difference is positive, the change of the base difference brings losses, and if the base difference is negative, the change of the base difference brings profits.
(a)IF
For long side hedge, up to 2020/3/6, all IF contracts were in discount. Here IF next month contract basis return annualized yield is 2.99%。
Graph 33: IF contracts basis
Table 1: IF basis return calculation
(b)IH
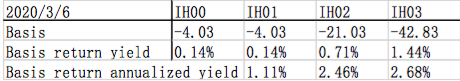
For long side hedge, up to 2020/3/6,all IH contracts were in discount. Here IH next month contract
basis return annualized yield is 1.11%。
Graph 34: IH contracts basis
Table 2: IH basis return calculation
(c)IC
For long side hedge, up to 2020/3/6, all IC contracts were in discount. Here IC next month contract
basis return annualized yield is 18.18%。
Graph 35: IC contracts basis
Table 3: IC basis return calculation
3. Financial Markets
(1) Interest Rates
The term structure of treasury bonds’ yields is currently upward sloping in concave shape.
Specifically, last week, short-term yields short term yield of Treasury bond experienced some fluctuation and 3M yield now at 1.6%-1.8% level. Furthermore, as for long-term yield, there is a small drop. 10Y yield is about 2.8%-3.0%.
Graph 36: Term Structure Evolvement of Treasury Bonds Yields During Recent 3 Months (%)
As for Shibor rates, short-term rates experienced significant fluctuation. Specifically, O/N rate experienced obvious fluctuation to 1.2%-1.4% level.
Graph 37: Term Structure Evolvement of Shibor Rates During Recent 3 Months (%)
(2) ExchangeRates
During last week, CNY/USD changed -0.710% to 6.9400 and offshore rate, CNH/USD, changed - 0.70% to 6.9300 and USD index changed -2.06%.
Graph 38: USD/CNY, USD/CNH and USD Index


Currently no Comments.
Hot Topics
The 13rd China International Future Forum
The Shanghai Derivatives Energy Forum has received extensive attention from relevant industries both within and outside the borders.
Financial institutions deep explore commodity market opportunities, commodity index financial products show full-scale trend
R-Code for analysis: getKDJ
R-Code@June 06, 2016
New indicator to analyze the arbitrage opportunities between sse50 and csi500
Market review: January 11, 2017
The Great China Bubble: Anniversary Lessons and Outlook
Quant Investment in China A-share market
The hedge strategy between SSE50 and A50--Jan 13,2017
The arbitraging strategy between CSI300 and SSE50
Market review: June 17, 2016
Sleepless in London--Enda Homan(Allied Irish Banks Plc)
MSCI Rebuffs Chinese Equities for Third Time in Blow to Xi
Soros, Druckenmiller among hedgies profiting in market plunge