FangQuant › Financial Futures
Market Summary:
Last week, there was generally increase over the market. Shanghai SE Composite Index (000001.SH) changed 5.35 % to 3034.51. Specifically, small cap shares perform better than large cap shares and we can observe that CSI500 did better than SSE50 (5.73% vs 5.1%). The average daily turnover of the whole market during past 5 trading days is 1065.36 billion CNY, it decreased 13.10% compared with the previous 5-trading day period.
During the week, the spread of the epidemic situation is more serious and it caused significant impact on global market. There is still no sign of controlling on global outbreak. The global financial market experienced historical high level of fluctuation. Though many countries take measures like short limit, interest rate cut, QE measures, high fluctuation should still continue.
As for arbitrage opportunity, all futures current-month contracts show some room for arbitrage opportunities. CSI500 price spread for next-month/current month contracts show room for arbitrage.
News:
(1) Xinhua News Agency: "seeking truth" magazine will issue an important article by general secretary Xi Jinping to provide strong scientific and technological support for the prevention and control of the epidemic situation. The article points out that we should strengthen the combination of drug development, medical equipment research and development and clinical treatment, effectively improve the cure rate, reduce the mortality rate, and promote the organic integration of vaccine research and industrialization chain, so as to normalize the possible prevention and control. The work should be well prepared; we should coordinate the research on virus traceability and its transmission way, find out where the source of the disease comes from and where it goes, and use new technologies such as artificial intelligence and big data to carry out epidemiological and traceability investigation, so as to improve the accuracy and screening efficiency.
(2) First finance and Economics: Sun Guofeng, director of the Monetary Policy Department of the people's Bank of China, said that as of March 13, the people's Bank of China had issued 184 billion yuan of special re-loans. Nine national banks and local legal person banks in 10 provinces and cities had issued 182.1 billion yuan of preferential loans to 4708 national and local key enterprises, with an average of 40 million yuan for each enterprise. At present, the progress of the bank's granting preferential loans is maintained at 10 billion yuan per day, the granting speed is relatively fast, and the effect of special refinancing is significant. In the next step, we will continue to take a variety of comprehensive measures to promote a significant downward trend in loan interest rates and support enterprises to resume production and economic development. The first is to keep the liquidity reasonable and abundant, so as to provide a good liquidity environment for reducing the financing cost of enterprises; the second is to continue to push forward the LPR reform in an orderly manner; the third is to guide the banking system to make profits to the real economy appropriately, so as to reduce the financing cost of enterprises; the fourth is to continue to play the role of deposit interest rate and benchmark interest rate as the ballast of the whole interest rate system.
(3) Securities Times: Sun Guofeng, director of the Monetary Policy Department of the people's Bank of China, said that the RMB 500 billion refinancing and rediscount policy has achieved increment, price reduction and expansion. The increment is to increase the quota of 500 billion yuan, the price reduction is to reduce the interest rate of small-scale loans to support agriculture by 0.25 percentage points, and the expansion is to focus on supporting enterprises in large areas affected by the epidemic, such as return to work and production.
(4) Ye Yanfei, a first-class inspector of the Bureau of policy research of the BIRC, said that up to now, the credit support provided by banking and financial institutions to fight the epidemic has exceeded 1.4 trillion yuan. From January to February, credit increased year-on-year, an increase of about 130 billion.
(5) Ministry of Education: we are seeking opinions from all parties. We will decide whether to postpone the college entrance examination in the near future.
(6) Zhong Nanshan talks about the epidemic situation in the United States: the mortality rate in the United States is nearly 3%, which indicates that many patients have not been found, and they have not carefully screened close contacts.
(7) People's Daily overseas network: the latest real-time statistics of Johns Hopkins University of China show that as of 5:30 Beijing time 16th, there were 162687 cases globally, and more than 80 thousand cases diagnosed by outside China, the total reached 81625 cases.
1. StockMarket
(1) Indices Performance
During last week, Shanghai SE Composite Index (000001.SH) changed -4.85 % to 2887.43, Shenzhen Component Index (399001.SZ) changed -6.49 % to 10831.12, ChiNext Price Index (399006.SZ) changed - 7.40 % to 2030.58, CSI 300 INDEX (000300.SH) changed -5.88 % to 3895.31, CSI SmallCap 500 index (000905.SH) changed -5.32 % to 5457.20, SSE 50 Index (000016.SH) changed -5.60 % to 2798.77.
Graph 1: Indices Performance over past 3 months
The average daily turnover of the whole market during past 5 trading days is 988.98 billion CNY, it decreased 7.17% compared with the previous 5-trading day period.
Graph 2: Market turnover
In the view of sectors, during last week (from 2020-03-09 to 2020-03-13), 0 of 24 Wind Level-2 sector(s) increased while 24 sector(s) dropped. Specifically, Consumer Services (-1.42%), Retailing(- 2.78%) and Transportation(-2.95%) did the best performance while Consumer Durables & Apparel(- 8.05%), Materials (-7.94%) and Insurance (-7.73%) did the worst performance.
Graph 3: Sectors performance under Wind Level-2 classification (%)
(3) Indices Valuation (TTM)
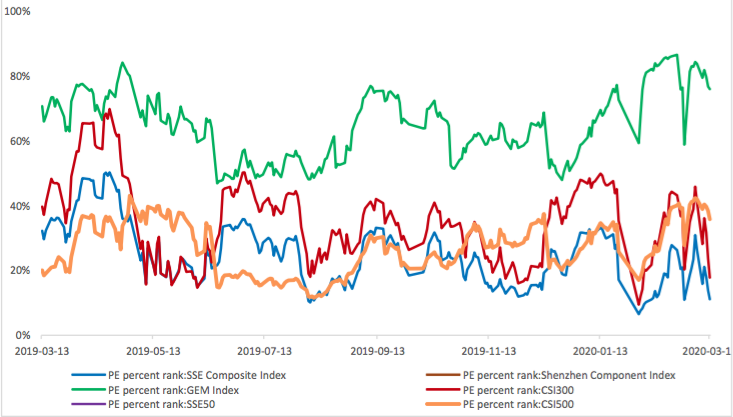
The current PE for SSE Composite Index, Shenzhen Component Index, GEM Index, CSI300, SSE50, CSI500 are 12.4542, , 55.4934, 11.6887, , 26.3948respectively; and these indices are at 11.10%, #N/A, 75.80%, 17.70%, #N/A, 35.70% percent rank level of their historic data, respectively
Graph 4: PE of 6 indices
Graph 5: PE percent rank of 6 indices (calculated by data of past 1200 trading days, only 1Y data is presented on the graph)
The current PB for SSE Composite Index, Shenzhen Component Index, GEM Index, CSI300, SSE50, CSI500 are 1.3204,2.7534,6.1206,1.3985,1.1078, 1.8827respectively, and these indices are at 6.40%, 33.30%, 71.90%, 14.30%, 3.50%, 25.10% percent rank level of their historic data, respectively.
Graph 6: PB of 6 indices
Graph 7: PB percent rank of 6 indices (calculated by data of past 1200 trading days, only 1Y data is presented on the graph)
(4) Foreign Fund Flow
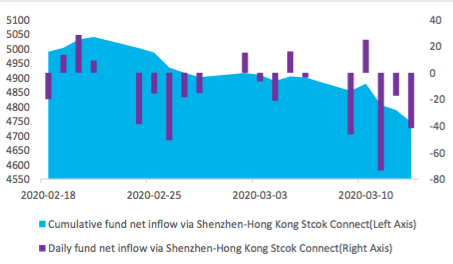
During last 5 trading days the total foreign fund flow via Stock Connect is -41.79 billion RMB, and the cumulative inflows was 1007.28 billion RMB. Specifically, the fund flow via Shanghai-Hong Kong Stock Connect is -26.35 billion RMB and the fund flow via Shenzhen-Hong Kong Stock Connect is -15.44 billion RMB.
Graph 8: Fund flow via both Shanghai and Shenzhen-Hong Kong Stock Connect in past 1M (100 million CNY)
Graph 9: Fund flow via Shenzhen-Hong Kong Stock Connect in past 1M (100 million CNY)
Graph 10: Fund flow via both Shanghai-Hong Kong Stock Connect in past 1M (100 million CNY)
(5) Margin Trading
According to the newest data, the margin financing balance is 1099.43 billion, securities borrowing is
15.73 billion, totally 1115.16 billion.
Graph 11: Margin Trading(100m RMB)
2. Index Futures
(1) Trading Volume and Open Interests
During past 5 trading days the average trading volume for CSI300(IF), SSE50(IH), CSI500(IC) contracts
are 151144 (17.87%, the previous 5-trading day period),56801 (18.73%),187970 (13.74%) lots, respectively. On the last trading day, the total open interests for them are 160969 (17.07%),79719 (16.74%),210937 (11.02%) lots respectively.
Graph 12: CSI300 Index futures’ trading volume
Graph 13: CSI300 Index futures’ open interests
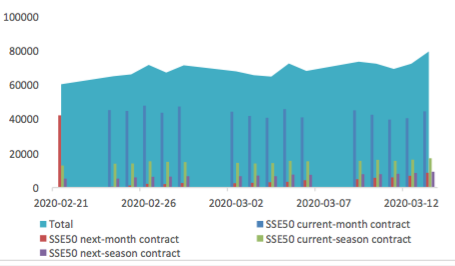
Graph 14:SSE50 Index futures’ trading volume
Graph 15: SSE50 Index futures’ open interests
Graph 16: CSI500 Index futures’ trading volume
Graph 17: CSI500 Index futures’ open interests
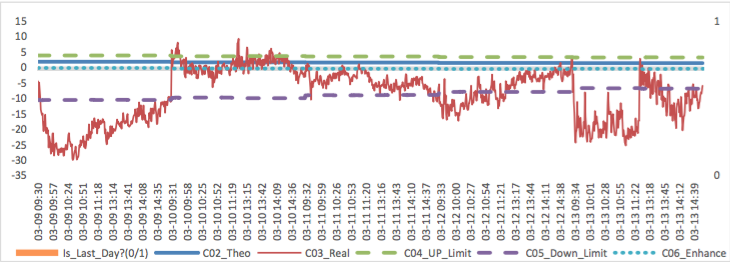
(2) Roll Level Bid-Ask Distribution Worked form last 5 trading days.
Graph 18: CSI300 Current/Next Month Contract Roll Spread Distribution (2s frequency)
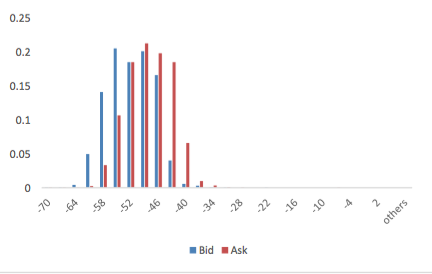
Graph 19: SSE50 Current/Next Month Contract Roll Spread Distribution (2s frequency)
Graph 20: CSI500 Current/Next Month Contract Roll Spread Distribution (2s frequency)
Assumption: risk-free rate: 3%; security borrowing cost: 8%; trading expense for spot: 0.025%; trading expense for futures: 0.005%; margin rates for futures contracts: 0.11 for CSI300 and SSE50, 0.13 for CSI500; margin rate for security borrowing: 0.3 (or 130% maintain rate).
When real price spread is out of theoretical range (calculated by our assumption), there exists absolute future-spot arbitrage opportunity.
Graph 21: Future (Current Month)-Spot Arbitrage Opportunity for CSI300 contract (in the view of price difference)
Graph 22: Future (Current Month)-Spot Arbitrage Opportunity for SSE50 contract (in the view of price difference)
Graph 23: Future (Current Month)-Spot Arbitrage Opportunity for CSI500 contract (in the view of price difference)
Graph 24: Future (Next Month-Current Month) Arbitrage Opportunity for CSI300 contract (in the view of price difference)
Graph 25: Future (Next Month-Current Month) Arbitrage Opportunity for SSE50 contract (in the view of price difference)
Graph 26: Future (Next Month-Current Month) Arbitrage Opportunity for CSI500 contract (in the view of price
difference)
Graph 28: IF Current month contract roll yield comparison (annualized return)
(b)IH
Up to 2020/3/13,the best roll plan is IH00-IH02,annualized roll yield in monthly term is4.06%。
Graph 29: IH Current month contract roll yield comparison (index point)
Graph 30: IH Current month contract roll yield comparison (annualized return)
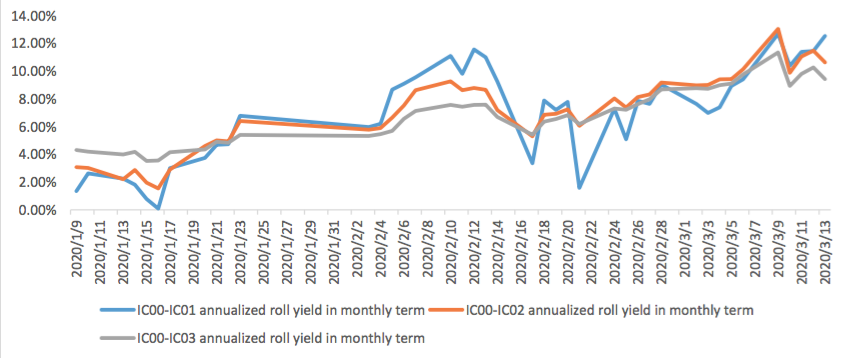
(c)IC
Up to2020/3/13,the best roll plan isIC00-IC01,annualized roll yield in monthly term is12.53%。
Graph 31: IC Current month contract roll yield comparison (index point)
Graph 32: IC Current month contract roll yield comparison (annualized return)
(5) Basis Tracking of Stock Index Futures
For long side, if the base difference is positive, the change of the base difference brings losses, and if the base difference is negative, the change of the base difference brings profits.
(a)IF
For long side hedge, up to 2020/3/13, all IF contracts were in discount. Here IF next month contract basis return annualized yield is 2.53%。
Graph 33: IF contracts basis
Table 1: IF basis return calculation
(b)IH
For long side hedge, up to 2020/3/13,IH00 was in premium, other IH contracts were in discount. Here
IH next month contract basis return annualized yield is 2.08%。
Graph 34: IH contracts basis
Table 2: IH basis return calculation
(c)IC
For long side hedge, up to 2020/3/13, all IC contracts were in discount. Here IC next month contract
basis return annualized yield is 11.98%。
Graph 35: IC contracts basis
Table 3: IC basis return calculation
3. Financial Markets
(1) Interest Rates
The term structure of treasury bonds’ yields is currently upward sloping in concave shape.
Specifically, last week, short-term yields short term yield of Treasury bond experienced some fluctuation and 3M yield now at 1.6%-1.8% level. Furthermore, as for long-term yield, there is a small drop. 10Y yield is about 2.8%-3.0%.
Graph 36: Term Structure Evolvement of Treasury Bonds Yields During Recent 3 Months (%)
As for Shibor rates, short-term rates experienced significant fluctuation. Specifically, O/N rate experienced obvious fluctuation to 1.2%-1.4% level.
Graph 37: Term Structure Evolvement of Shibor Rates During Recent 3 Months (%)
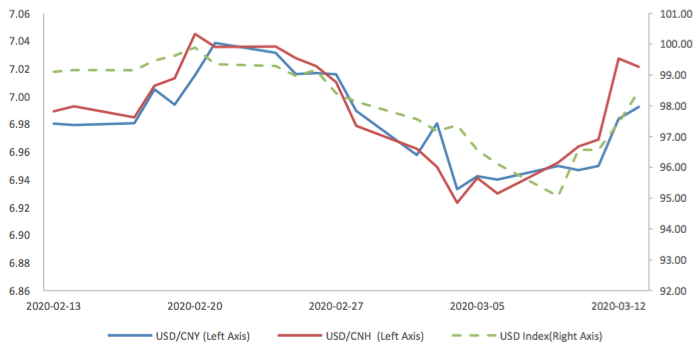
(2) ExchangeRates
During last week, CNY/USD changed 0.758% to 6.9926 and offshore rate, CNH/USD, changed 1.32% to 7.0215 and USD index changed 2.47%.
Graph 38: USD/CNY, USD/CNH and USD Index
Macroeconomic Topic(1):
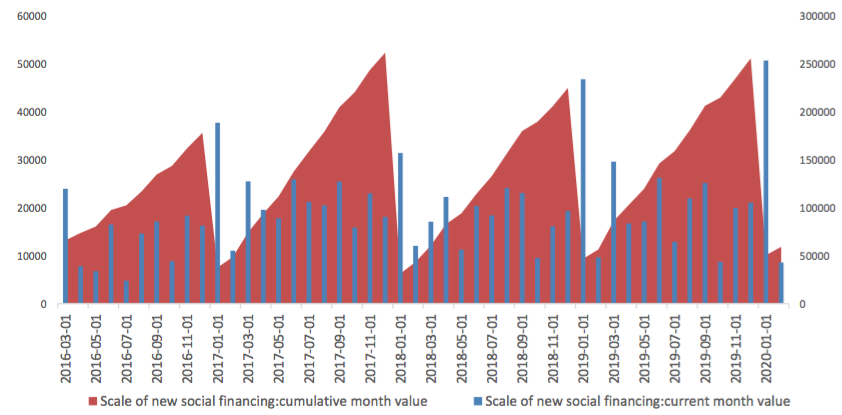
The data show that, in February, the scale of new social financing decreased, reached 855.4 billion yuan, drop from 966.5 billion yuan last year.
February Finance Data
(1) Social Financing Data
Graph A: Total Social Financing Data(100m RMB)
In on-balance-sheet financing, in terms of RMB loans, 745.4 billion yuan was added in February, dropped from 3492 billion yuan from last month, and lower than the value, 764 billion, at the same period of last year. New RMB loans accounted for 84.2% of the new social financing scale.
Graph B: On-balance-sheet Financing Data(100m RMB)
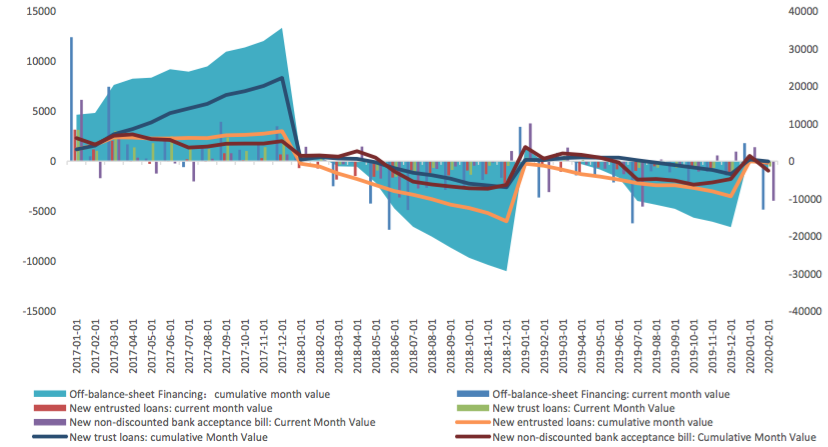
From the perspective of new off-balance sheet financing, it faced an obvious contraction in February.. In February it report -485.7 billion yuan, the previous value is 180.9 billion yuan.
Graph C: Off-balance-sheet Financing Data(100m RMB)
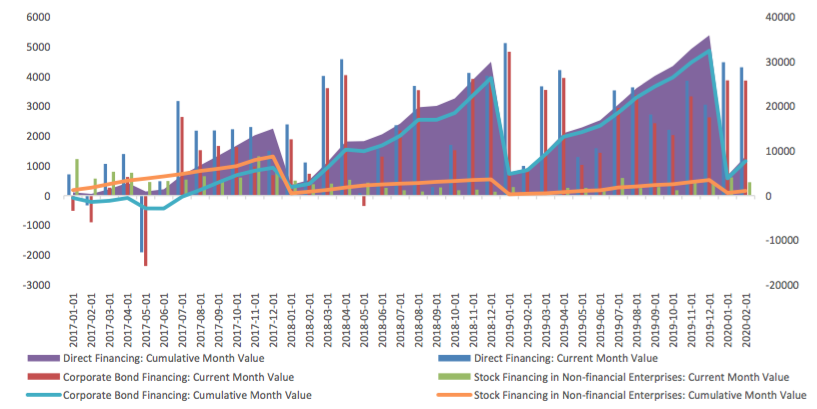
In terms of the direct financing, the direct financing of enterprises was 430.9 billion yuan, obviously higher compared with the same period last year, 99.4 billion, but with the ring ratio decrease, 3.7, mainly because of the decrease in stock financing.
Graph D: Direct Financing Data(100m RMB)
(2) Monetary Data
In February, M2 rose to 8.8%, and M1 dropped from 0% to 4.8%, and the difference between M2 and M1 decrease from 8.4% to 4%.
Graph E: M1 and M2 data
(3) Summary
On the one hand, the monetary and financial data in February reflected the impact of the epidemic, which was mainly reflected in the decline of medium and long-term loans and off balance sheet businesses. On the other hand, it also showed the support of monetary authorities and financial institutions to the real economy under the counter cyclical adjustment of monetary policy, which was reflected in the increase of short-term loans, the development of direct financing of enterprises, the fixed issuance of government bonds and M1 and M2 rebound, etc
Macroeconomic Topic(2):
According to the released price data by the national bureau of statistics. The data showed that year-on- year CPI slightly dropped but still high. PPI dropped to deflation region. The data showed that the year-on- year and ring ratio CPI were 5.2percent and 0.8 percent, respectively, compared with pre value of 5.4 percent and 1.4 percent, respectively. Year-on-year and ring ratio PPI were -0.4 percent and -0.5 percent, respectively, compared with the previous figures of 0.1 percent and 0 percent, respectively.
February Price Data
(3) CPI Data
Graph A: CPI Data
The main reason for CPI at high level is still the food price. Food CPI increased by 21.9% year-on-year, while non-food CPI increased by 0.9%. The core CPI rose 1.0%.
Graph B: year-on-year CPI: by Food, Non-Food, Core, Services, Consumer Goods (%)
Residence, education, culture and entertainment, healthcare, household goods and service prices rose slightly, with growth rates of 0.3%, 1.0%, 2.2% and 0.1% respectively. Transportation and communication rose -1.6%, back to deflation region.
Graph C: year-on-year CPI: by Food Alcohol and Tobacco, Clothing, Residence, Household Goods & Services, Transportation & Communications, Education, Culture & Entertainment, Healthcare (%)
(4) PPI Data
Graph D: PPI Data (%)
The means of production PPI was -1 percent year-on-year, decreased 0.6 percentage point from the previous month. The means of livelihoods PPI, was 1.4 percent, compared with the previous value of 1.3 percent.
Graph E: PPI Data, by means of production and means of livelihoods
(3) Summary
The price data in February reflects the impact of the epidemic to some extent. CPI remains high, but there is a loop, but the new price increase factor is higher than that in January. The reason for the high price is still food, which is still pork. Instead of food prices, there has been a significant decline due to the impact of the epidemic. In particular, the core CPI has set a new low since the data.


Calculated as the contract price of the current month minus the contract price of the following month, for the long roll, the positive calculation results are gains, the negative calculation results are losses. Code 00 in the figure represents the current month contract, 01 the next month contract, 02 the current quarter contract, 03 the next quarter contract.
(a)IF
Up to2020/3/13,the best roll plan is IF00-IF03,annualized roll yield in monthly term is3.61%。
Graph 27: IF Current month contract roll yield comparison (index point)


Currently no Comments.
Hot Topics
The 13rd China International Future Forum
The Shanghai Derivatives Energy Forum has received extensive attention from relevant industries both within and outside the borders.
Financial institutions deep explore commodity market opportunities, commodity index financial products show full-scale trend
R-Code for analysis: getKDJ
R-Code@June 06, 2016
New indicator to analyze the arbitrage opportunities between sse50 and csi500
Market review: January 11, 2017
The Great China Bubble: Anniversary Lessons and Outlook
Quant Investment in China A-share market
The hedge strategy between SSE50 and A50--Jan 13,2017
The arbitraging strategy between CSI300 and SSE50
Market review: June 17, 2016
Sleepless in London--Enda Homan(Allied Irish Banks Plc)
MSCI Rebuffs Chinese Equities for Third Time in Blow to Xi
Soros, Druckenmiller among hedgies profiting in market plunge