FangQuant › Financial Futures
Market Summary:
Last week, there was generally decrease over the market. Shanghai SE Composite Index (000001.SH) changed -4.91 % to 2745.62. Specifically, small cap shares perform better than large cap shares and we can observe that CSI500 did better than SSE50 (-4.06% vs -6.09%). The average daily turnover of the whole market during past 5 trading days is 831.58 billion CNY, it decreased 15.92% compared with the previous 5- trading day period.
Novel coronavirus pneumonia has reached 265 thousand in the forenoon at 10 a.m. central time in March 21st, with more than 10 thousand deaths. Among them, Europe and the United States have become major disaster areas, Italy has more than 50000 people infected, Spain, Iran, the United States and Germany have more than 20000 people. If this spread rate does not change, the number of overseas infected people may exceed 1 million by early April. In response to the epidemic, nearly 50 countries around the world have declared a state of emergency.
Since March, under the lead of the Federal Reserve, the world's central banks have slashed interest rates or implemented quantitative easing monetary policy. The last time they launched such a large-scale easing monetary policy was during the global financial crisis in 2008. On March 3 and 16, the Federal Reserve cut interest rates sharply and officially restarted the zero interest rate. At the same time, the Federal Reserve announced that it would buy US $700 billion of treasury bonds and asset-backed securities, and restart the commercial paper purchase mechanism.
Monetary measures may save the liquidity but cannot cure virus. We do see the shutdown of the economic activity due to epidemic issue. This is getting worse in coming weeks, and should keep suppressing global market.
As for arbitrage opportunity, all futures current-month contracts show some room for arbitrage opportunities. All price spread for next-month/current month contracts show room for arbitrage.
News:
(1) The Ministry of Science and Technology issued the notice on several measures for scientific and technological innovation to support the resumption of production and the smooth operation of the economy: launch and implement the key special project of "science and technology to help the economy 2020". We will implement innovation and development actions for small and medium-sized science and technology- based enterprises. We will vigorously promote key core technology research, and increase the implementation and support of major scientific and technological projects such as 5G, artificial intelligence, quantum communication, brain science, industrial Internet, major infectious disease prevention and control, major new drugs, high-end medical devices, new energy, and new materials. We will promote the establishment of sub funds to support new drugs, medical equipment, testing, vaccines and other fields.
(2) China Net: National Development and Reform Commission: accelerate the high-quality development of new infrastructure construction. In the future, it will comprehensively promote more projects such as intelligent transportation, smart grid, smart city, and build an infrastructure system to meet the development needs of intelligent economy and smart society. Since this year, the progress of the distribution of investment plans within the central budget of the national development and Reform Commission has been accelerating. Taking transportation projects as an example, the distribution of investment plans for the whole year has exceeded 80%, involving nearly 54 billion yuan.
(3) China Net: the Ministry of Finance will make an overall plan for the issuance of new bonds in light of the economic situation, financial revenue and expenditure of this year and the situation of epidemic prevention and control as well as changes in the economic situation. As of March 20, the number of new local government bonds issued by all parts of the country has reached 1407.9 billion yuan, accounting for 76% of the quota issued in advance. We will continue to guide local governments to speed up the progress of local government bond issuance, form practical workload as soon as possible, and form an effective economic pull as soon as possible.
(4) Science and Technology Daily: the new coronavirus vaccine developed in China has been injected into human body. There are three groups of volunteers, 36 in each group. After injection, they will be isolated and observed for 14 days.
(5) According to the 21st century economic report, U.N. Secretary General Guterres said that the new crown epidemic makes the world face an unprecedented public health crisis, and the global economy will decline and may reach a record scale. The world must act decisively in a coordinated and innovative way.
(6) Century economic news: the acceleration of "new infrastructure" and the application demand generated by the epidemic situation may usher in a new round of development of China's industrial Internet. It is pointed out that China is a big country of network and manufacturing, and the development of industrial Internet has a good industrial foundation and huge market space.
1. StockMarket
(1) Indices Performance
During last week, Shanghai SE Composite Index (000001.SH) changed -4.91 % to 2745.62, Shenzhen Component Index (399001.SZ) changed -6.29 % to 10150.13, ChiNext Price Index (399006.SZ) changed - 5.69 % to 1915.05, CSI 300 INDEX (000300.SH) changed -6.21 % to 3653.22, CSI SmallCap 500 index (000905.SH) changed -4.36 % to 5219.28, SSE 50 Index (000016.SH) changed -6.09 % to 2628.42.
Graph 1: Indices Performance over past 3 months

The average daily turnover of the whole market during past 5 trading days is 831.58 billion CNY, it decreased 15.92% compared with the previous 5-trading day period.
Graph 2: Market turnover

In the view of sectors, during last week (from 2020-03-16 to 2020-03-20), 1 of 24 Wind Level-2 sector(s) increased while 23 sector(s) dropped. Specifically, Food & Staples Retailing (1.03%), Household & Personal Products(-1.15%) and Pharmaceuticals & Biotechnology(-2.25%) did the best
performance while Automobiles & Components(-8.59%),
did the worst performance.
Graph 3: Sectors performance under Wind Level-2 classification (%)

(3) Indices Valuation (TTM)
The current PE for SSE Composite Index, Shenzhen Component Index, GEM Index, CSI300, SSE50, CSI500 are 11.8493, 24.2150, 52.3149, 11.0659, 8.6026, 25.1594respectively; and these indices are at 7.20%, 30.10%, 64.00%, 8.40%, 2.30%, 25.10% percent rank level of their historic data, respectively
Graph 4: PE of 6 indices

Graph 5: PE percent rank of 6 indices (calculated by data of past 1200 trading days, only 1Y data is presented on the graph)

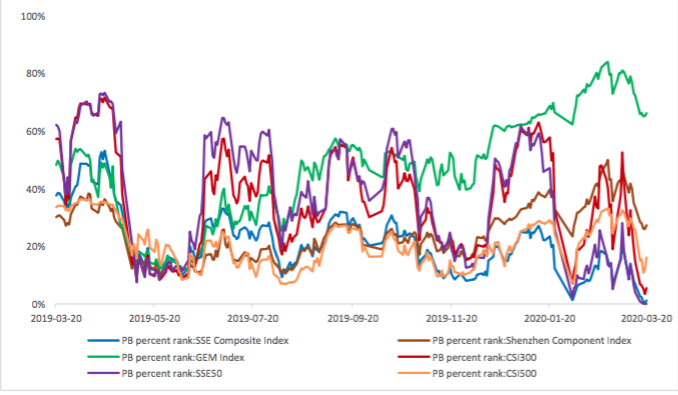
The current PB for SSE Composite Index, Shenzhen Component Index, GEM Index, CSI300, SSE50, CSI500 are 1.2563,2.5860,5.7722,1.3198,1.0506, 1.8013respectively, and these indices are at 1.20%, 27.30%, 66.20%, 5.50%, 0.00%, 16.10% percent rank level of their historic data, respectively.
Graph 6: PB of 6 indices
Graph 7: PB percent rank of 6 indices (calculated by data of past 1200 trading days, only 1Y data is presented on the graph)
(4) Foreign Fund Flow
During last 5 trading days the total foreign fund flow via Stock Connect is -33.77 billion RMB, and the cumulative inflows was 973.51 billion RMB. Specifically, the fund flow via Shanghai-Hong Kong Stock Connect is -17.07 billion RMB and the fund flow via Shenzhen-Hong Kong Stock Connect is -16.70 billion RMB.
Graph 8: Fund flow via both Shanghai and Shenzhen-Hong Kong Stock Connect in past 1M (100 million CNY)
Graph 9: Fund flow via Shenzhen-Hong Kong Stock Connect in past 1M (100 million CNY)
Graph 10: Fund flow via both Shanghai-Hong Kong Stock Connect in past 1M (100 million CNY)
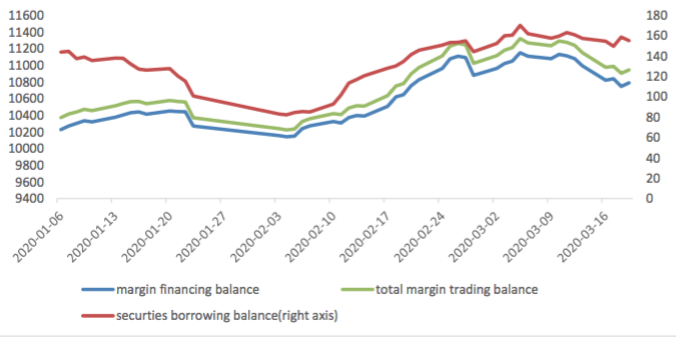
(5) Margin Trading
According to the newest data, the margin financing balance is 1078.89 billion, securities borrowing is
15.51 billion, totally 1094.40 billion.
Graph 11: Margin Trading(100m RMB)
2. Index Futures
(1) Trading Volume and Open Interests
During past 5 trading days the average trading volume for CSI300(IF), SSE50(IH), CSI500(IC) contracts
are 194018 (28.37%, the previous 5-trading day period),73307 (29.06%),210194 (11.82%) lots, respectively. On the last trading day, the total open interests for them are 149520 (-7.11%),69471 (- 12.86%),188656 (-10.56%) lots respectively.
Graph 12: CSI300 Index futures’ trading volume
Graph 13: CSI300 Index futures’ open interests


Graph 14:SSE50 Index futures’ trading volume
Graph 15: SSE50 Index futures’ open interests
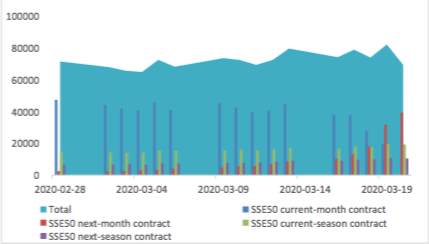
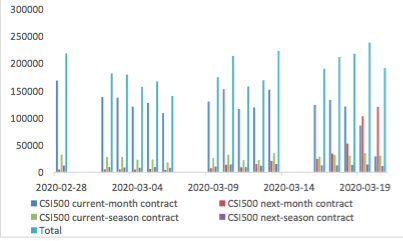
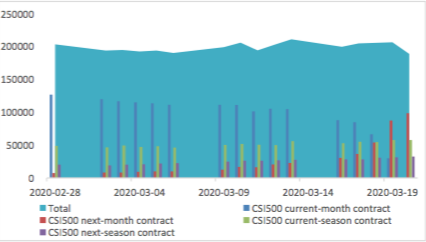
Graph 16: CSI500 Index futures’ trading volume
Graph 17: CSI500 Index futures’ open interests
(2) Roll Level Bid-Ask Distribution Worked form last 5 trading days.
Graph 18: CSI300 Current/Next Month Contract Roll Spread Distribution (2s frequency)
Graph 19: SSE50 Current/Next Month Contract Roll Spread Distribution (2s frequency)
Graph 20: CSI500 Current/Next Month Contract Roll Spread Distribution (2s frequency)
Assumption: risk-free rate: 3%; security borrowing cost: 8%; trading expense for spot: 0.025%; trading expense for futures: 0.005%; margin rates for futures contracts: 0.11 for CSI300 and SSE50, 0.13 for CSI500; margin rate for security borrowing: 0.3 (or 130% maintain rate).
When real price spread is out of theoretical range (calculated by our assumption), there exists absolute future-spot arbitrage opportunity.
Graph 21: Future (Current Month)-Spot Arbitrage Opportunity for CSI300 contract (in the view of price difference)
Graph 22: Future (Current Month)-Spot Arbitrage Opportunity for SSE50 contract (in the view of price difference)
Graph 23: Future (Current Month)-Spot Arbitrage Opportunity for CSI500 contract (in the view of price difference)


Graph 24: Future (Next Month-Current Month) Arbitrage Opportunity for CSI300 contract (in the view of price difference)

Graph 25: Future (Next Month-Current Month) Arbitrage Opportunity for SSE50 contract (in the view of price difference)

Graph 26: Future (Next Month-Current Month) Arbitrage Opportunity for CSI500 contract (in the view of price
difference)

(4) Roll Spread of Stock Index Futures Tracking
Calculated as the contract price of the current month minus the contract price of the following month, for the long roll, the positive calculation results are gains, the negative calculation results are losses. Code 00 in the figure represents the current month contract, 01 the next month contract, 02 the current quarter contract, 03 the next quarter contract.
(a)IF
Up to2020/3/20,the best roll plan is IF00-IF03,annualized roll yield in monthly term is4.91%。
Graph 27: IF Current month contract roll yield comparison (index point)

Graph 28: IF Current month contract roll yield comparison (annualized return)

(b)IH
Up to 2020/3/20,the best roll plan is IH00-IH02,annualized roll yield in monthly term is6.73%。
Graph 29: IH Current month contract roll yield comparison (index point)
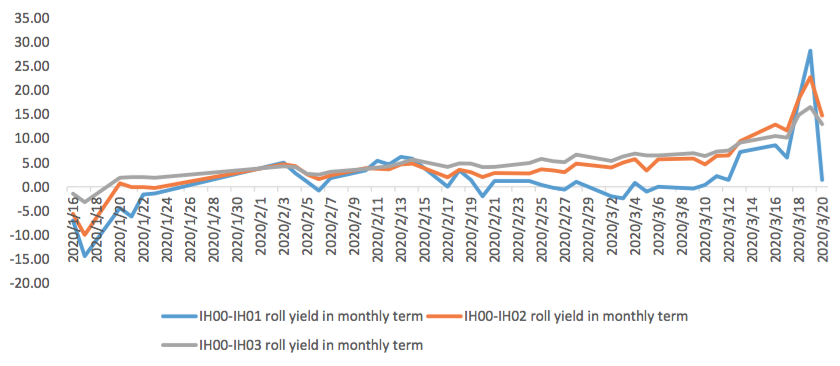
Graph 30: IH Current month contract roll yield comparison (annualized return)
(c)IC
Up to2020/3/20,the best roll plan isIC00-IC02,annualized roll yield in monthly term is10.67%。
Graph 31: IC Current month contract roll yield comparison (index point)
Graph 32: IC Current month contract roll yield comparison (annualized return)
(5) Basis Tracking of Stock Index Futures
For long side, if the base difference is positive, the change of the base difference brings losses, and if the base difference is negative, the change of the base difference brings profits.
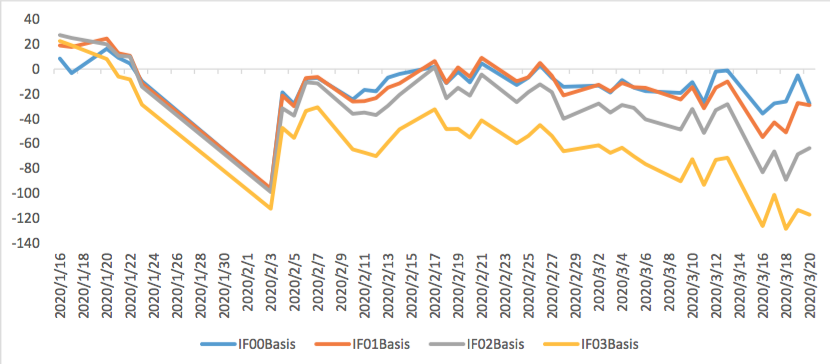
(a)IF
For long side hedge, up to 2020/3/20, all IF contracts were in discount. Here IF next month contract basis return annualized yield is 9.60%。
Graph 33: IF contracts basis
Table 1: IF basis return calculation
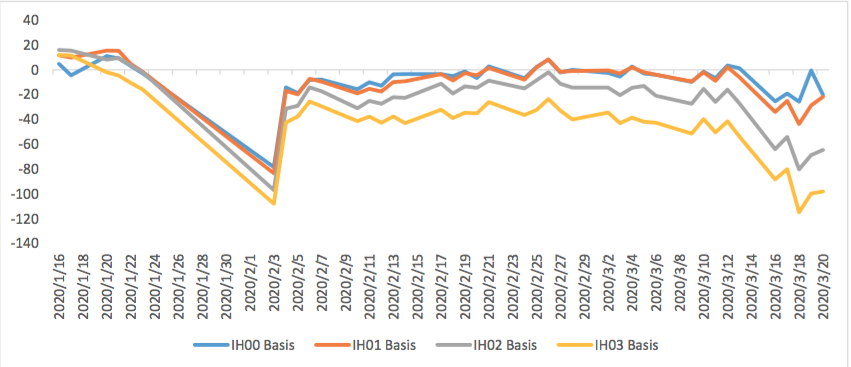
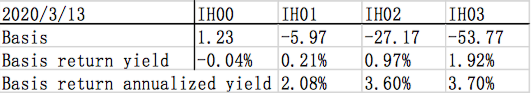
(b)IH
For long side hedge, up to 2020/3/20,all IH contracts were in discount. Here IH next month contract
basis return annualized yield is 9.96%。
Graph 34: IH contracts basis
(c)IC
For long side hedge, up to 2020/3/20, all IC contracts were in discount. Here IC next month contract
basis return annualized yield is 12.07%。
Graph 35: IC contracts basis
Table 3: IC basis return calculation
3. Financial Markets
(1) Interest Rates
The term structure of treasury bonds’ yields is currently upward sloping in concave shape.
Specifically, last week, short-term yields short term yield of Treasury bond experienced some fluctuation and 3M yield now at 1.6%-1.8% level. Furthermore, as for long-term yield, there is a small drop. 10Y yield is about 2.8%-3.0%.
Graph 36: Term Structure Evolvement of Treasury Bonds Yields During Recent 3 Months (%)
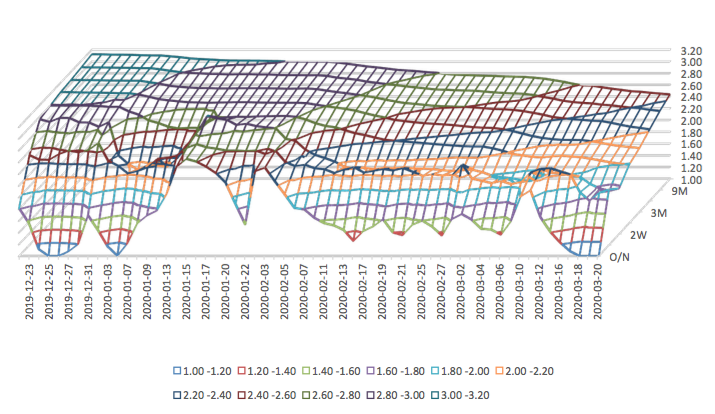
As for Shibor rates, short-term rates experienced significant fluctuation. Specifically, O/N rate experienced obvious fluctuation to 1.2%-1.4% level.
Graph 37: Term Structure Evolvement of Shibor Rates During Recent 3 Months (%)
(2) ExchangeRates
During last week, CNY/USD changed 1.051% to 7.0661 and offshore rate, CNH/USD, changed 1.51% to 7.1278 and USD index changed 3.96%.
Graph 38: USD/CNY, USD/CNH and USD Index


Currently no Comments.
Hot Topics
The 13rd China International Future Forum
The Shanghai Derivatives Energy Forum has received extensive attention from relevant industries both within and outside the borders.
Financial institutions deep explore commodity market opportunities, commodity index financial products show full-scale trend
R-Code for analysis: getKDJ
New indicator to analyze the arbitrage opportunities between sse50 and csi500
R-Code@June 06, 2016
Market review: January 11, 2017
The Great China Bubble: Anniversary Lessons and Outlook
The hedge strategy between SSE50 and A50--Jan 13,2017
Quant Investment in China A-share market
The arbitraging strategy between CSI300 and SSE50
Market review: June 17, 2016
Sleepless in London--Enda Homan(Allied Irish Banks Plc)
MSCI Rebuffs Chinese Equities for Third Time in Blow to Xi
Soros, Druckenmiller among hedgies profiting in market plunge