Market Summary:
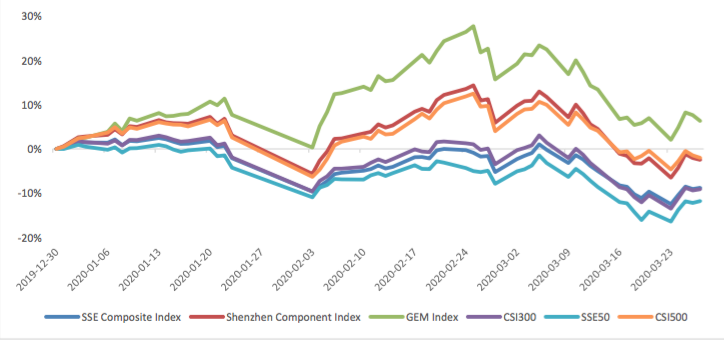
Last week, there was generally increase over the market. Shanghai SE Composite Index (000001.SH) changed 0.97 % to 2772.20. Specifically, large cap shares perform better than small cap shares and we can observe that SSE50 did better than CSI500 (-1.57% vs 2.78%). The average daily turnover of the whole market during past 5 trading days is 685.53 billion CNY, it decreased 17.56% compared with the previous 5-trading day period.
The epidemic situation is increasingly serious, international society is taking measures.
On March 26, the G20 announced that it would inject more than $5 trillion into the global economy to deal with the COVID-19 epidemic and its impact. Geng Shuang, a spokesman for China's foreign ministry, said it was a collection of policy measures that countries have taken or will take. This amount has reached the 5 trillion fiscal stimulus plan launched by the countries at the G20 meeting in response to the financial crisis in early 2009.
On March 27, 2020, the Political Bureau of the Central Committee is holding a meeting. The meeting analyzed the novel coronavirus pneumonia epidemic prevention and control and economic operation situation, and studied and deployed further coordination to promote epidemic prevention and control and economic and social development. It says "ensure to achieve the decisive task of building a moderately prosperous society in an all-round way" means that the goal of doubling GDP is still adhered to. The economic growth goal in 2020 may be set at about 5.5%. In the case of a negative GDP growth rate in the first quarter, a very strong demand stimulus policy is needed.
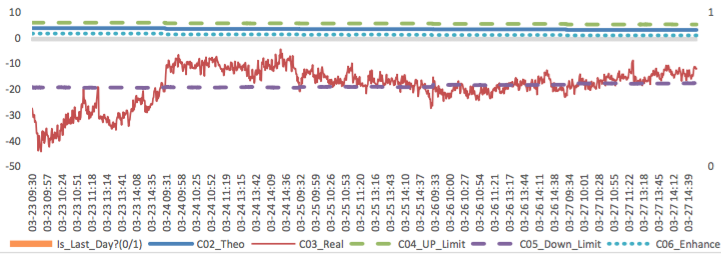
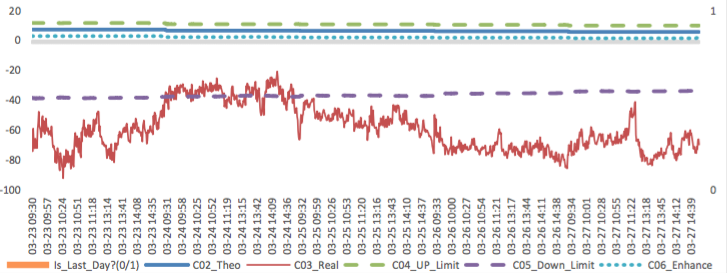
As for arbitrage opportunity, all futures current-month contracts show some room for arbitrage opportunities. All price spread for next-month/current month contracts show room for arbitrage.
News:
(1) Wind: Recently, Zhong Shan, Minister of Commerce, telephoned EU Trade Commissioner Hogan and internal market commissioner Breton to exchange views on strengthening international cooperation in epidemic prevention and control and deepening bilateral economic and trade relations. Zhong Shan said that China is willing to work with the European side to implement the consensus of the leaders of both sides, so that anti epidemic materials can be put into use in Europe as soon as possible and more people's lives can be saved. China is willing to overcome difficulties, provide assistance to the EU within its capabilities, work with the EU to accelerate the promotion of various economic and trade agendas, safeguard the multilateral trade system with the WTO as the core, and promote the healthy and stable development of bilateral economic and trade relations.
(2) First Finance: the Political Bureau meeting set the core task of monetary policy regulation: to reduce the interest rate of loan market. It is expected that LPR will be further reduced, and the reduction of the benchmark deposit rate seems to be closer. However, many experts believe that the central bank will not cut interest rates quickly and substantially.
(3) CCTV news: a new study on the new coronavirus by American scientists shows that the virus that causes the global pandemic is naturally produced. According to an analysis of the evidence published in the journal Nature Medicine, the new coronavirus "is neither constructed in the laboratory nor purposefully manipulated by humans". Although many people believe that the virus originated in a seafood market in Wuhan, China, Robert Gary, a professor at the school of medicine, Dulan University, one of the authors of the paper, said: "our analysis, as well as some other analyses, points to an earlier origin. There must be some cases in Wuhan, but they are not the source of the virus. "
(4) Securities China: since March, overseas markets have plummeted, and domestic funds for bottom copying are eager to move, but they have met with a closed door. More and more QDII funds have successively issued announcements to restrict large-scale purchase transactions, and some even suspend purchase in an all-round way. Statistics show that nearly 50 QDII funds have announced the suspension of subscription or large-scale subscription, most of which are due to foreign exchange limit.
(5) According to the overall work plan of the CSRC on the new third board reform, on March 28, 2020, the national stock transfer company organized and carried out the technical system clearance test for the public offering, continuous bidding and other businesses involved in the second phase of the comprehensive deepening reform of the new third board, and the core technical systems of all participating institutions met the online requirements. On March 30, 2020, the new third board public offering and continuous bidding and other business systems will be officially launched.
(6) Xinhua News Agency published a commentator's article, saying that at present, the prevention and control of domestic epidemic has achieved important results in stages, but the spread of overseas epidemic is still accelerating, the input pressure of China's epidemic continues to increase, and economic development, especially the recovery of industrial chain, is facing new challenges. At this time, we must take stock of the situation and recognize the changes. We should not only improve our epidemic prevention and control strategies and response measures in time, focus on the input of external prevention and the rebound of internal prevention, and continue to grasp the key work of epidemic prevention and control; but also speed up the resumption of production on the basis of epidemic prevention, and comprehensively do a good job in the "six stability" work, so that we can grasp both hands and make no mistake, and strive to complete the whole year's objectives and tasks of economic and social development.
1. StockMarket
(1) Indices Performance
During last week, Shanghai SE Composite Index (000001.SH) changed 0.97 % to 2772.20, Shenzhen Component Index (399001.SZ) changed -0.40 % to 10109.91, ChiNext Price Index (399006.SZ) changed - 0.58 % to 1903.88, CSI 300 INDEX (000300.SH) changed 1.56 % to 3710.06, CSI SmallCap 500 index (000905.SH) changed -1.57 % to 5137.34, SSE 50 Index (000016.SH) changed 2.78 % to 2701.44.
Graph 1: Indices Performance over past 3 months
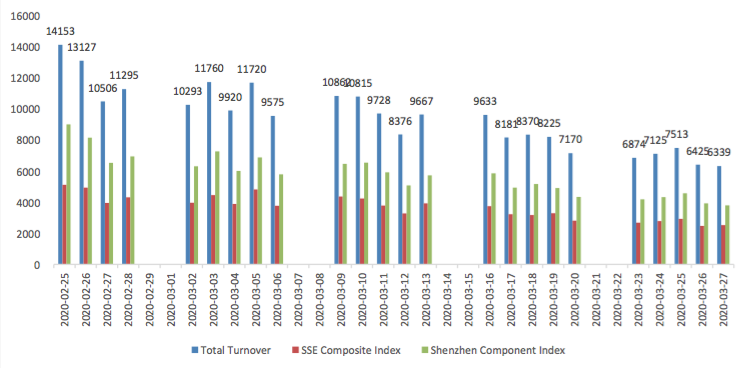
The average daily turnover of the whole market during past 5 trading days is 685.53 billion CNY, it decreased 17.56% compared with the previous 5-trading day period.
Graph 2: Market turnover
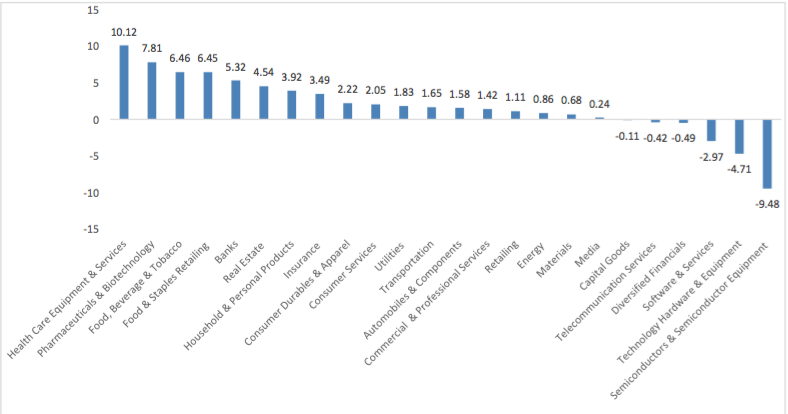
In the view of sectors, during last week (from 2020-03-20 to 2020-03-27), 18 of 24 Wind Level- 2 sector(s) increased while 6 sector(s) dropped. Specifically, Health Care Equipment & Services(10.12%), Pharmaceuticals & Biotechnology(7.81%) and Food, Beverage & Tobacco(6.46%) did the best performance while Semiconductors & Semiconductor Equipment (-9.48%), Technology Hardware & Equipment(-4.71%) and Software & Services(-2.97%) did the worst performance.
Graph 3: Sectors performance under Wind Level-2 classification (%)
(3) Indices Valuation (TTM)
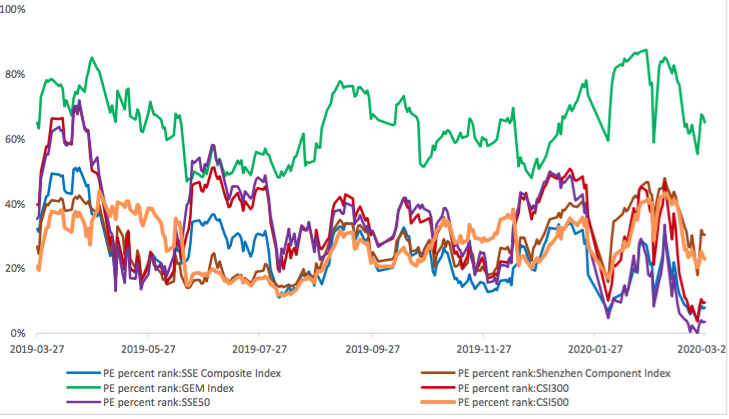
The current PE for SSE Composite Index, Shenzhen Component Index, GEM Index, CSI300, SSE50, CSI500 are 11.9053, 24.2152, 52.4781, 11.1818, 8.7337, 24.6818respectively; and these indices are at 7.90%, 30.30%, 64.90%, 9.50%, 3.50%, 22.90% percent rank level of their historic data, respectively
Graph 4: PE of 6 indices
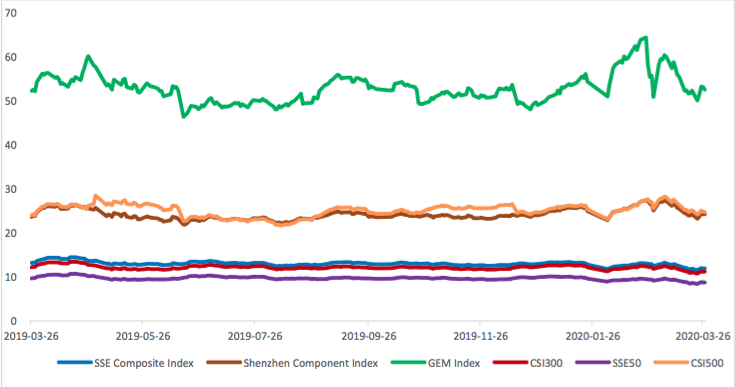
Graph 5: PE percent rank of 6 indices (calculated by data of past 1200 trading days, only 1Y data is presented on the graph)
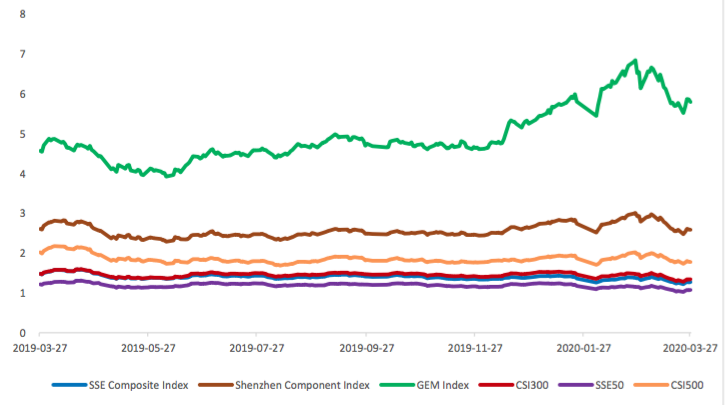
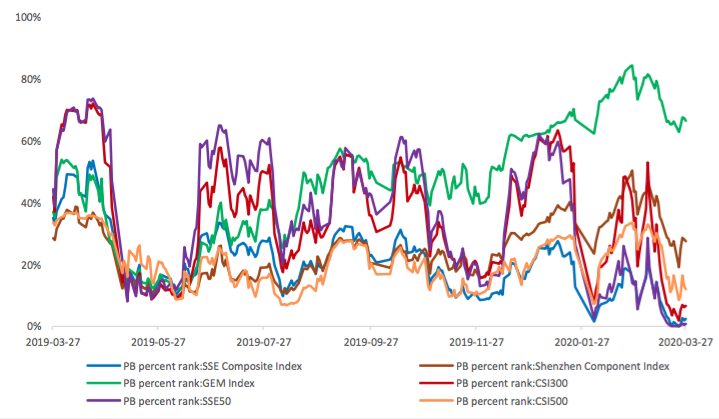
The current PB for SSE Composite Index, Shenzhen Component Index, GEM Index, CSI300, SSE50, CSI500 are 1.2695,2.5850,5.7920,1.3404,1.0740, 1.7758respectively, and these indices are at 2.40%, 27.50%, 66.50%, 6.60%, 0.80%, 12.00% percent rank level of their historic data, respectively.
Graph 6: PB of 6 indices
Graph 7: PB percent rank of 6 indices (calculated by data of past 1200 trading days, only 1Y data is presented on the graph)
(4) Foreign Fund Flow
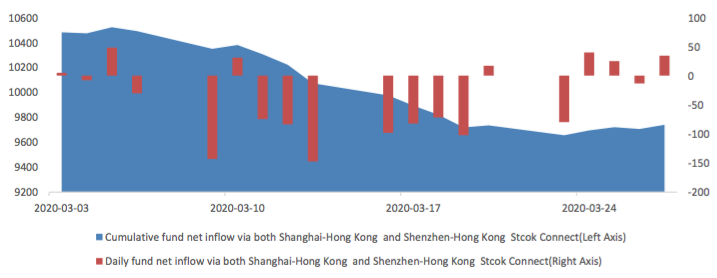
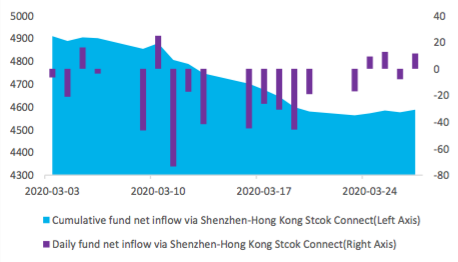
During last 5 trading days the total foreign fund flow via Stock Connect is 0.55 billion RMB, and the cumulative inflows was 974.06 billion RMB. Specifically, the fund flow via Shanghai-Hong Kong Stock Connect is -0.28 billion RMB and the fund flow via Shenzhen-Hong Kong Stock Connect is 0.83 billion RMB.
Graph 8: Fund flow via both Shanghai and Shenzhen-Hong Kong Stock Connect in past 1M (100 million CNY)
Graph 9: Fund flow via Shenzhen-Hong Kong Stock Connect in past 1M (100 million CNY)

Graph 10: Fund flow via both Shanghai-Hong Kong Stock Connect in past 1M (100 million CNY)
(5) Margin Trading
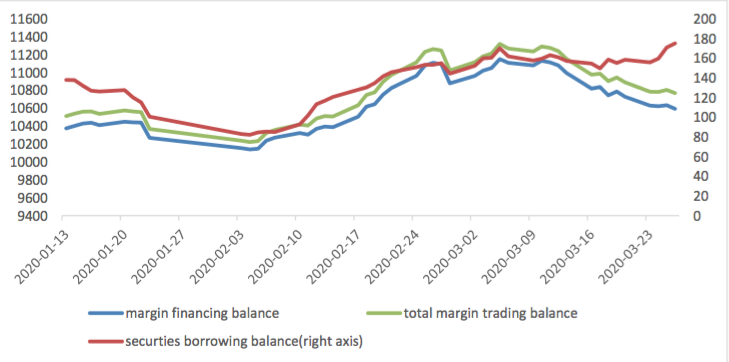
According to the newest data, the margin financing balance is 1059.47 billion, securities borrowing is
17.51 billion, totally 1076.98 billion.
Graph 11: Margin Trading(100m RMB)
2. Index Futures
(1) Trading Volume and Open Interests
During past 5 trading days the average trading volume for CSI300(IF), SSE50(IH), CSI500(IC) contracts
are 149248 (-23.08%, the previous 5-trading day period),55433 (-24.38%),159287 (-24.22%) lots, respectively. On the last trading day, the total open interests for them are 154347 (3.23%),67802 (- 2.40%),195248 (3.49%) lots respectively.
Graph 12: CSI300 Index futures’ trading volume

Graph 13: CSI300 Index futures’ open interests

Graph 14:SSE50 Index futures’ trading volume
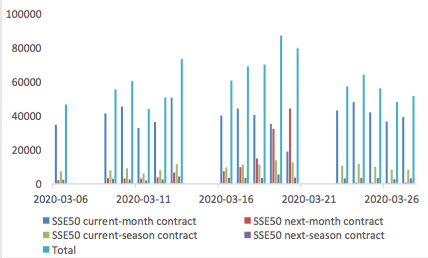
Graph 15: SSE50 Index futures’ open interests
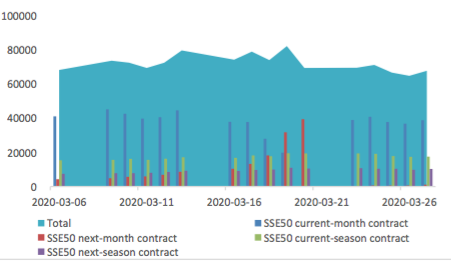
Graph 16: CSI500 Index futures’ trading volume
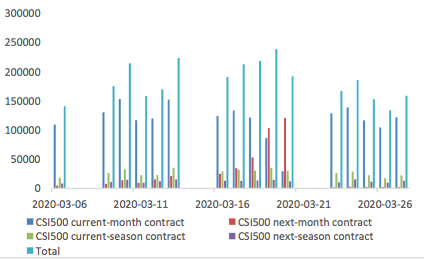
Graph 17: CSI500 Index futures’ open interests
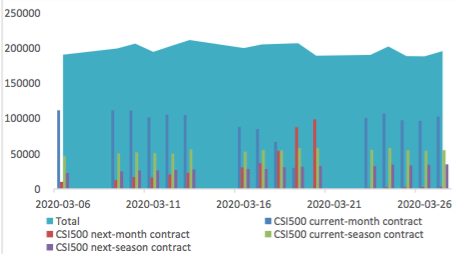
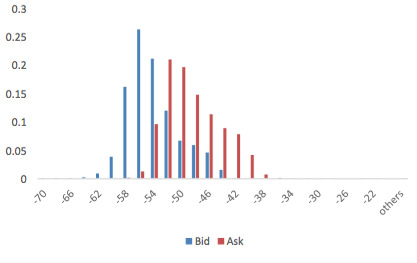
(2) Roll Level Bid-Ask Distribution Worked form last 5 trading days.
Graph 18: CSI300 Current/Next Month Contract Roll Spread Distribution (2s frequency)
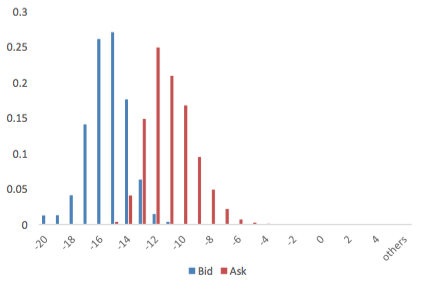
Graph 19: SSE50 Current/Next Month Contract Roll Spread Distribution (2s frequency)
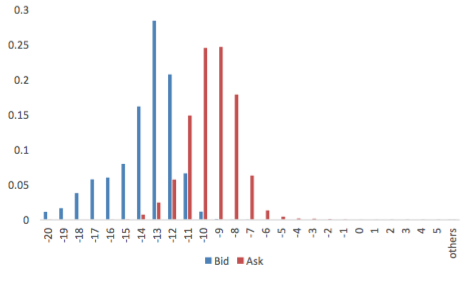
Graph 20: CSI500 Current/Next Month Contract Roll Spread Distribution (2s frequency)
Assumption: risk-free rate: 3%; security borrowing cost: 8%; trading expense for spot: 0.025%; trading expense for futures: 0.005%; margin rates for futures contracts: 0.11 for CSI300 and SSE50, 0.13 for CSI500; margin rate for security borrowing: 0.3 (or 130% maintain rate).
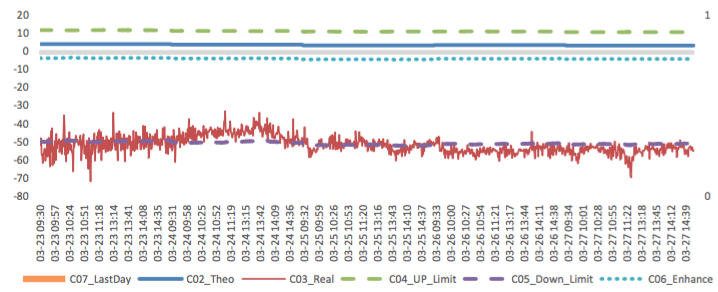
When real price spread is out of theoretical range (calculated by our assumption), there exists absolute future-spot arbitrage opportunity.
Graph 21: Future (Current Month)-Spot Arbitrage Opportunity for CSI300 contract (in the view of price difference)

Graph 22: Future (Current Month)-Spot Arbitrage Opportunity for SSE50 contract (in the view of price difference)
Graph 23: Future (Current Month)-Spot Arbitrage Opportunity for CSI500 contract (in the view of price difference)
Graph 24: Future (Next Month-Current Month) Arbitrage Opportunity for CSI300 contract (in the view of price difference)
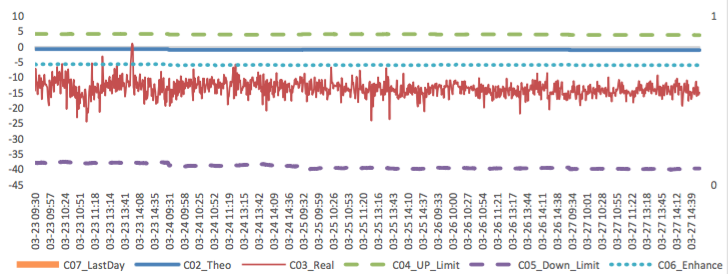
Graph 25: Future (Next Month-Current Month) Arbitrage Opportunity for SSE50 contract (in the view of price difference)
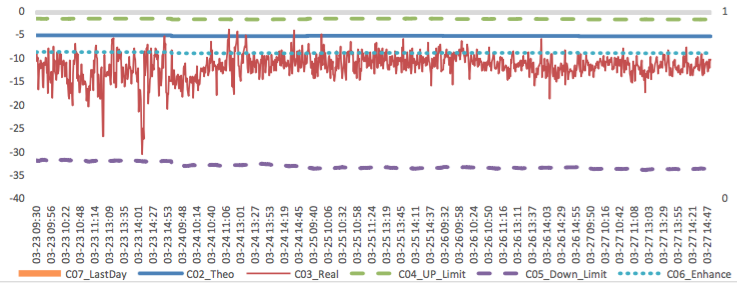
Graph 26: Future (Next Month-Current Month) Arbitrage Opportunity for CSI500 contract (in the view of price
difference)
(4) Roll Spread of Stock Index Futures Tracking
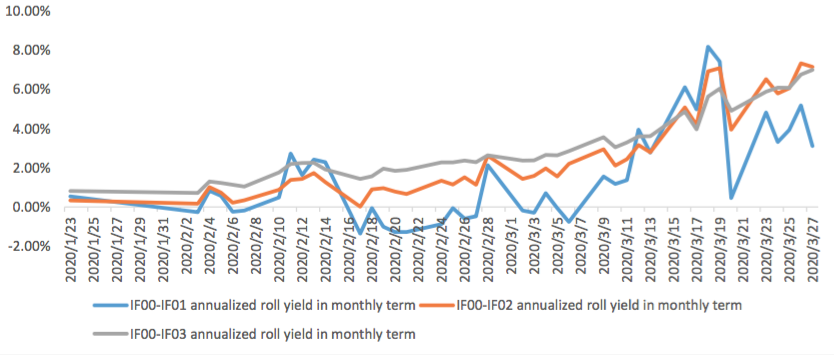
Calculated as the contract price of the current month minus the contract price of the following month, for the long roll, the positive calculation results are gains, the negative calculation results are losses. Code 00 in the figure represents the current month contract, 01 the next month contract, 02 the current quarter contract, 03 the next quarter contract.
(a)IF
Up to2020/3/27,the best roll plan is IF00-IF02,annualized roll yield in monthly term is7.15%。
Graph 27: IF Current month contract roll yield comparison (index point)

Graph 28: IF Current month contract roll yield comparison (annualized return)
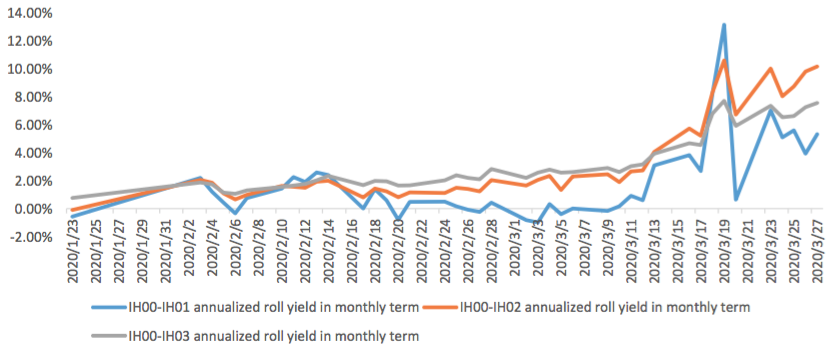
(b)IH
Up to 2020/3/27,the best roll plan is IH00-IH02,annualized roll yield in monthly term is10.17%。
Graph 29: IH Current month contract roll yield comparison (index point)
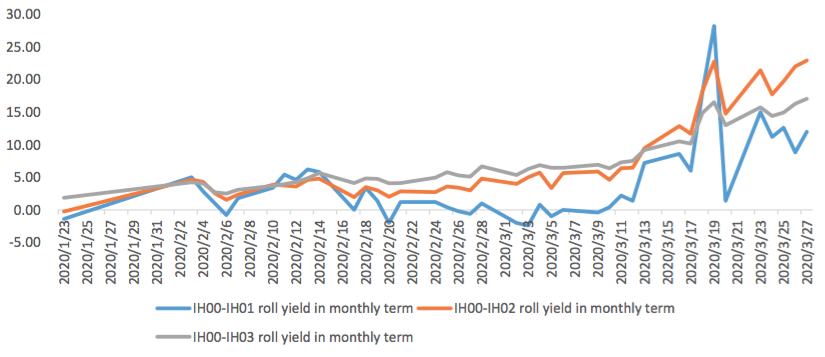
Graph 30: IH Current month contract roll yield comparison (annualized return)
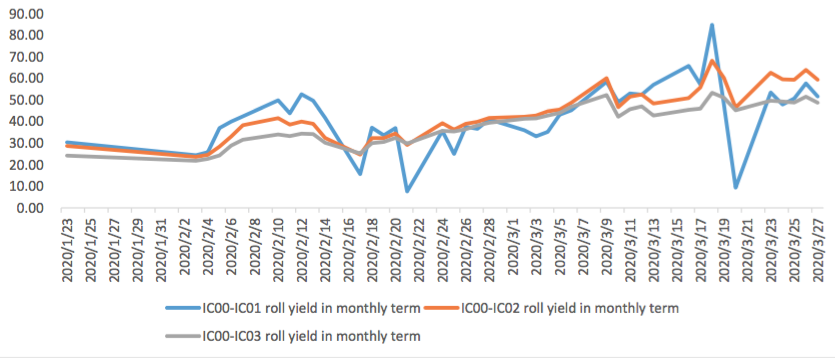
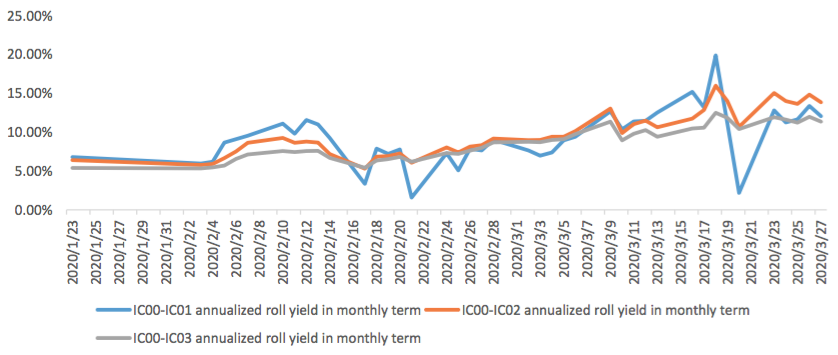
(c)IC
Up to2020/3/27,the best roll plan isIC00-IC02,annualized roll yield in monthly term is13.85%。
Graph 31: IC Current month contract roll yield comparison (index point)
Graph 32: IC Current month contract roll yield comparison (annualized return)
(5) Basis Tracking of Stock Index Futures
For long side, if the base difference is positive, the change of the base difference brings losses, and if the base difference is negative, the change of the base difference brings profits.
(a)IF
For long side hedge, up to 2020/3/27, all IF contracts were in discount. Here IF next month contract basis return annualized yield is 7.51%。
Graph 33: IF contracts basis
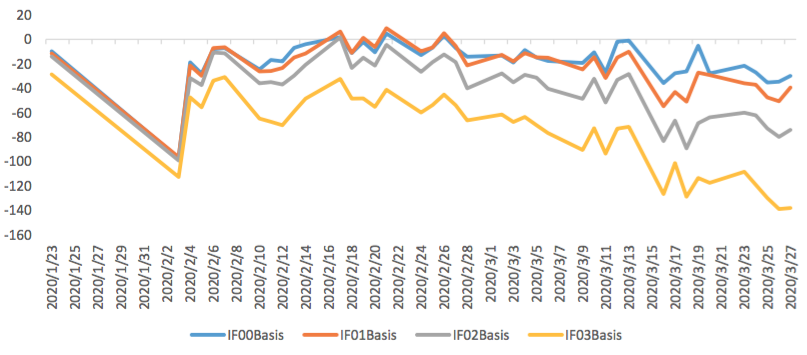
Table 1: IF basis return calculation

(b)IH
For long side hedge, up to 2020/3/27,all IH contracts were in discount. Here IH next month contract
basis return annualized yield is 6.65%。
Graph 34: IH contracts basis
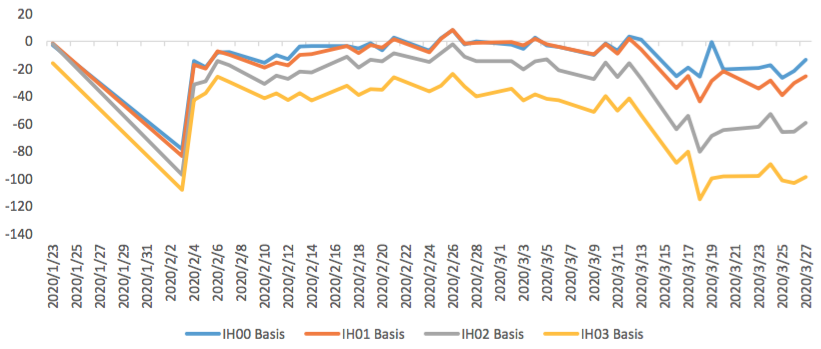
Table 2: IH basis return calculation

(c)IC
For long side hedge, up to 2020/3/27, all IC contracts were in discount. Here IC next month contract
basis return annualized yield is 18.60%。
Graph 35: IC contracts basis
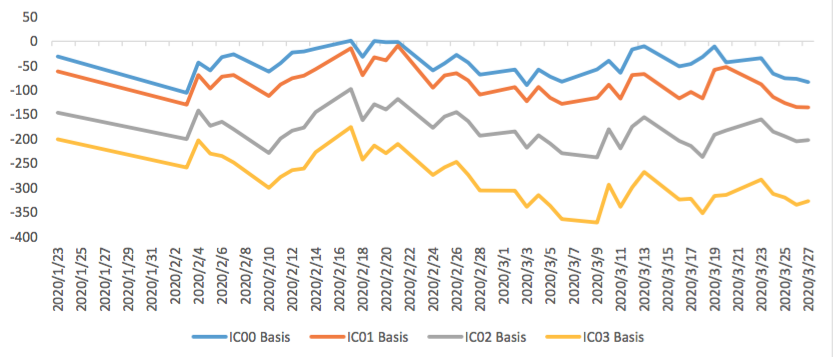
Table 3: IC basis return calculation
3. Financial Markets
(1) Interest Rates
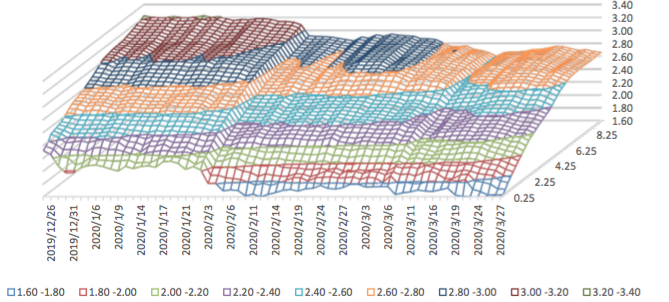
The term structure of treasury bonds’ yields is currently upward sloping in concave shape.
Specifically, last week, short-term yields short term yield of Treasury bond experienced some fluctuation and 3M yield now at 1.6%-1.8% level. Furthermore, as for long-term yield, there is a small drop. 10Y yield is about 2.8%-3.0%.
Graph 36: Term Structure Evolvement of Treasury Bonds Yields During Recent 3 Months (%)
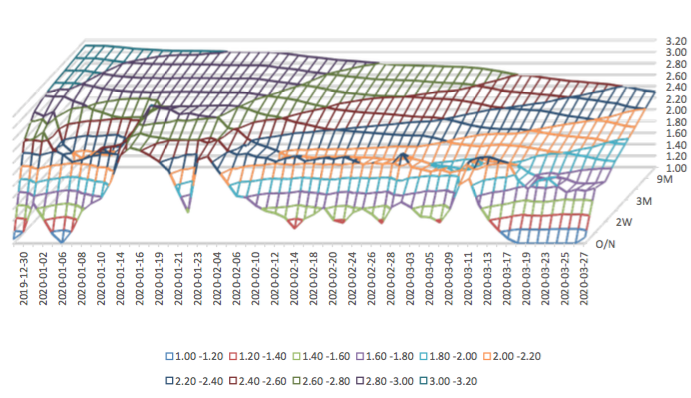
As for Shibor rates, short-term rates experienced significant fluctuation. Specifically, O/N rate experienced obvious fluctuation to 1.2%-1.4% level.
Graph 37: Term Structure Evolvement of Shibor Rates During Recent 3 Months (%)
(2) ExchangeRates
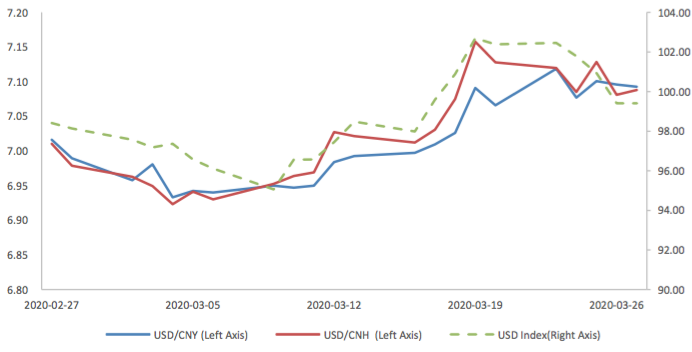
During last week, CNY/USD changed 0.378% to 7.0928 and offshore rate, CNH/USD, changed -0.56% to 7.0880 and USD index changed -2.91%.
Graph 38: USD/CNY, USD/CNH and USD Index
Macroeconomic Topic:
Due to the epidemic situation economic data show a total decrease.Data released by the National Bureau of Statistics show that in February, the added value of industries above scale decreased by 25.86% in terms of monthly year-on-year ratio, with the pre-value of -4.3%; in January-February, the national fixed assets investment decreased by 24.5% in nominal terms, with pre-value of 5.4 %; and in February, the total retail sales of consumer goods decreased by 20.5% in terms of monthly year-on-year ratio, with pre-value of 8%.
February Economic Data
(1) Fixed Assets Investment
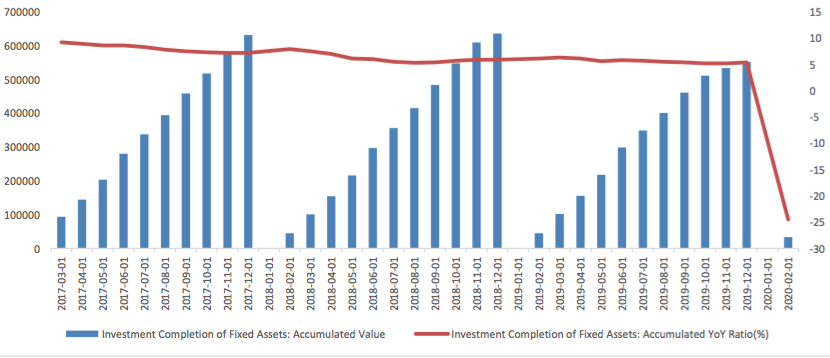
From January to February, the cumulative growth rate of fixed assets investment was -24.5% year-on- year, show a sharp decrease due to COVID-19.
Graph A: Investment Completion of Fixed Assets (100m RMB)
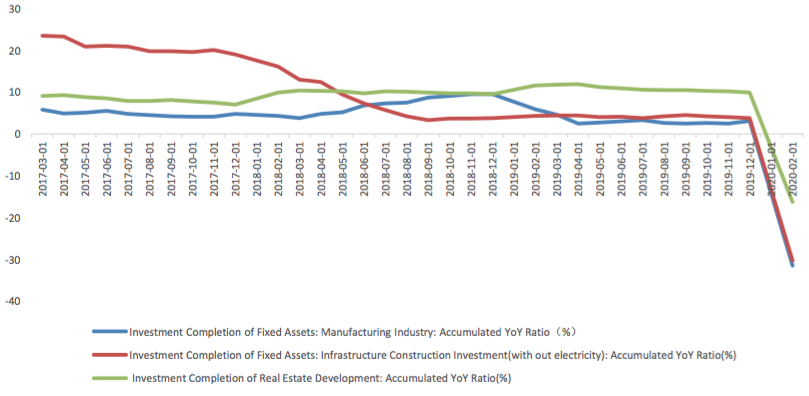
Graph B: Investment Completion of Real Estate Development, Manufacturing Industry, Infrastructure Construction
From January to February, investment in infrastructure (excluding electricity) decreased by 30.3% year- on-year, with pre-value of 3.8%.
From January to February real estate investment decreased by 16.3% year-on-year.
Graph C: Build Construction Data
From January to February, manufacturing investment decreased by 31.5% year-on-year.
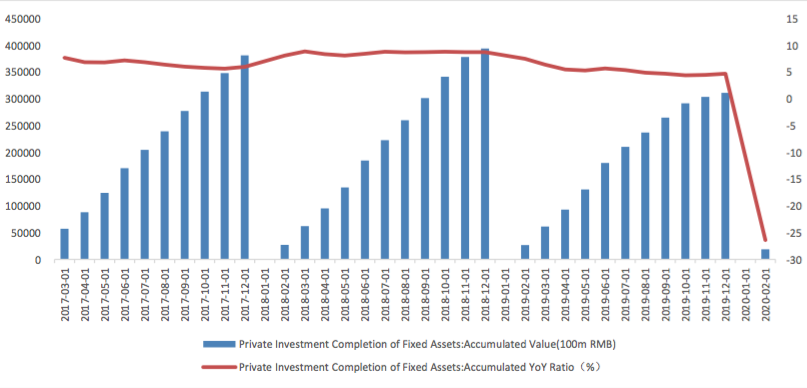
Private investment completion of fixed assets decreased. From January to February, the cumulative growth rate of private fixed assets investment was -26.4% year-on-year.
(2) Industrial Value Added
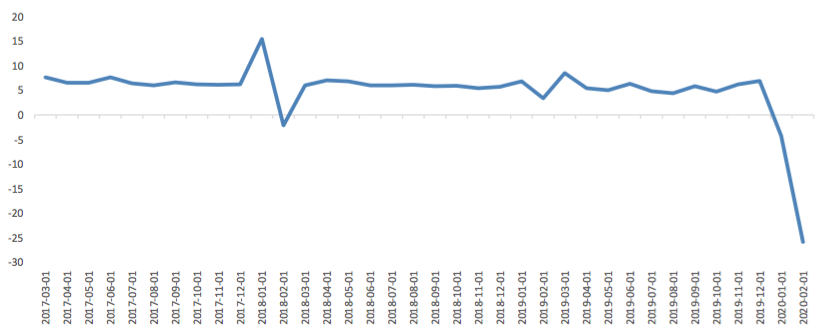
In February, the value added of industries above the designated size decreased by 25.8% year on year.
Graph E: Industrial added value above designated size: Monthly YoY Ratio (%)
(3) Consumption
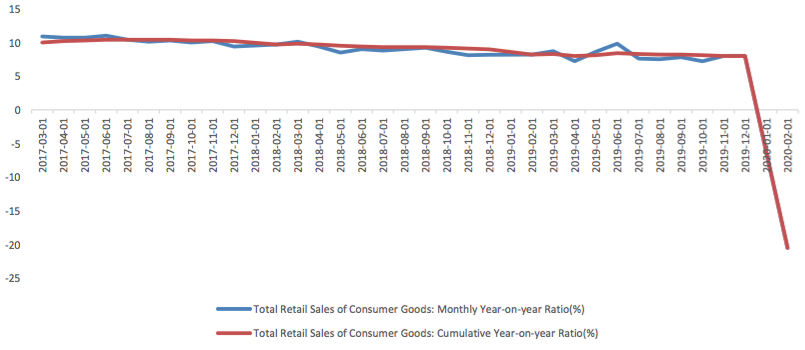
In February, the nominal growth rate of total retail sales of social consumer goods drop to -20.5% from 8%, while the cumulative growth rate in January-February also dropped to -20.5.
Graph F:Total Retail Sales of Consumer Goods

