FangQuant › Financial Futures
Market Summary:
Last week, there was generally decrease over the market. Shanghai SE Composite Index (000001.SH) changed -0.30 % to 2763.99. Specifically, large cap shares perform better than small cap shares and we can observe that SSE50 did better than CSI500 (0.27% vs -0.59%). The average daily turnover of the whole market during past 5 trading days is 589.96 billion CNY, it decreased 13.94% compared with the previous 5-trading day period.
PMI showed rebound during March. The orderly recovery of economic activities has led to a sharp recovery of PMI. PMI data is closer to the concept of a month on month ratio, so it is reasonable to recover to the vicinity of the boom and dry line. However, there may be some pressure for the year-on-year economic statistics data of March to return to normal gradually in the future.
The central bank cut reserve rate again, on April 3, the people's Bank of China announced that in order to support the development of the real economy, promote greater support for small and medium-sized enterprises, and reduce the actual cost of social financing, it decided to reduce the deposit reserve ratio by 1 percentage point for rural credit cooperatives, rural commercial banks, rural cooperative banks, rural banks and urban commercial banks operating only in the provincial administrative areas About 400 billion yuan of long-term funds were released. It is worth noting that in addition to the targeted reduction of the reserve rate, the central bank decided to cut the interest rate of excess deposit reserve of financial institutions in the central bank from 0.72% to 0.35% from April 7, which is also the 12-year interval for the central bank to reduce the interest rate of excess deposit reserve.
As for arbitrage opportunity, all futures current-month contracts show some room for arbitrage opportunities. CSI500 price spread for next-month/current month contracts show room for arbitrage.
News:
(1)Fitch: it is predicted that the global GDP will shrink by 1.9% in 2020, which means that the global copper demand will drop by 6% year on year; it is predicted that the supply of copper will still be in serious surplus, and the price is expected to drop to 5300 US dollars / ton in 2020 and 5800 US dollars / ton in 2021; the expectation of gold, coking coal and iron ore will remain unchanged, because the supply and demand situation is still consistent with the previous expectation.
(2)CSDCC issued the notice on Exemption of fees for investors to handle securities inquiry business, and decided to exempt the service fees for investors to handle various securities inquiry businesses such as Shanghai and Shenzhen market securities, national stock exchange system securities, non overseas listed shares of overseas listed companies, credit securities account details from April 7.
(3)CCTV news: at present, China's epidemic prevention situation is generally good, but the imported risks brought by the upgrading of foreign epidemic situation cannot be ignored. Low risk does not mean no risk. Everyone should remain vigilant. Recently, Zhong Nanshan, academician of the Chinese Academy of engineering, reminded everyone through the world health organization that it is very important to keep a certain distance whether at home or in the company or public places. In addition, at present, there are no gatherings or dinners.
(4)Securities Times: Yang Weizhong, director of the business management department of the people's Bank of China, introduced that as of April 2, 573 preferential interest rate loans had been issued, with an amount of 28 billion yuan, a loan weighted interest rate of 2.61%, and about 1.35% after financial discount; 70% of the funds were used to support small and medium-sized micro enterprises.
(5)General Administration of Customs: since March 1, a total of 10.2 billion yuan worth of major epidemic prevention and control materials have been released.
(6)Wangyi Finance: Guan Qingyou: at present, I don't think the Chinese stock market will fluctuate significantly. This round of sharp decline in the US stock market is due to a 12 year bull market, which has dropped by more than 30%, and is bound to squeeze out the bubble. China's stock market also fell less but rose less, with overall volatility much smaller than in Europe and the United States.
(7)Futures Daily: on April 3, the people's Bank of China announced that in order to support the development of the real economy, promote greater support for small and medium-sized enterprises, and reduce the actual cost of social financing, it decided to reduce the deposit reserve ratio by 1 percentage point for rural credit cooperatives, rural commercial banks, rural cooperative banks, rural banks and urban commercial banks operating only in the provincial administrative areas About 400 billion yuan of long-term funds were released. It is worth noting that in addition to the targeted reduction of the reserve rate, the central bank decided to cut the interest rate of excess deposit reserve of financial institutions in the central bank from 0.72% to 0.35% from April 7, which is also the 12-year interval for the central bank to reduce the interest rate of excess deposit reserve.
1. StockMarket
(1) Indices Performance
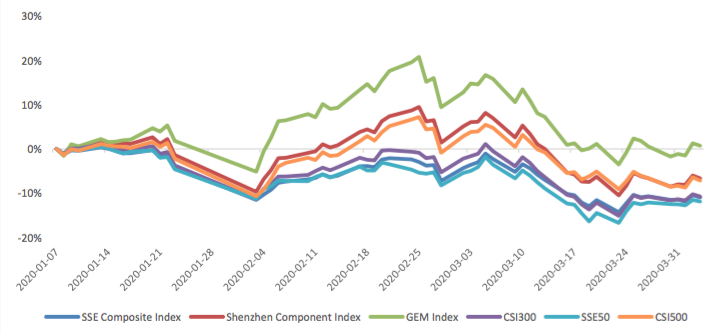
During last week, Shanghai SE Composite Index (000001.SH) changed -0.30 % to 2763.99, Shenzhen Component Index (399001.SZ) changed 0.00 % to 10110.11, ChiNext Price Index (399006.SZ) changed 0.15 % to 1906.67, CSI 300 INDEX (000300.SH) changed 0.09 % to 3713.22, CSI SmallCap 500 index (000905.SH) changed -0.59 % to 5107.04, SSE 50 Index (000016.SH) changed 0.27 % to 2708.82.
Graph 1: Indices Performance over past 3 months
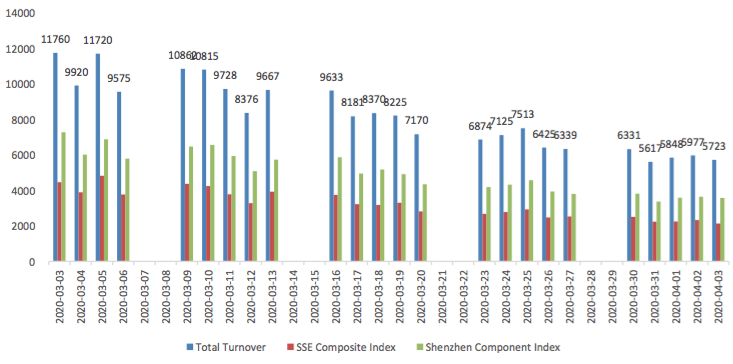
The average daily turnover of the whole market during past 5 trading days is 589.96 billion CNY, it decreased 13.94% compared with the previous 5-trading day period.
Graph 2: Market turnover
(2) Sectors Performance
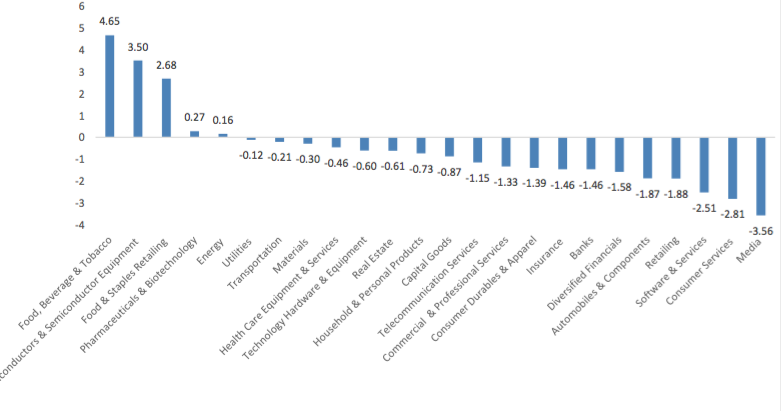
In the view of sectors, during last week (from 2020-03-30 to 2020-04-03), 5 of 24 Wind Level-2 sector(s) increased while 19 sector(s) dropped. Specifically, Food, Beverage & Tobacco(4.65%), Semiconductors & Semiconductor Equipment (3.50%) and Food & Staples Retailing (2.68%) did the best performance while Media (-3.56%), Consumer Services (-2.81%) and Software & Services(-2.51%) did the worst performance.
Graph 3: Sectors performance under Wind Level-2 classification (%)
(3) Indices Valuation (TTM)
The current PE for SSE Composite Index, Shenzhen Component Index, GEM Index, CSI300, SSE50, CSI500 are 11.7519, 24.2135, 52.5969, 11.0785, 8.6156, 24.9226respectively; and these indices are at 6.80%, 30.30%, 65.80%, 9.10%, 2.80%, 25.10% percent rank level of their historic data, respectively
Graph 4: PE of 6 indices
Graph 5: PE percent rank of 6 indices (calculated by data of past 1200 trading days, only 1Y data is presented on the graph)
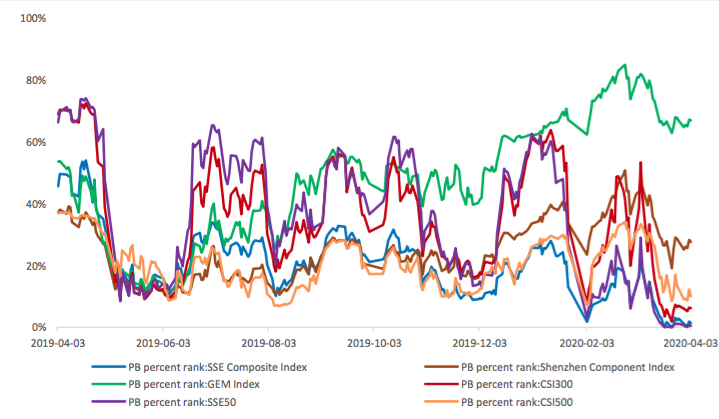
The current PB for SSE Composite Index, Shenzhen Component Index, GEM Index, CSI300, SSE50, CSI500 are 1.2526,2.5786,5.7996,1.3240,1.0564, 1.7617respectively, and these indices are at 1.30%, 27.60%, 66.90%, 6.20%, 0.50%, 10.00% percent rank level of their historic data, respectively.
Graph 6: PB of 6 indices
Graph 7: PB percent rank of 6 indices (calculated by data of past 1200 trading days, only 1Y data is presented on the graph)
(4) Foreign Fund Flow
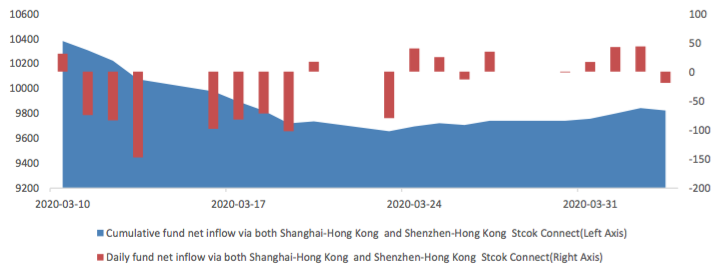
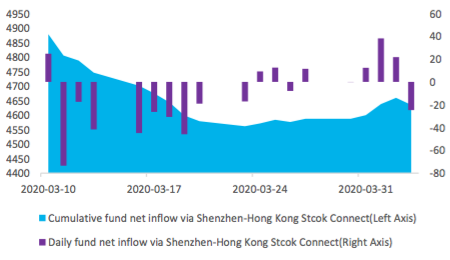
During last 5 trading days the total foreign fund flow via Stock Connect is 8.15 billion RMB, and the cumulative inflows was 982.20 billion RMB. Specifically, the fund flow via Shanghai-Hong Kong Stock Connect is 3.39 billion RMB and the fund flow via Shenzhen-Hong Kong Stock Connect is 4.76 billion RMB.
Graph 8: Fund flow via both Shanghai and Shenzhen-Hong Kong Stock Connect in past 1M (100 million CNY)
Graph 9: Fund flow via Shenzhen-Hong Kong Stock Connect in past 1M (100 million CNY)
Graph 10: Fund flow via both Shanghai-Hong Kong Stock Connect in past 1M (100 million CNY)
(5) Margin Trading
According to the newest data, the margin financing balance is 1044.32 billion, securities borrowing is
18.57 billion, totally 1062.89 billion.
Graph 11: Margin Trading(100m RMB)
2. Index Futures
(1) Trading Volume and Open Interests
During past 5 trading days the average trading volume for CSI300(IF), SSE50(IH), CSI500(IC) contracts
are 129464 (-13.26%, the previous 5-trading day period),45254 (-18.36%),145628 (-8.57%) lots, respectively. On the last trading day, the total open interests for them are 147565 (-4.39%),63650 (- 6.12%),189261 (-3.07%) lots respectively.
Graph 12: CSI300 Index futures’ trading volume
Graph 13: CSI300 Index futures’ open interests
Graph 14:SSE50 Index futures’ trading volume
Graph 15: SSE50 Index futures’ open interests
Graph 16: CSI500 Index futures’ trading volume
Graph 17: CSI500 Index futures’ open interests
(2) Roll Level Bid-Ask Distribution Worked form last 5 trading days.
Graph 18: CSI300 Current/Next Month Contract Roll Spread Distribution (2s frequency)
Graph 19: SSE50 Current/Next Month Contract Roll Spread Distribution (2s frequency)
Graph 20: CSI500 Current/Next Month Contract Roll Spread Distribution (2s frequency)
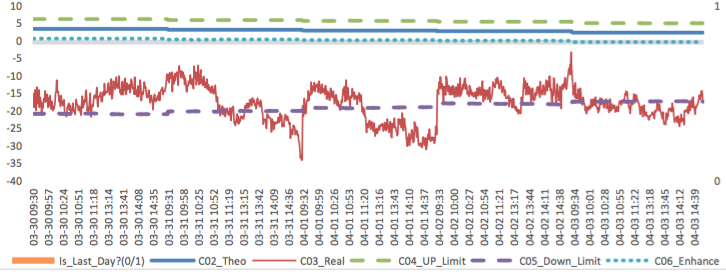
(3) Weekly Review of Future/Spot Arbitrage Opportunity
Assumption: risk-free rate: 3%; security borrowing cost: 8%; trading expense for spot: 0.025%; trading expense for futures: 0.005%; margin rates for futures contracts: 0.11 for CSI300 and SSE50, 0.13 for CSI500; margin rate for security borrowing: 0.3 (or 130% maintain rate).
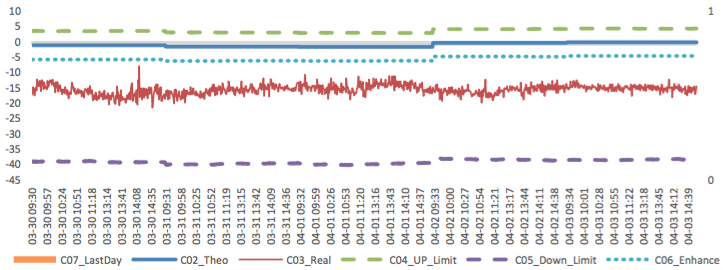
When real price spread is out of theoretical range (calculated by our assumption), there exists absolute future-spot arbitrage opportunity.
Graph 21: Future (Current Month)-Spot Arbitrage Opportunity for CSI300 contract (in the view of price difference)
Graph 22: Future (Current Month)-Spot Arbitrage Opportunity for SSE50 contract (in the view of price difference)
Graph 23: Future (Current Month)-Spot Arbitrage Opportunity for CSI500 contract (in the view of price difference)
Graph 24: Future (Next Month-Current Month) Arbitrage Opportunity for CSI300 contract (in the view of price difference)
Graph 25: Future (Next Month-Current Month) Arbitrage Opportunity for SSE50 contract (in the view of price difference)
Graph 26: Future (Next Month-Current Month) Arbitrage Opportunity for CSI500 contract (in the view of price
difference)
(4) Roll Spread of Stock Index Futures Tracking
Calculated as the contract price of the current month minus the contract price of the following month, for the long roll, the positive calculation results are gains, the negative calculation results are losses. Code 00 in the figure represents the current month contract, 01 the next month contract, 02 the current quarter contract, 03 the next quarter contract.
(a)IF
Up to2020/4/3,the best roll plan is IF00-IF02,annualized roll yield in monthly term is6.69%。
Graph 27: IF Current month contract roll yield comparison (index point)
Graph 28: IF Current month contract roll yield comparison (annualized return)
(b)IH
Up to 2020/4/3,the best roll plan is IH00-IH02,annualized roll yield in monthly term is9.30%。
Graph 29: IH Current month contract roll yield comparison (index point)
Graph 30: IH Current month contract roll yield comparison (annualized return)
(c)IC
Up to2020/4/3,the best roll plan isIC00-IC02,annualized roll yield in monthly term is13.68%。
Graph 31: IC Current month contract roll yield comparison (index point)
Graph 32: IC Current month contract roll yield comparison (annualized return)
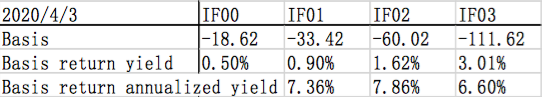
(5) Basis Tracking of Stock Index Futures
For long side, if the base difference is positive, the change of the base difference brings losses, and if the base difference is negative, the change of the base difference brings profits.
(a)IF
For long side hedge, up to 2020/4/3, all IF contracts were in discount. Here IF next month contract basis return annualized yield is 7.36%。
Graph 33: IF contracts basis
Table 1: IF basis return calculation
(b)IH
For long side hedge, up to 2020/4/3,all IH contracts were in discount. Here IH next month contract
basis return annualized yield is 8.53%。
Graph 34: IH contracts basis
Table 2: IH basis return calculation
(c)IC
For long side hedge, up to 2020/4/3, all IC contracts were in discount. Here IC next month contract
basis return annualized yield is 15.23%。
Graph 35: IC contracts basis
Table 3: IC basis return calculation
3. Financial Markets
(1) Interest Rates
The term structure of treasury bonds’ yields is currently upward sloping in concave shape.
Specifically, last week, short-term yields short term yield of Treasury bond experienced some fluctuation and 3M yield now at 1.6%-1.8% level. Furthermore, as for long-term yield, there is a small drop. 10Y yield is about 2.8%-3.0%.
Graph 36: Term Structure Evolvement of Treasury Bonds Yields During Recent 3 Months (%)
As for Shibor rates, short-term rates experienced significant fluctuation. Specifically, O/N rate experienced obvious fluctuation to 1.2%-1.4% level.
Graph 37: Term Structure Evolvement of Shibor Rates During Recent 3 Months (%)
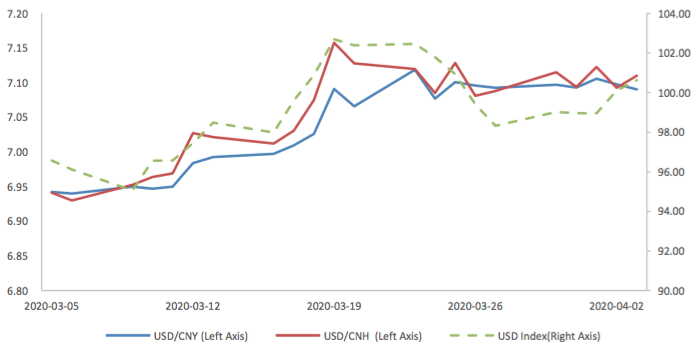
(2) ExchangeRates
During last week, CNY/USD changed -0.035% to 7.0903 and offshore rate, CNH/USD, changed 0.31% to 7.1102 and USD index changed 2.35%.
Graph 38: USD/CNY, USD/CNH and USD Index
Macroeconomic Topic:
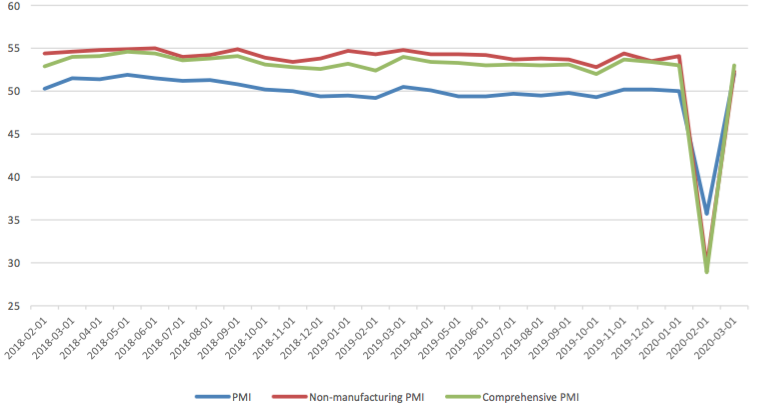
On 2020/3/31, the March PMI data was released. The data showed PMI in March rebound. The manufacturing PMI was 52 percent, with pre-value of 35.7 percent. The non-manufacturing PMI was at 52.3 percent, with pre-value of 29.6 percent, while the composite PMI was at 53 percent, with pre-value of 28.9 percent.
March PMI Data
Graph A: PMI Data
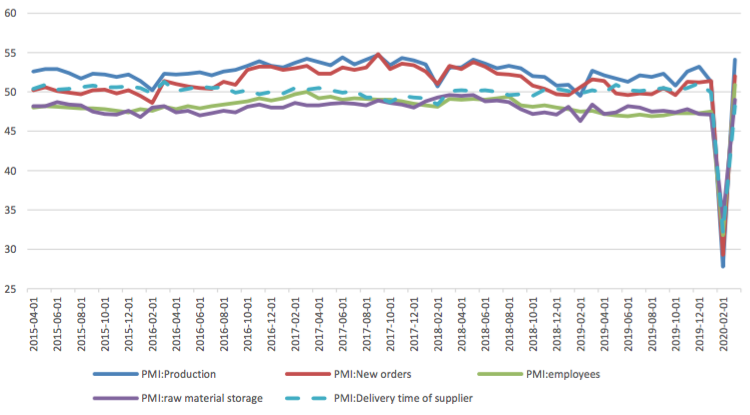
(1) About 5 Sub-indexes for manufacturing PMI calculation
PMI
Non-manufacturing PMI
Comprehensive PMI
March PMI Data
From the point of view of 5 sub-indexes: (1) the increase of PMI: new orders is a major force to promotes manufacturing PMI. It was reported at 52%, back to expansion zone, with preceding value of 29.3% and it promotes PMI for 6.81 percentage points. (2) The increase of PMI: production is another major force to promote manufacturing PMI. It was reported at 54.1%, back to expansion zone, with preceding value of 27.8% and it promotes PMI for 6.58 percentage points. (3) The increase of PMI: employees is another force to promote manufacturing PMI. It was reported at 50.9%, back to expansion zone, with preceding value of 31.8% and it promotes PMI for 3.82 percentage points. (4) The increase of PMI: raw material storage, gave another force to promote manufacturing PMI. It was reported at 49%, still in contraction zone, with preceding value of 32.1% and it promotes PMI for 1.51 percentage points. (5) The rising of PMI: delivery time of supplier, is the only force to drag manufacturing PMI. It was reported at 48.2%, still in expansion zone, with preceding value of 32.1% and it drags PMI for 2.42 percentage points.
Graph B: PMI 5 sub-indexes
Graph C: PMI Change Contribution by 5 Sub-indexes
(2) About 8 Sub-indexes not for manufacturing PMI calculation
2 of 8 sub-indexes are above 50, in expansion zone and the remaining indexes are in contraction zone.
Graph D: PMI for 8 Sub-indexes not for manufacturing PMI calculation
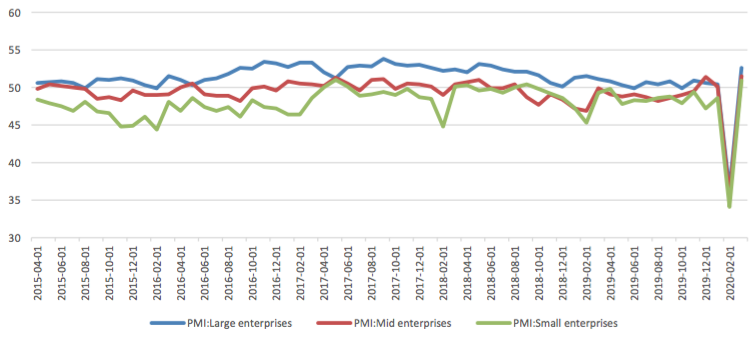
(3) PMI by enterprises size
PMI for all size enterprises rose dramatically and back to deep expansion zone
Graph E: PMI by enterprises size
(4) Summary
From late February to March, residents returned to work and economic activities showed signs of accelerated improvement, and economic "Climbing" is taking place. The orderly recovery of economic activities has led to a sharp recovery of PMI. PMI data is closer to the concept of a month on month ratio, so it is reasonable to recover to the vicinity of the boom and dry line. However, there may be some pressure for the year-on-year economic statistics data of March to return to normal gradually in the future.


Currently no Comments.
Hot Topics
The 13rd China International Future Forum
The Shanghai Derivatives Energy Forum has received extensive attention from relevant industries both within and outside the borders.
Financial institutions deep explore commodity market opportunities, commodity index financial products show full-scale trend
R-Code for analysis: getKDJ
New indicator to analyze the arbitrage opportunities between sse50 and csi500
R-Code@June 06, 2016
Market review: January 11, 2017
The Great China Bubble: Anniversary Lessons and Outlook
Quant Investment in China A-share market
The hedge strategy between SSE50 and A50--Jan 13,2017
The arbitraging strategy between CSI300 and SSE50
Market review: June 17, 2016
Sleepless in London--Enda Homan(Allied Irish Banks Plc)
MSCI Rebuffs Chinese Equities for Third Time in Blow to Xi
Soros, Druckenmiller among hedgies profiting in market plunge