FangQuant › Financial Futures
Market Summary:
Last week, there was generally decrease over the market. Shanghai SE Composite Index (000001.SH) changed 1.50 % to 2838.49. Specifically, large cap shares perform better than small cap shares and we can observe that SSE50 did better than CSI500 (2.15% vs 2.11%). The average daily turnover of the whole market during past 5 trading days is 612.94 billion CNY, it decreased 7.23% compared with the previous 5-trading day period.
The first quarter GDP is -6.8% due to epidemic situation. However, the Chinese market still has a strong attraction to global capital, and foreign capital in the stock market has returned to net inflow in the near future. In the future, China's market and RMB assets will still have a strong attraction for overseas funds, because on the whole, the long-term trend of China's economic fundamentals remains unchanged, and the domestic market still has great potential.
As for arbitrage opportunity, all futures current-month contracts show some room for arbitrage opportunities. CSI500 price spread for next-month/current month contracts show room for arbitrage.
News:
(1) Xinhua News Agency: Zhang Tao, vice president of the IMF, said recently that the COVID-19 has seriously impacted the world economic and financial system. Countries should take strong measures to deal with it, and coordinated and sustained international action is essential to promote the recovery of the world economy. He said that the IMF has received emergency financing requests from more than 100 member countries. So far, it has approved emergency financing requests from more than 20 countries at a record speed, and more will be approved in the future.
(2) Wang Yi, State Councilor and foreign minister, spoke by telephone with Tan Desai, director general of the World Health Organization. Wang Yi expressed that the Chinese government and people firmly support the World Health Organization, and the world health organization needs to continue to play an important role in fighting the epidemic. There is no factual basis for the attacks on WHO. Pressure and coercion are even more unpopular. No country with conscience will support it. China always attaches great importance to the status and role of who and is willing to increase its support for WHO through various channels on the basis of existing cooperation.
(3) Broker China: it is reported that the Bank and Insurance Regulation Commission recently issued a notice to the insurance institutions and the local regulatory pilot of insurance capital utilization, requiring the insurance institutions to carry out self inspection and self correction of capital utilization violations and risk investigation. This self inspection focuses on the illegal problems and major risks in the leading cities of insurance fund utilization. It requires insurance institutions to thoroughly investigate 54 items of insurance fund utilization business in key areas such as investment decision-making operation mechanism, fund utilization scope and mode since 2018, timely find out the stock risk, strictly control the incremental risk, and report the results of self inspection before June 30.
(4) The National Bureau of statistics released the preliminary GDP accounting results for the first quarter of 2020, in which the information transmission, software and information technology services industry increased by 13.2% year-on-year, the financial industry by 6% year-on-year, and the accommodation and catering industry by 35.3% year-on-year.
(5) According to the front page article of Securities Daily, in the face of the newly published first quarter GDP data, overall, the sudden outbreak of novel coronavirus pneumonia has indeed had a relatively large impact on China's economic operation. After all, 1.4 billion Chinese have been fighting against the epidemic for two months, which is unprecedented in Chinese history. It is inevitable that it will disturb the normal operation of the national economy. Surprisingly, after the breathtaking anti epidemic from January to February this year, the normal order of China's economic operation is recovering orderly in March this year.
1. StockMarket
(1) Indices Performance
During last week, Shanghai SE Composite Index (000001.SH) changed 1.50 % to 2838.49, Shenzhen Component Index (399001.SZ) changed 2.23 % to 10527.99, ChiNext Price Index (399006.SZ) changed 3.64 % to 2020.77, CSI 300 INDEX (000300.SH) changed 1.87 % to 3839.49, CSI SmallCap 500 index (000905.SH) changed 2.11 % to 5318.45, SSE 50 Index (000016.SH) changed 2.15 % to 2809.08.
Graph 1: Indices Performance over past 3 months
The average daily turnover of the whole market during past 5 trading days is 612.94 billion CNY, it decreased 7.23% compared with the previous 5-trading day period.
Graph 2: Market turnover
(2) Sectors Performance
In the view of sectors, during last week (from 2020-04-10 to 2020-04-17), 11 of 24 Wind Level- 2 sector(s) increased while 13 sector(s) dropped. Specifically, Insurance (4.16%), Semiconductors & Semiconductor Equipment (1.62%) and Pharmaceuticals & Biotechnology(1.47%) did the best
performance while Telecommunication Services (-4.74%), Hardware & Equipment(-1.77%) did the worst performance.
Graph 3: Sectors performance under Wind Level-2 classification (%)
(3) Indices Valuation (TTM)
The current PE for SSE Composite Index, Shenzhen Component Index, GEM Index, CSI300, SSE50, CSI500 are 12.0373, 25.5628, 55.9137, 11.3803, 8.8551, 26.3661respectively; and these indices are at 9.70%, 38.60%, 78.70%, 12.90%, 5.70%, 37.20% percent rank level of their historic data, respectively
Graph 4: PE of 6 indices
Graph 5: PE percent rank of 6 indices (calculated by data of past 1200 trading days, only 1Y data is presented on the graph)
The current PB for SSE Composite Index, Shenzhen Component Index, GEM Index, CSI300, SSE50, CSI500 are 1.2866,2.6605,6.1467,1.3619,1.0850, 1.8294respectively, and these indices are at 5.40%, 31.30%, 74.60%, 9.90%, 3.10%, 21.70% percent rank level of their historic data, respectively.
Graph 6: PB of 6 indices
Graph 7: PB percent rank of 6 indices (calculated by data of past 1200 trading days, only 1Y data is presented on the graph)
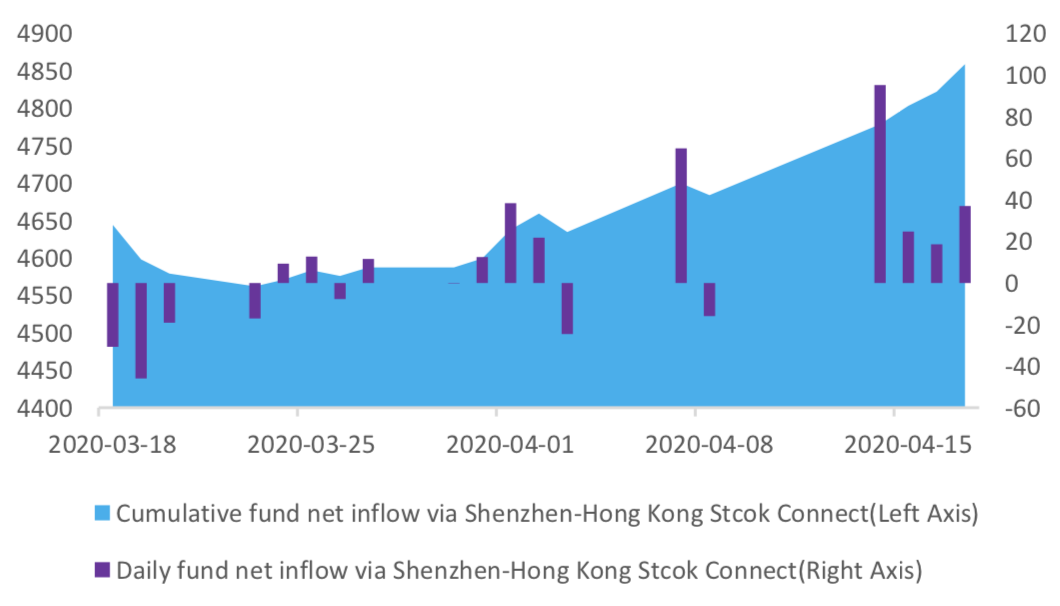
(4) Foreign Fund Flow
During last 5 trading days the total foreign fund flow via Stock Connect is 26.57 billion RMB, and the cumulative inflows was 1021.45 billion RMB. Specifically, the fund flow via Shanghai-Hong Kong Stock Connect is 10.64 billion RMB and the fund flow via Shenzhen-Hong Kong Stock Connect is 15.93 billion RMB.
Graph 8: Fund flow via both Shanghai and Shenzhen-Hong Kong Stock Connect in past 1M (100 million CNY)
Graph 9: Fund flow via Shenzhen-Hong Kong Stock Connect in past 1M (100 million CNY)
Graph 10: Fund flow via both Shanghai-Hong Kong Stock Connect in past 1M (100 million CNY)
(5) Margin Trading
According to the newest data, the margin financing balance is 1039.96 billion, securities borrowing is
20.30 billion, totally 1060.27 billion.
Graph 11: Margin Trading(100m RMB)
2. Index Futures
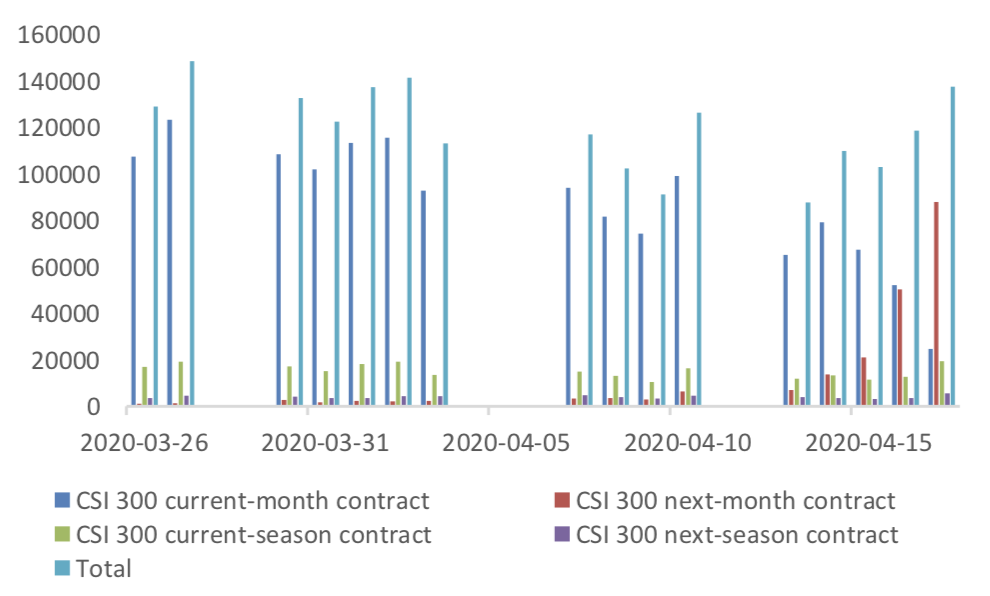
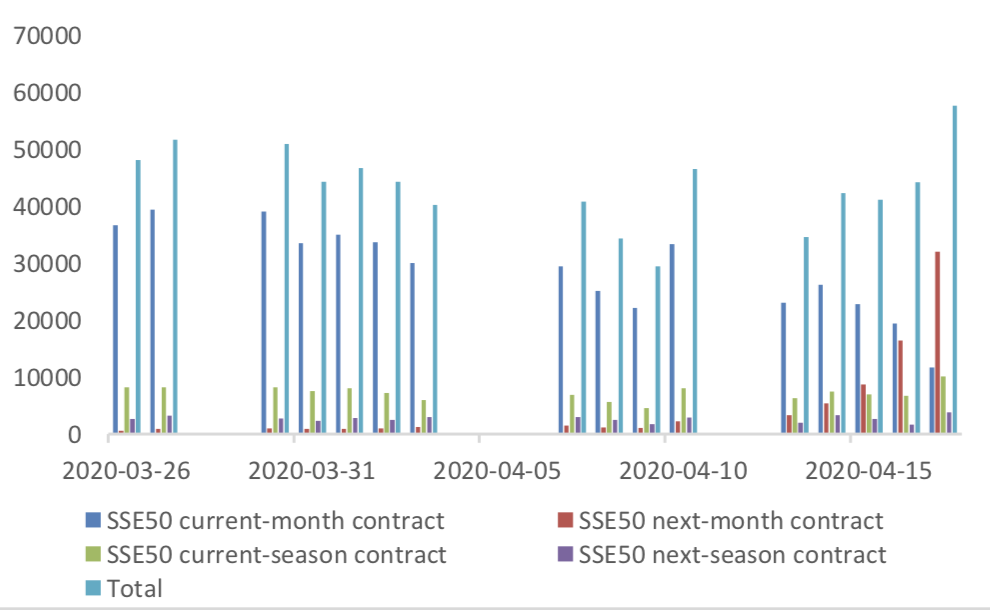
(1) Trading Volume and Open Interests
During past 5 trading days the average trading volume for CSI300(IF), SSE50(IH), CSI500(IC) contracts
are 111427 (1.21%, the previous 5-trading day period),43938 (14.91%),136982 (9.46%) lots, respectively. On the last trading day, the total open interests for them are 148113 (-5.80%),65860 (-2.27%),185313 (- 3.92%) lots respectively.
Graph 12: CSI300 Index futures’ trading volume
Graph 13: CSI300 Index futures’ open interests


Graph 14:SSE50 Index futures’ trading volume
Graph 15: SSE50 Index futures’ open interests
Graph 16: CSI500 Index futures’ trading volume
Graph 17: CSI500 Index futures’ open interests
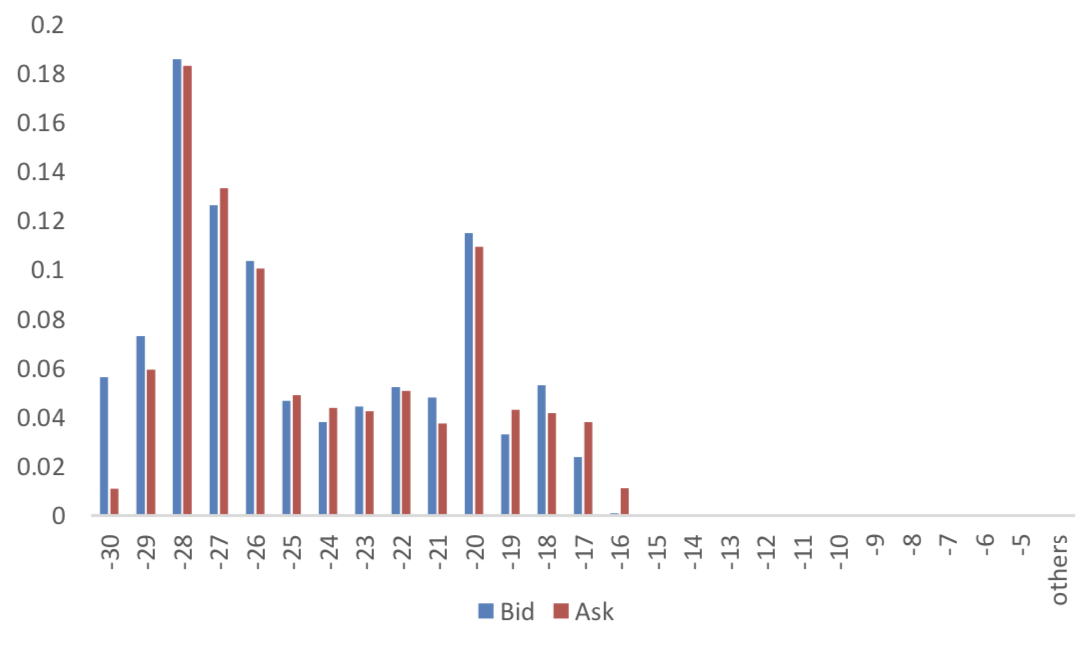
(2) Roll Level Bid-Ask Distribution Worked form last 5 trading days.
Graph 18: CSI300 Current/Next Month Contract Roll Spread Distribution (2s frequency)
Graph 19: SSE50 Current/Next Month Contract Roll Spread Distribution (2s frequency)


Graph 20: CSI500 Current/Next Month Contract Roll Spread Distribution (2s frequency)
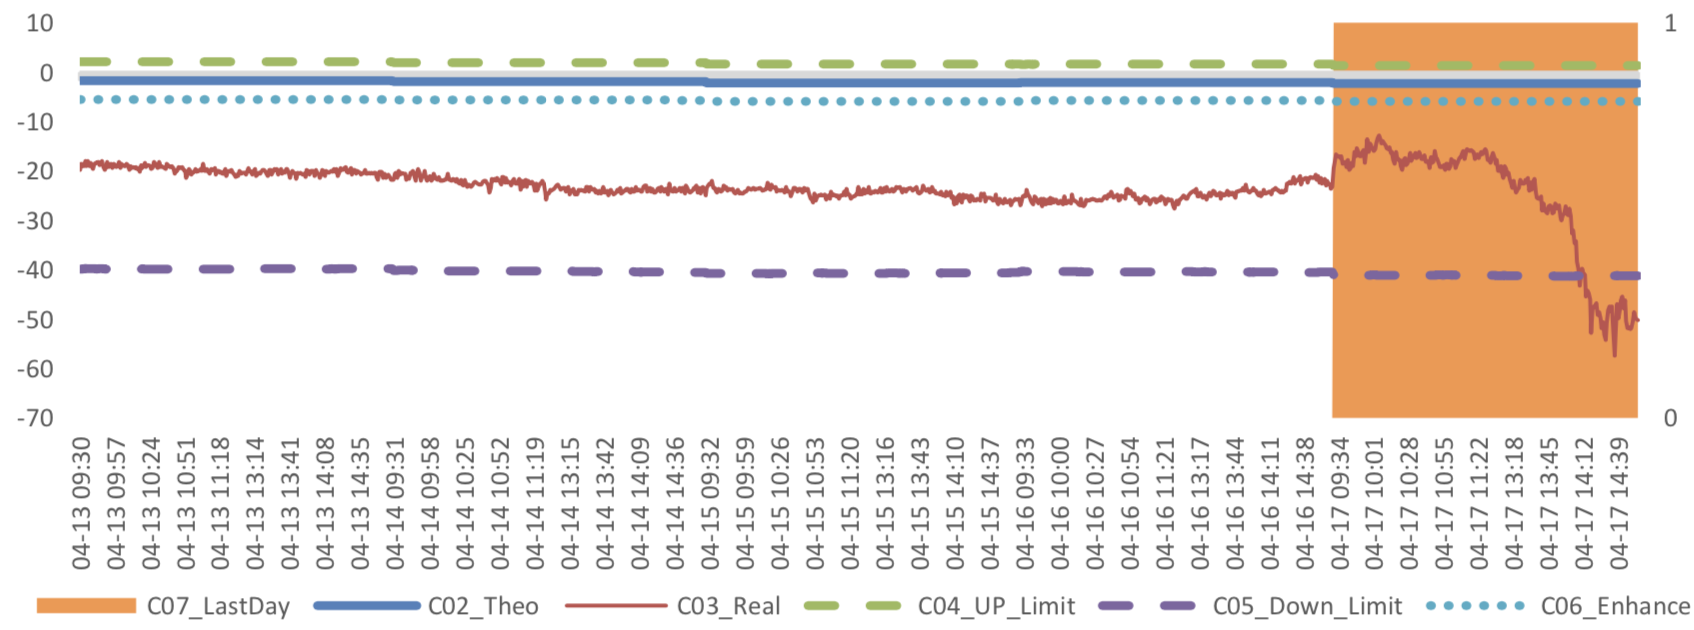
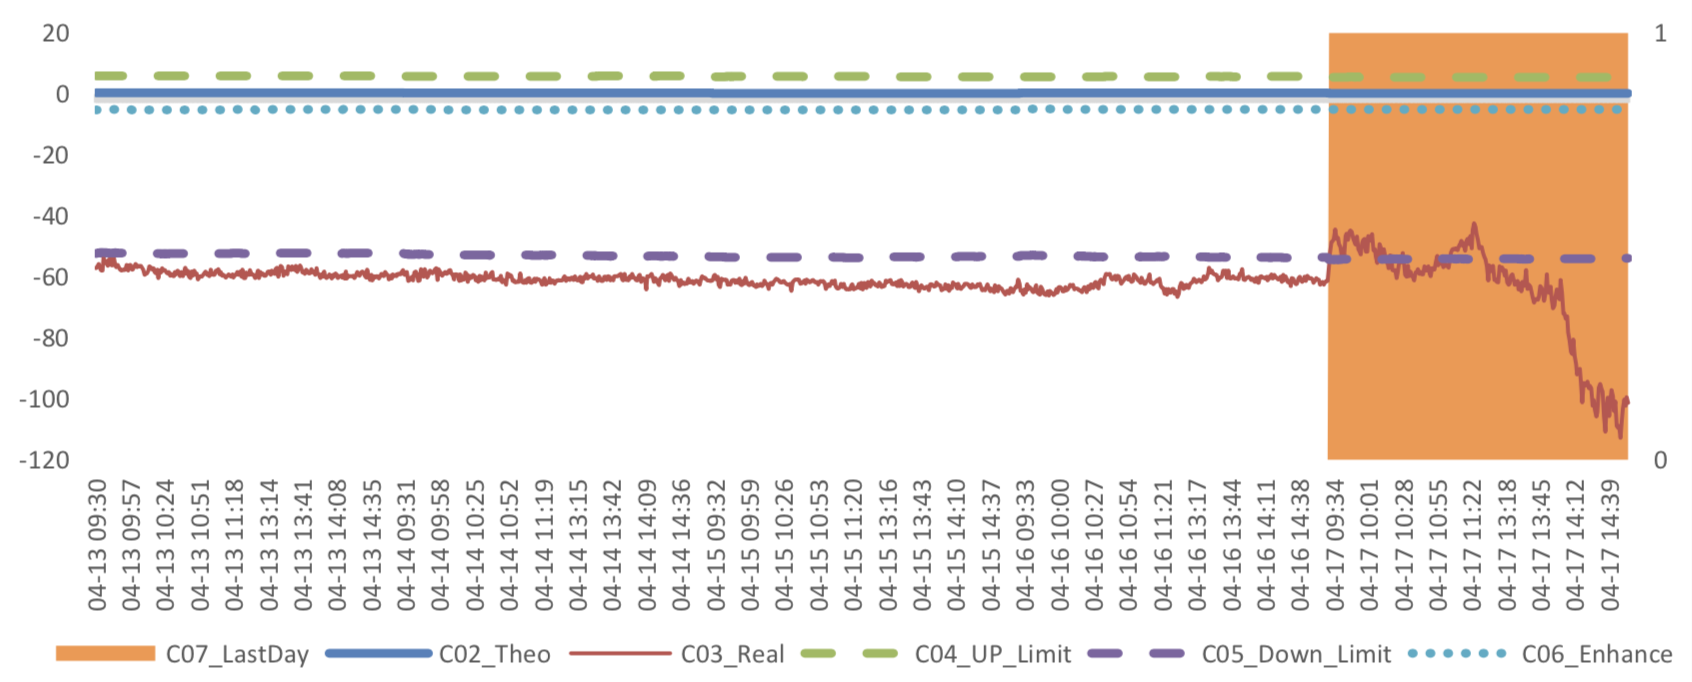
(3) Weekly Review of Future/Spot Arbitrage Opportunity
Assumption: risk-free rate: 3%; security borrowing cost: 8%; trading expense for spot: 0.025%; trading expense for futures: 0.005%; margin rates for futures contracts: 0.11 for CSI300 and SSE50, 0.13 for CSI500; margin rate for security borrowing: 0.3 (or 130% maintain rate).
When real price spread is out of theoretical range (calculated by our assumption), there exists absolute future-spot arbitrage opportunity.
Graph 21: Future (Current Month)-Spot Arbitrage Opportunity for CSI300 contract (in the view of price difference)
Graph 22: Future (Current Month)-Spot Arbitrage Opportunity for SSE50 contract (in the view of price difference)
Graph 23: Future (Current Month)-Spot Arbitrage Opportunity for CSI500 contract (in the view of price difference)
Graph 24: Future (Next Month-Current Month) Arbitrage Opportunity for CSI300 contract (in the view of price difference)
Graph 25: Future (Next Month-Current Month) Arbitrage Opportunity for SSE50 contract (in the view of price difference)
Graph 26: Future (Next Month-Current Month) Arbitrage Opportunity for CSI500 contract (in the view of price
difference)
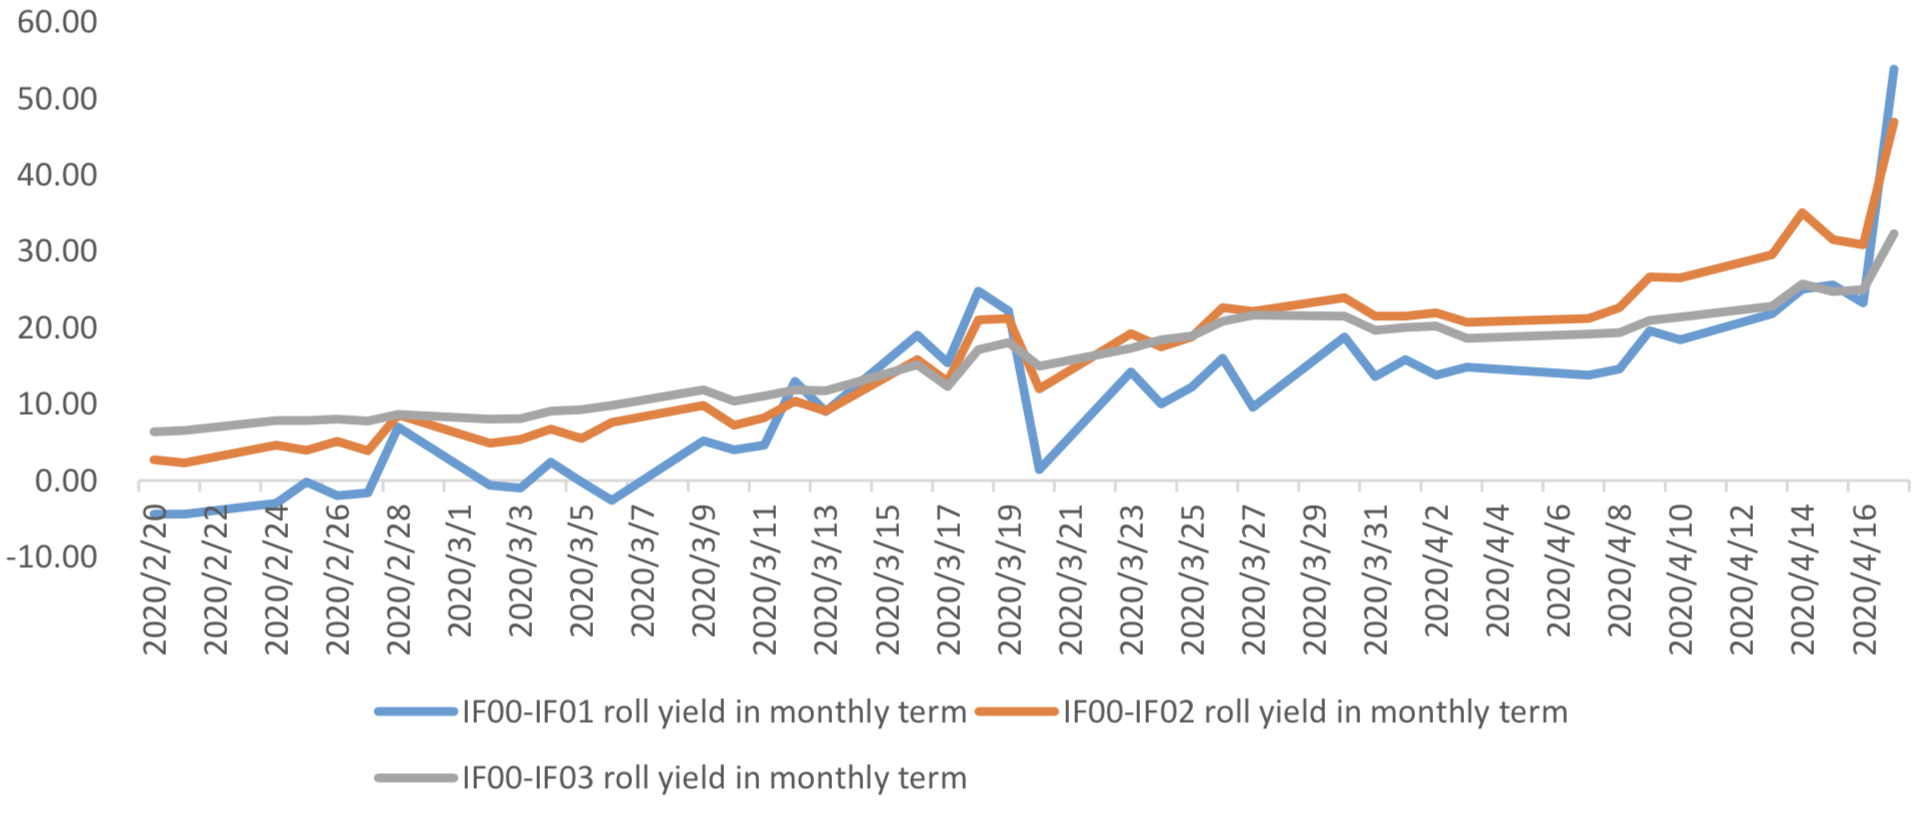
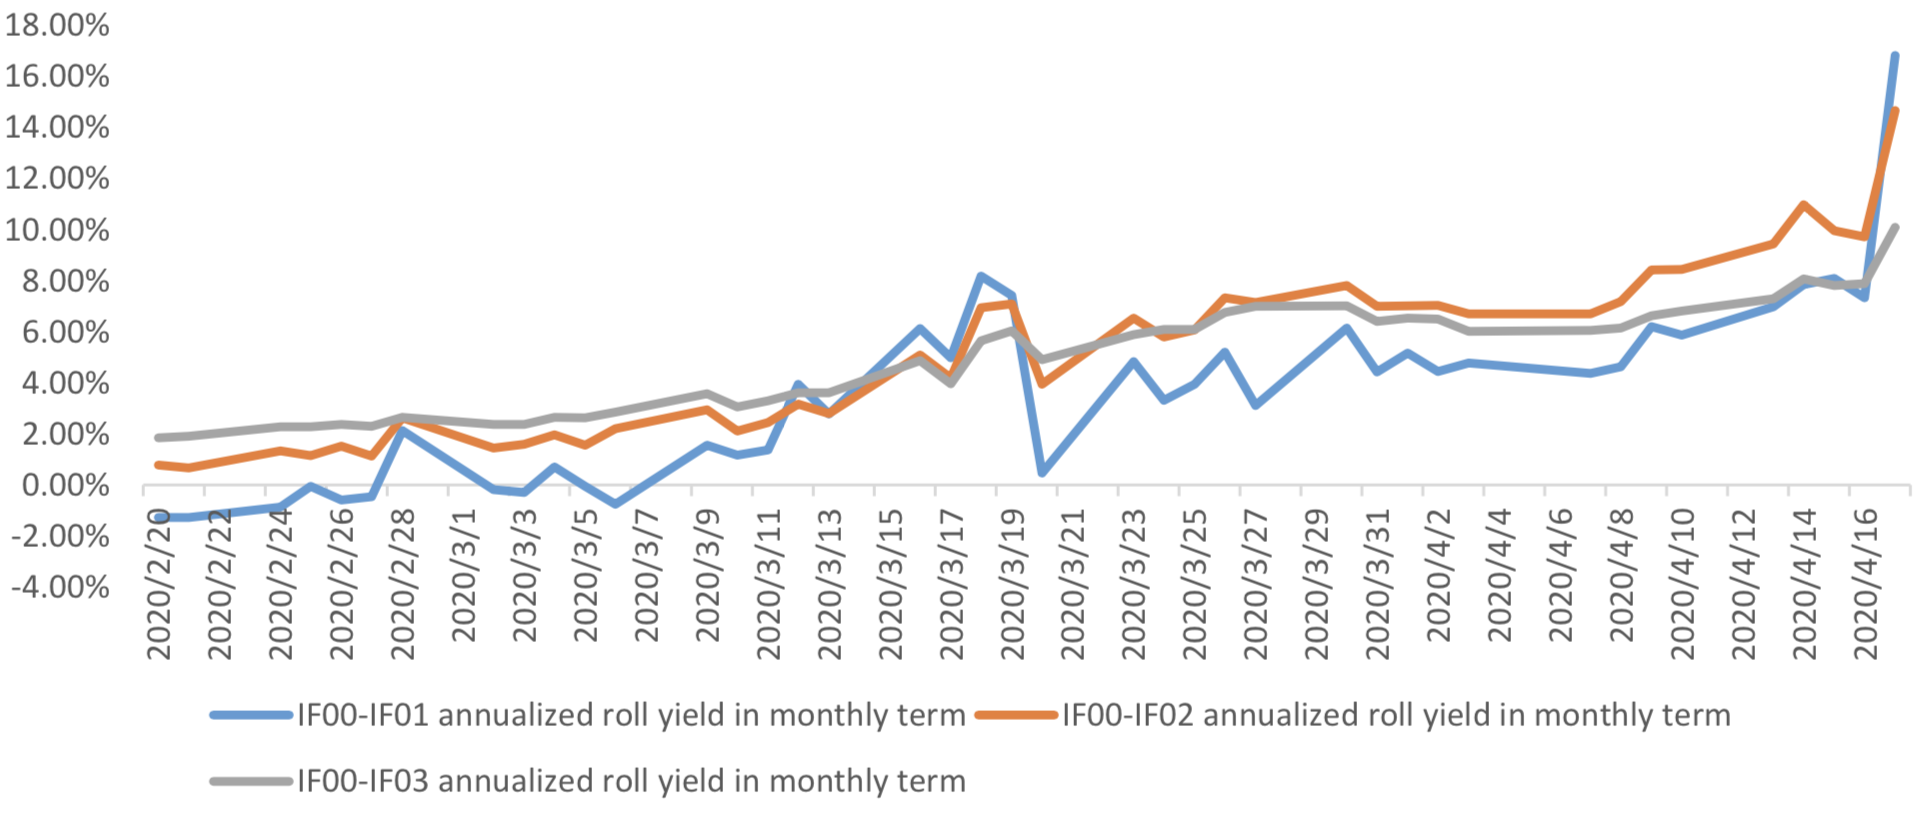
(4) Roll Spread of Stock Index Futures Tracking
(a)IF
Up to2020/4/17,the best roll plan is IF00-IF01,annualized roll yield in monthly term is16.81%。
Graph 27: IF Current month contract roll yield comparison (index point)
Graph 28: IF Current month contract roll yield comparison (annualized return)
(b)IH
Up to 2020/4/17,the best roll plan is IH00-IH01,annualized roll yield in monthly term is18.28%。
Graph 29: IH Current month contract roll yield comparison (index point)
Graph 30: IH Current month contract roll yield comparison (annualized return)
(c)IC
Up to2020/4/17,the best roll plan isIC00-IC01,annualized roll yield in monthly term is20.35%。
Graph 31: IC Current month contract roll yield comparison (index point)
Graph 32: IC Current month contract roll yield comparison (annualized return)
(5) Basis Tracking of Stock Index Futures
For long side, if the base difference is positive, the change of the base difference brings losses, and if the base difference is negative, the change of the base difference brings profits.
(a)IF
For long side hedge, up to 2020/4/17, all IF contracts were in discount except for IF00. Here IF next month contract basis return annualized yield is 13.40%。
Graph 33: IF contracts basis
Table 1: IF basis return calculation
(b)IH
For long side hedge, up to 2020/4/17,all IH contracts were in discount except for IH00. Here IH next
month contract basis return annualized yield is 15.92%。
Graph 34: IH contracts basis
Table 2: IH basis return calculation
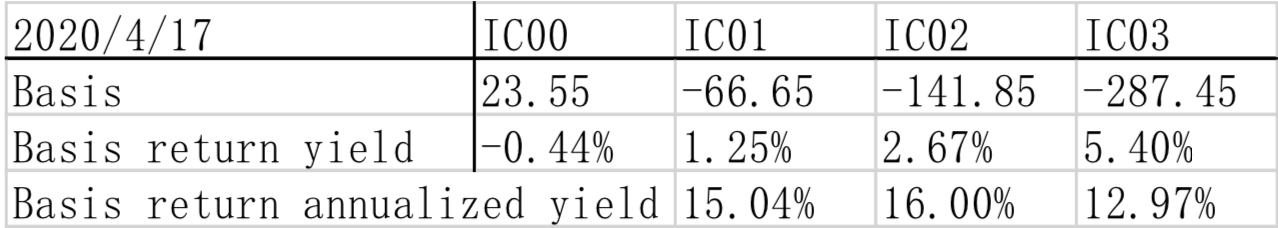
(c)IC
For long side hedge, up to 2020/4/17, all IC contracts were in discount except for IC00. Here IC next
month contract basis return annualized yield is 15.04%。
Graph 35: IC contracts basis
Table 3: IC basis return calculation


3. Financial Markets
(1) Interest Rates
Graph 36: Term Structure Evolvement of Treasury Bonds Yields During Recent 3 Months (%)
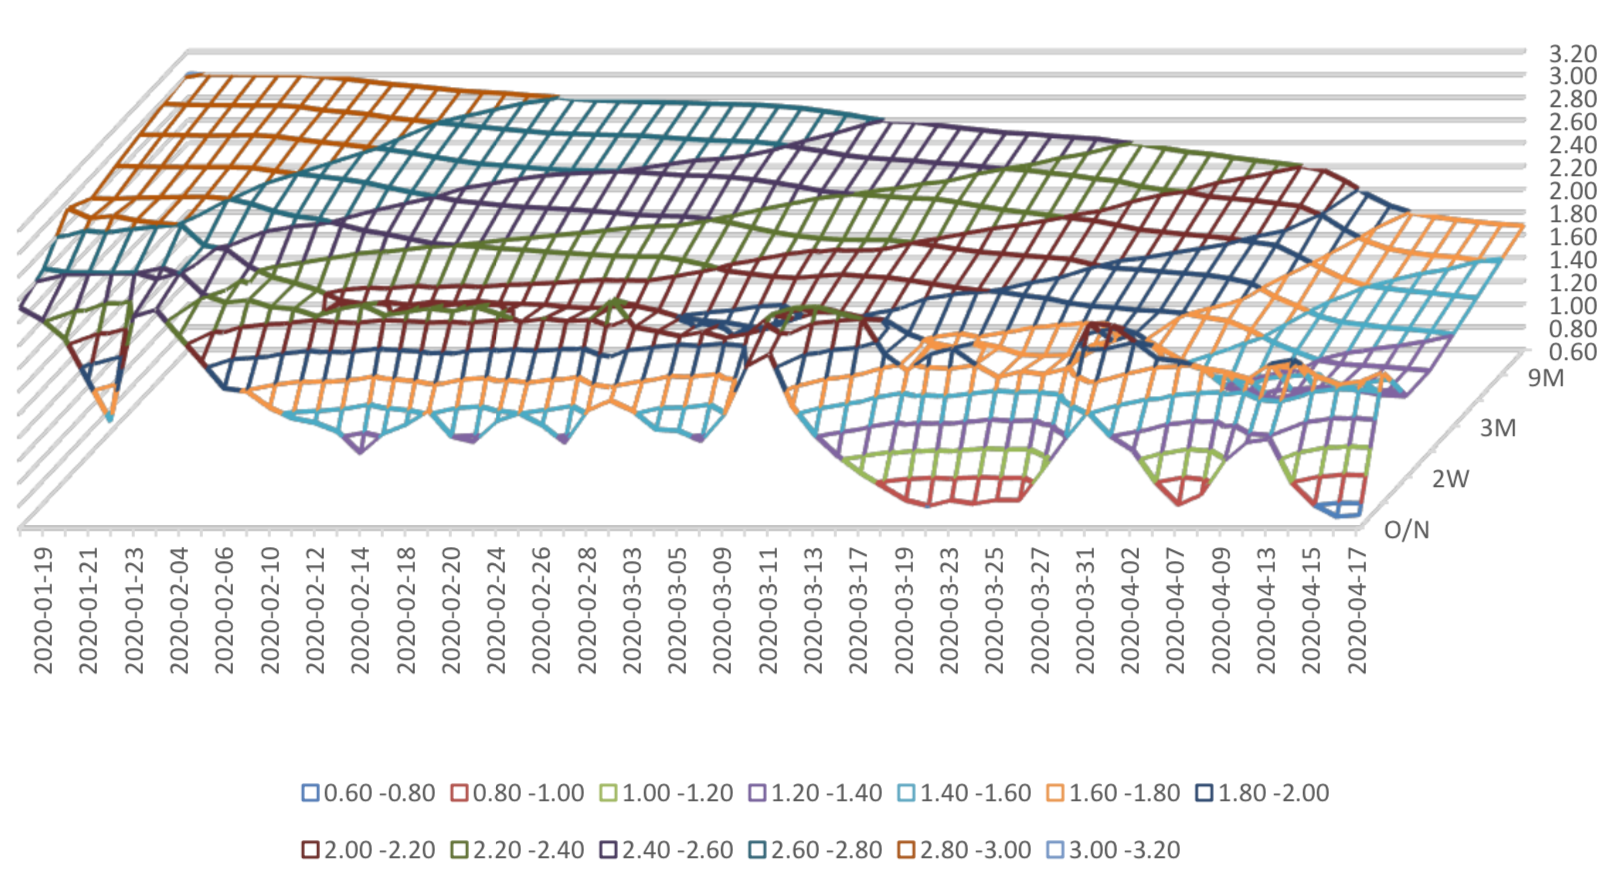
Graph 37: Term Structure Evolvement of Shibor Rates During Recent 3 Months (%)
(2) ExchangeRates
During last week, CNY/USD changed 0.576% to 7.0764 and offshore rate, CNH/USD, changed 0.48% to 7.0785 and USD index changed 0.20%.
Graph 38: USD/CNY, USD/CNH and USD Index
Macroeconomic Topic(1):
The data show that, in March, the scale of new social financing increased, reached 5149.2 billion yuan,
rose from 2960 billion yuan last year.
(1) Social Financing Data
Graph A: Total Social Financing Data(100m RMB)
March Finance Data
In on-balance-sheet financing, in terms of RMB loans, 3037.5 billion yuan was added in March, rose from 720.2 billion yuan from last month, and higher than the value, 1958.4 billion, at the same period of last year. New RMB loans accounted for 59% of the new social financing scale.
Graph B: On-balance-sheet Financing Data(100m RMB)
From the perspective of new off-balance sheet financing, it faced an obvious expansion in March.. In March it report 220.9 billion yuan, the previous value is -485.7 billion yuan.
Graph C: Off-balance-sheet Financing Data(100m RMB)
In terms of the direct financing, the direct financing of enterprises was 1000.7 billion yuan, obviously higher compared with the same period last year, 354 billion.
Graph D: Direct Financing Data(100m RMB)
(2) Monetary Data
In March, M2 rose to 10.1%, and M1 rose from4.8% to 5%, and the difference between M2 and M1 decrease from 4% to 5.1%.
Graph E: M1 and M2 data
(3) Summary
Benefiting from loose monetary policy, accelerated resumption of work and supplementary cash flow of enterprises, social finance reached a record high, with a 19 month high growth rate. In March, except for trust loans, other items of social finance improved year on year
Macroeconomic Topic(2):
According to the released price data by the national bureau of statistics. The data showed that year-on- year CPI dropped but still high. PPI is still in deflation region. The data showed that the year-on-year and ring ratio CPI were 4.3 percent and -1.2 percent, respectively, compared with pre value of 5.2 percent and 0.8 percent, respectively. Year-on-year and ring ratio PPI were -1.5 percent and -1 percent, respectively, compared with the previous figures of -0.4 percent and -0.5 percent, respectively.
March Price Data
(3) CPI Data
Graph A: CPI Data
The main reason for CPI drop is the food price. Food CPI dropped to 18.3 year-on-year, while non-food CPI is 0.7%. The core CPI rose 1.2%.
Graph B: year-on-year CPI: by Food, Non-Food, Core, Services, Consumer Goods (%)
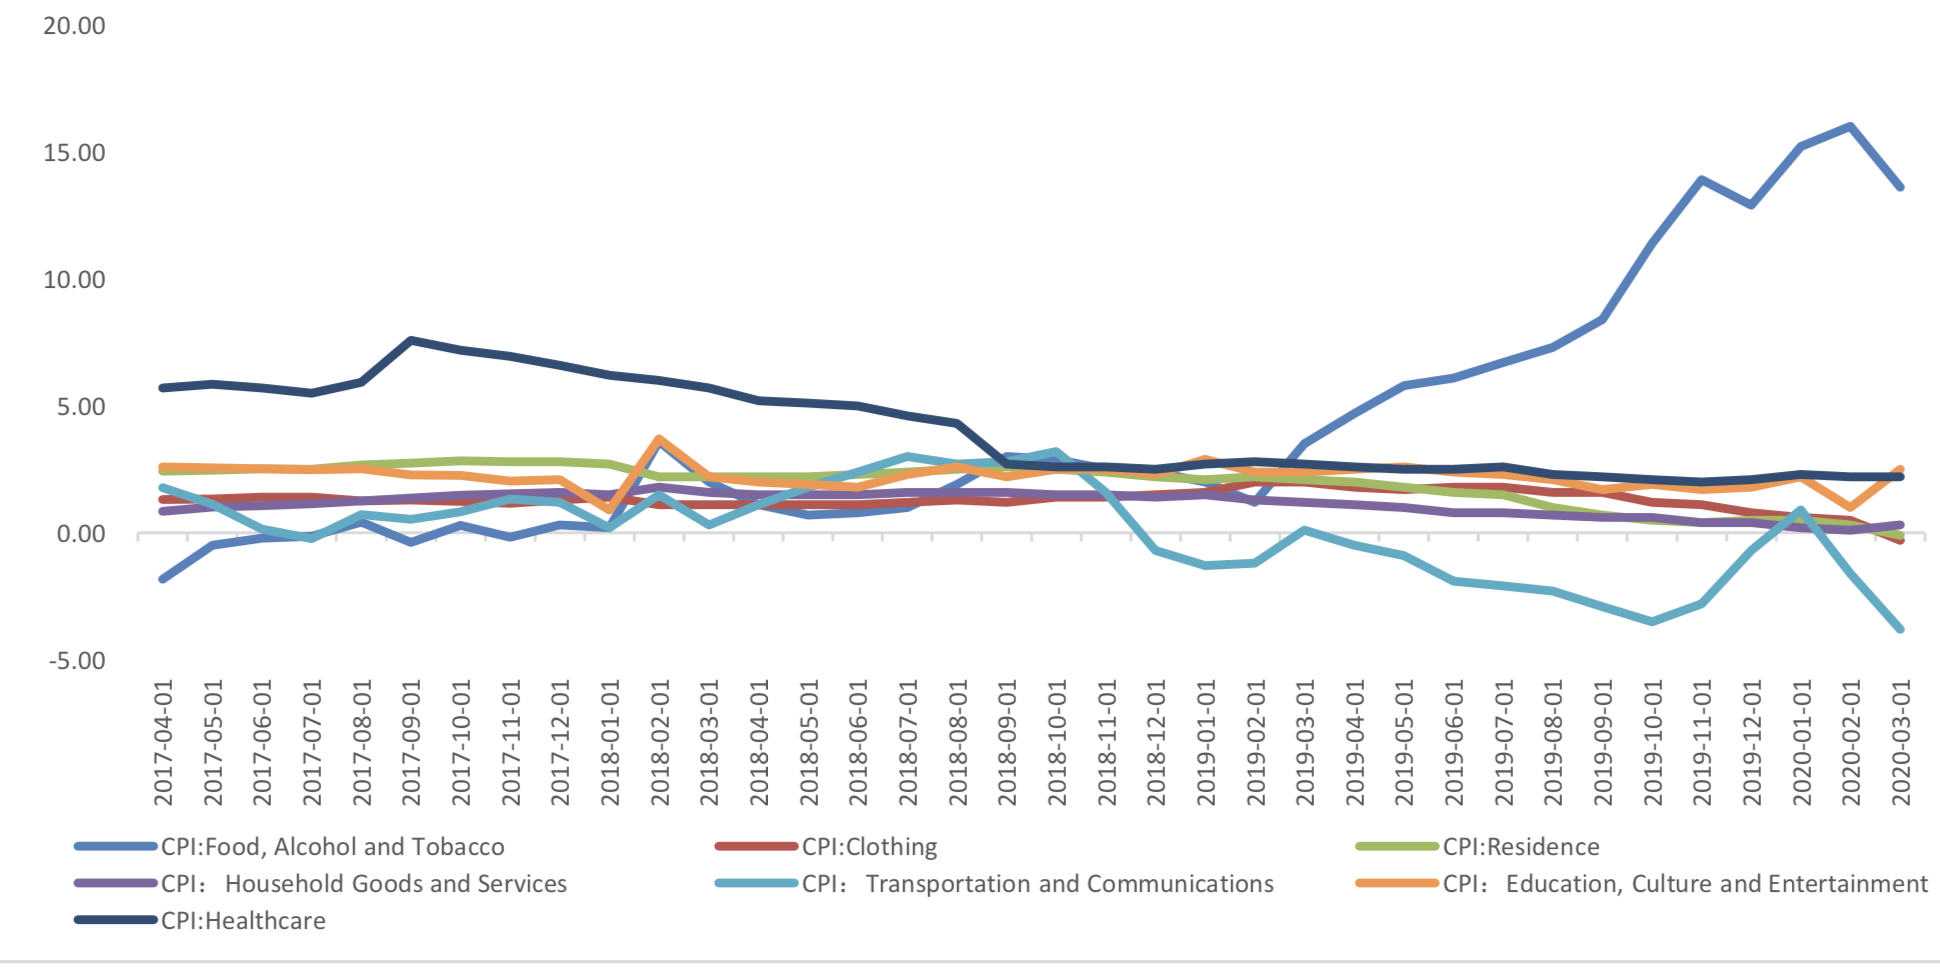
Graph C: year-on-year CPI: by Food Alcohol and Tobacco, Clothing, Residence, Household Goods & Services, Transportation & Communications, Education, Culture & Entertainment, Healthcare (%)


(4) PPI Data
Graph D: PPI Data (%)
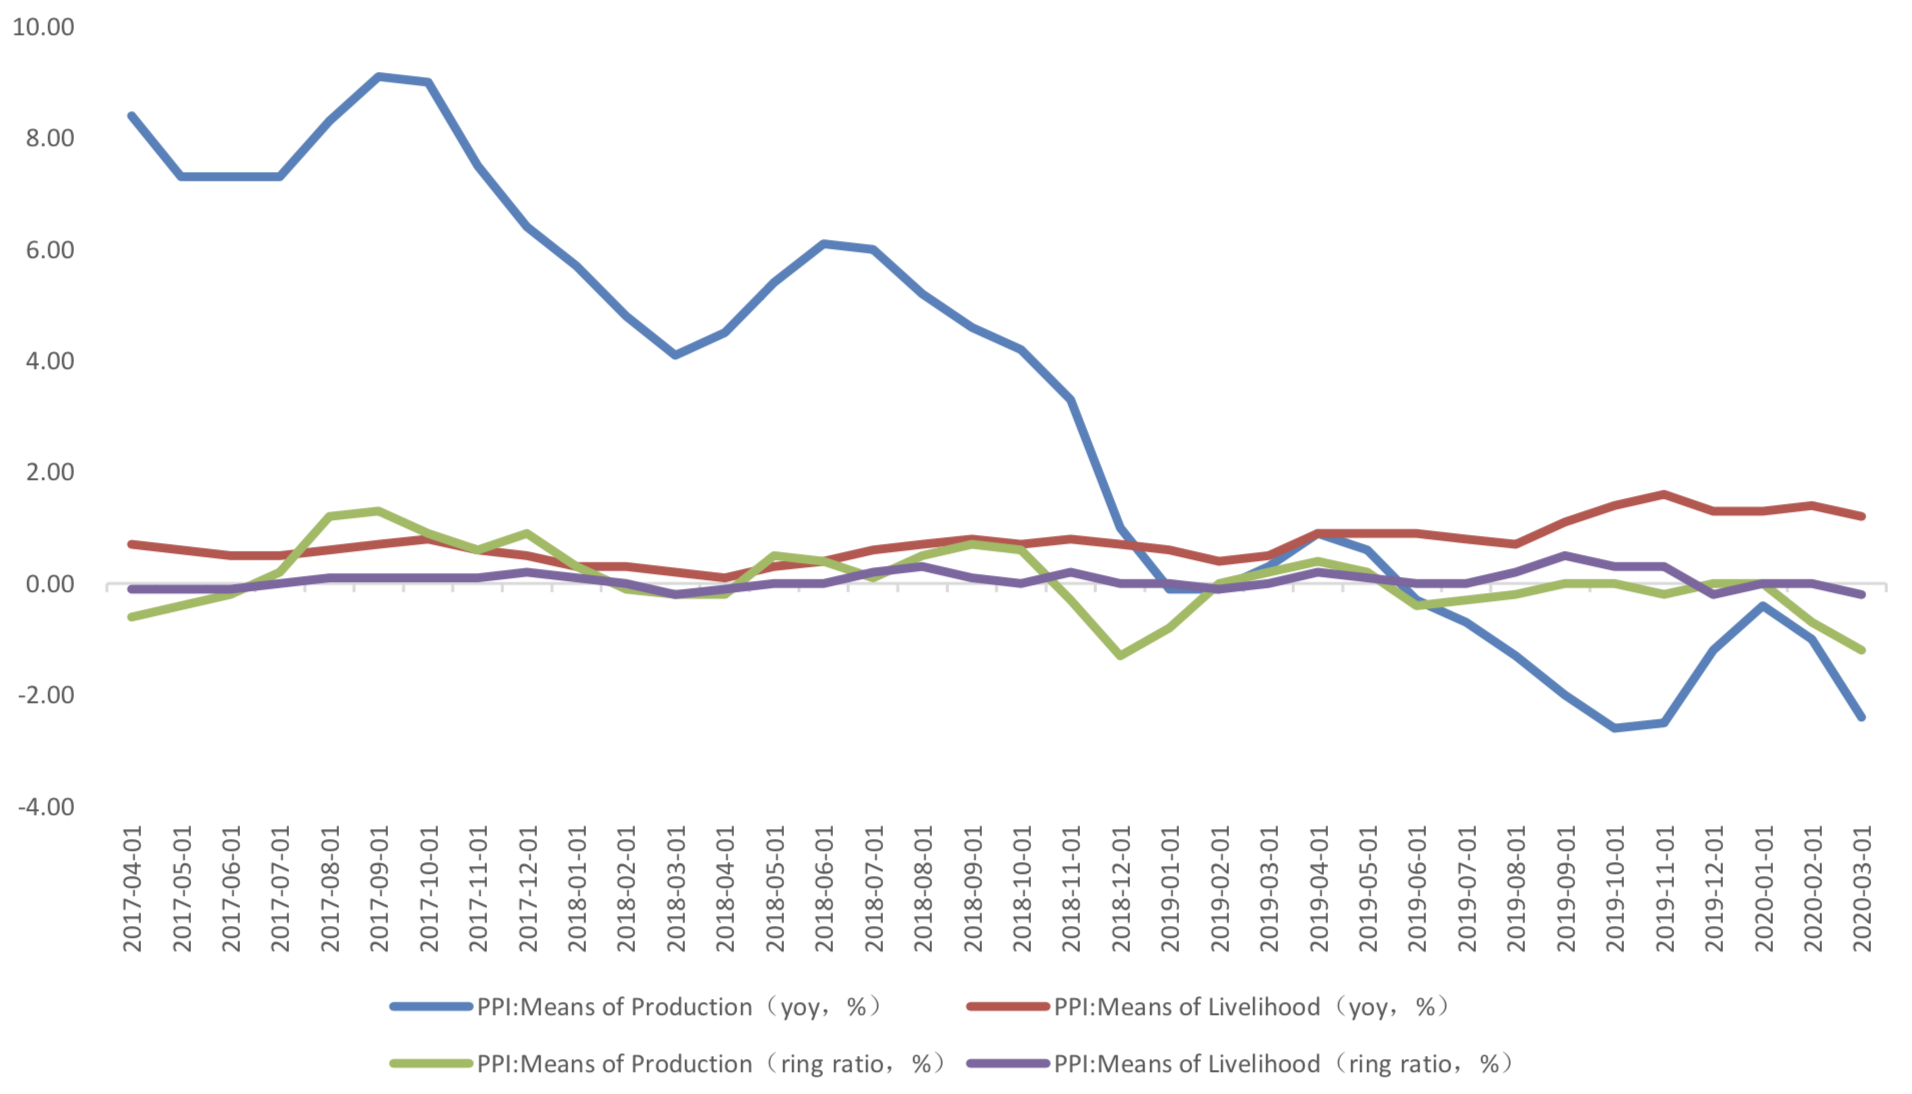
The means of production PPI was -2.4 percent year-on-year, decreased 1.4 percentage point from the previous month. The means of livelihoods PPI, was 1.2 percent, compared with the previous value of 1.4 percent.
Graph E: PPI Data, by means of production and means of livelihoods
(3) Summary
CPI growth narrowed, and food and non-food prices fell. The society is speeding up the pace of resumption of work and production, gradually resume logistics and transportation, and improve the supply of major food and consumer goods. The sharp drop in crude oil prices has led to a significant drop in retail fuel prices. The increase of core CPI indicates that the demand in related fields starts to recover after the domestic epidemic prevention and control situation improves.

Currently no Comments.
Hot Topics
The 13rd China International Future Forum
The Shanghai Derivatives Energy Forum has received extensive attention from relevant industries both within and outside the borders.
Financial institutions deep explore commodity market opportunities, commodity index financial products show full-scale trend
R-Code for analysis: getKDJ
New indicator to analyze the arbitrage opportunities between sse50 and csi500
R-Code@June 06, 2016
Market review: January 11, 2017
The Great China Bubble: Anniversary Lessons and Outlook
Quant Investment in China A-share market
The hedge strategy between SSE50 and A50--Jan 13,2017
The arbitraging strategy between CSI300 and SSE50
Market review: June 17, 2016
Sleepless in London--Enda Homan(Allied Irish Banks Plc)
MSCI Rebuffs Chinese Equities for Third Time in Blow to Xi
Soros, Druckenmiller among hedgies profiting in market plunge