FangQuant › Financial Futures
Market Summary:
Last week, there was generally decrease over the market. Shanghai SE Composite Index (000001.SH) changed -1.06 % to 2808.53. Specifically, small cap shares perform better than lagre cap shares and we can observe that CSI500 did better than SSE50 (-0.84% vs -1.18%). The average daily turnover of the whole market during past 5 trading days is 633.67 billion CNY, it increased 3.38% compared with the previous 5- trading day period.
The epidemic situation has caused serious impact but China's economy has an advantage over the growth rate of other regions in the world, and the investment value of Chinese assets is prominent. Under the macro background of gradual economic recovery and loose liquidity, the performance of a shares is worthy of expectation.
As for arbitrage opportunity, all futures current-month contracts show some room for arbitrage opportunities. No price spread for next-month/current month contracts show room for arbitrage.
News:
(1) Xinhua News Agency: Sheng Laiyun, deputy director of the National Bureau of Statistics: the fundamentals of China's long-term economic growth have not changed; in the face of economic downward pressure and unprecedented external shocks, we must increase the impact of policies, strengthen the joint efforts of macro policies, do a solid job in the "six stability" work, expand effective demand, smooth the economic cycle, and promote stable economic operation.
(2) China News: MSCI: China's share of Global trade has risen to 11% in 2018, and its weight in the MSCI Emerging Market Index reached over 34% by the end of 2019. China's economic recovery will have a greater impact on global stock markets than during the SARS in 2003.
(3) The Supreme People's Court issued the opinions on promoting the efficient trial of bankruptcy cases in accordance with the law, which requires giving full play to the institutional functions of different procedures such as reorganization, reconciliation and bankruptcy liquidation, strengthening the connection between the execution procedure and the bankruptcy procedure, and running the efficient trial of bankruptcy cases in accordance with the law through the process of promoting the active rescue and timely exit of market subjects, so as to better serve and guarantee The high-quality development of the national economy promotes the creation of a world-class business environment.
(4) 21st century economic report: hedge funds suffered net redemptions of more than $33 billion in the first quarter of this year, the largest single quarter redemptions since the second quarter of 2009, of which about 60% are investors dissatisfied with the poor performance of hedge funds.
(5) Economic Observer: star fund managers maintained more than 80% positions in the first quarter, most of which insisted on the mode of heavy position + leading position operation, and some of them increased the switching of pharmaceutical stocks to improve the risk prevention ability under the impact of the epidemic.
1. StockMarket
(1) Indices Performance
During last week, Shanghai SE Composite Index (000001.SH) changed -1.06 % to 2808.53, Shenzhen Component Index (399001.SZ) changed -0.99 % to 10423.46, ChiNext Price Index (399006.SZ) changed - 0.84 % to 2003.75, CSI 300 INDEX (000300.SH) changed -1.11 % to 3796.97, CSI SmallCap 500 index (000905.SH) changed -0.84 % to 5273.55, SSE 50 Index (000016.SH) changed -1.18 % to 2776.02.
Graph 1: Indices Performance over past 3 months

The average daily turnover of the whole market during past 5 trading days is 633.67 billion CNY, it increased 3.38% compared with the previous 5-trading day period.
Graph 2: Market turnover

(2) Sectors Performance
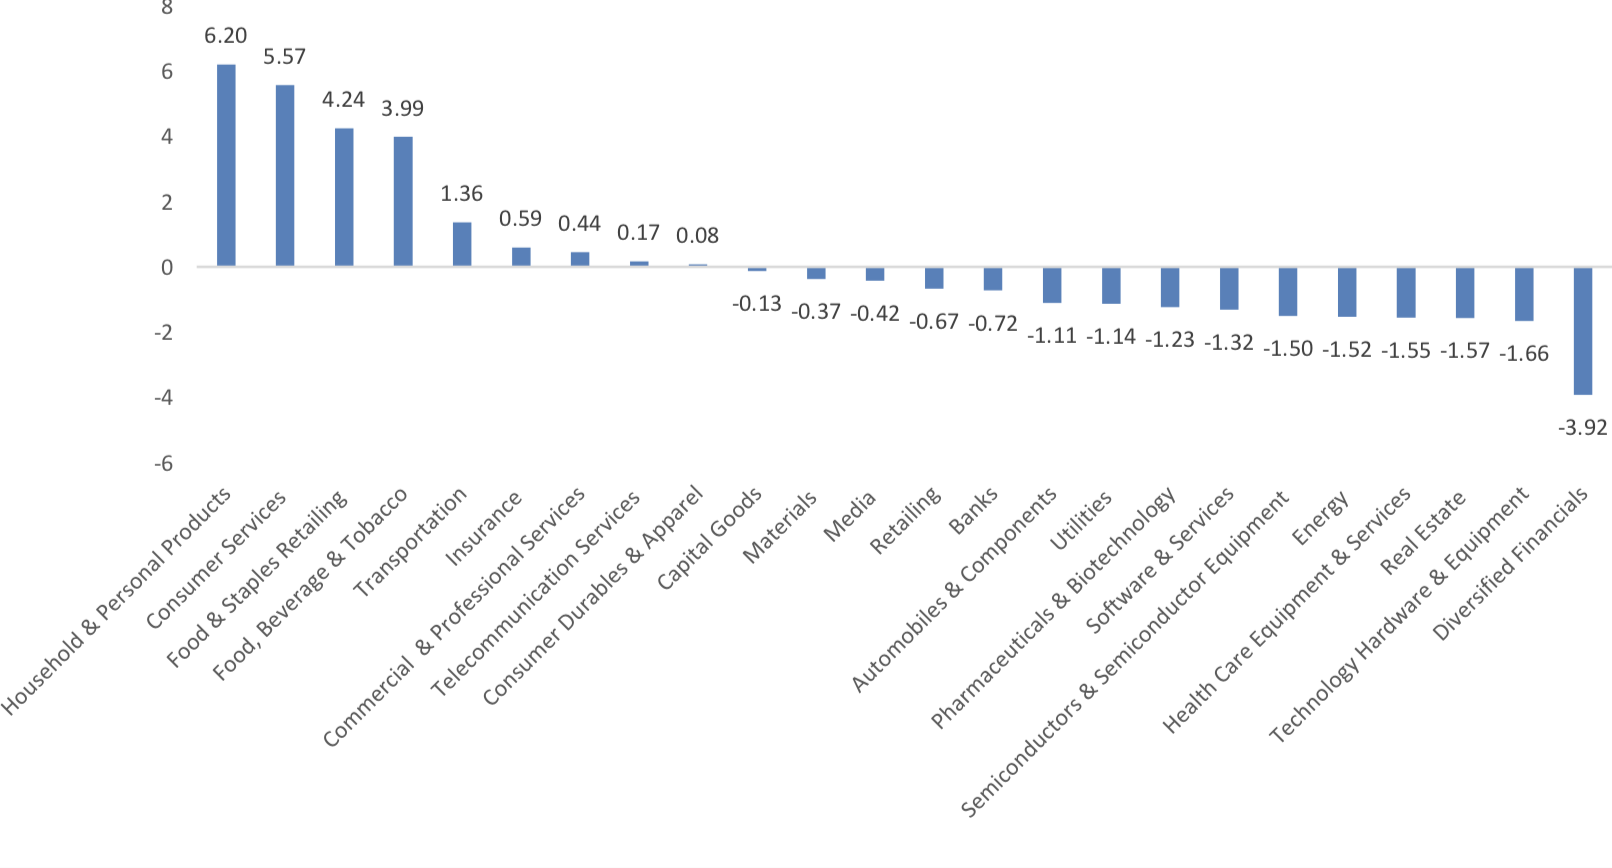
In the view of sectors, during last week (from 2020-04-17 to 2020-04-24), 9 of 24 Wind Level-2 sector(s) increased while 15 sector(s) dropped. Specifically, Household & Personal Products(6.20%), Consumer Services (5.57%) and Food & Staples Retailing (4.24%) did the best performance while Diversified Financials(-3.92%), Technology Hardware & Equipment(-1.66%) and Real Estate (- 1.57%) did the worst performance.
Graph 3: Sectors performance under Wind Level-2 classification (%)
(3) Indices Valuation (TTM)
The current PE for SSE Composite Index, Shenzhen Component Index, GEM Index, CSI300, SSE50, CSI500 are 11.9946, 25.2389, 53.1780, 11.3119, 8.8300, 26.4120respectively; and these indices are at 9.50%, 36.70%, 67.70%, 12.20%, 5.60%, 37.90% percent rank level of their historic data, respectively
Graph 4: PE of 6 indices
Graph 5: PE percent rank of 6 indices (calculated by data of past 1200 trading days, only 1Y data is presented on the graph)
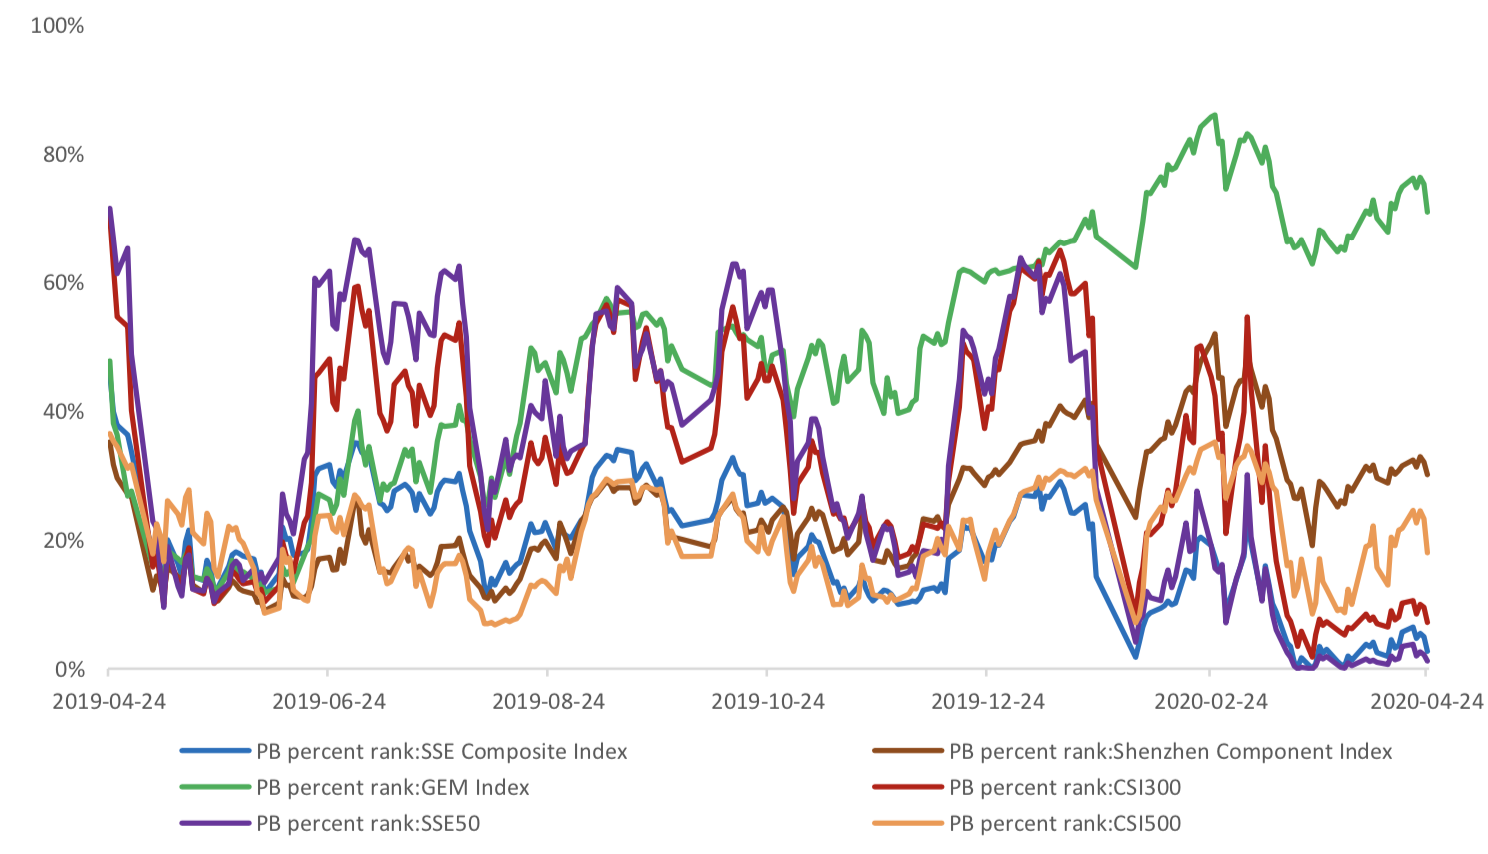
The current PB for SSE Composite Index, Shenzhen Component Index, GEM Index, CSI300, SSE50, CSI500 are 1.2674,2.6333,5.9888,1.3402,1.0652, 1.8107respectively, and these indices are at 2.70%, 30.10%, 70.90%, 7.20%, 1.20%, 18.00% percent rank level of their historic data, respectively.
Graph 6: PB of 6 indices
Graph 7: PB percent rank of 6 indices (calculated by data of past 1200 trading days, only 1Y data is presented on the graph)
(4) Foreign Fund Flow
During last 5 trading days the total foreign fund flow via Stock Connect is 2.42 billion RMB, and the cumulative inflows was 1023.86 billion RMB. Specifically, the fund flow via Shanghai-Hong Kong Stock Connect is 1.86 billion RMB and the fund flow via Shenzhen-Hong Kong Stock Connect is 0.55 billion RMB.
Graph 8: Fund flow via both Shanghai and Shenzhen-Hong Kong Stock Connect in past 1M (100 million CNY)
Graph 9: Fund flow via Shenzhen-Hong Kong Stock Connect in past 1M (100 million CNY)
Graph 10: Fund flow via both Shanghai-Hong Kong Stock Connect in past 1M (100 million CNY)
(5) Margin Trading
According to the newest data, the margin financing balance is 1045.33 billion, securities borrowing is
21.88 billion, totally 1067.21 billion.
Graph 11: Margin Trading(100m RMB)
2. Index Futures
(1) Trading Volume and Open Interests
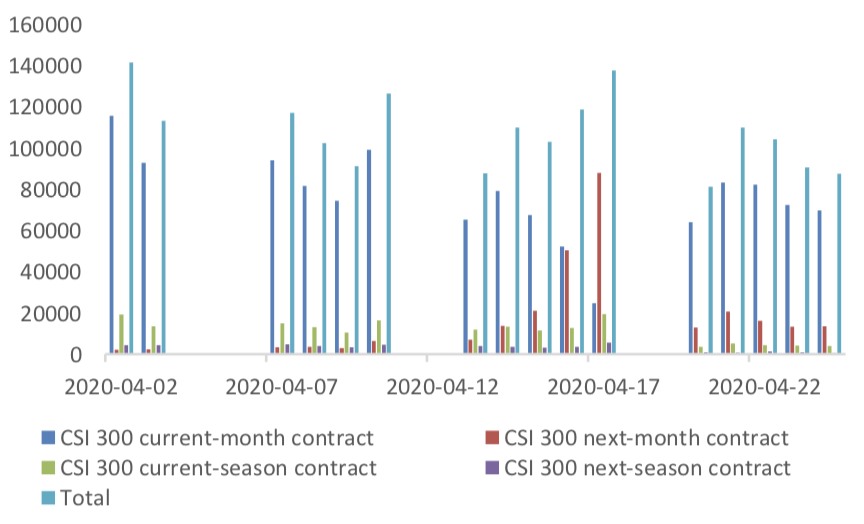
During past 5 trading days the average trading volume for CSI300(IF), SSE50(IH), CSI500(IC) contracts
are 94782 (-14.94%, the previous 5-trading day period),34942 (-20.47%),115880 (-15.40%) lots, respectively. On the last trading day, the total open interests for them are 139325 (-5.93%),61200 (- 7.08%),190237 (2.66%) lots respectively.
Graph 12: CSI300 Index futures’ trading volume


Graph 13: CSI300 Index futures’ open interests
Graph 14:SSE50 Index futures’ trading volume
Graph 15: SSE50 Index futures’ open interests
Graph 16: CSI500 Index futures’ trading volume
Graph 17: CSI500 Index futures’ open interests
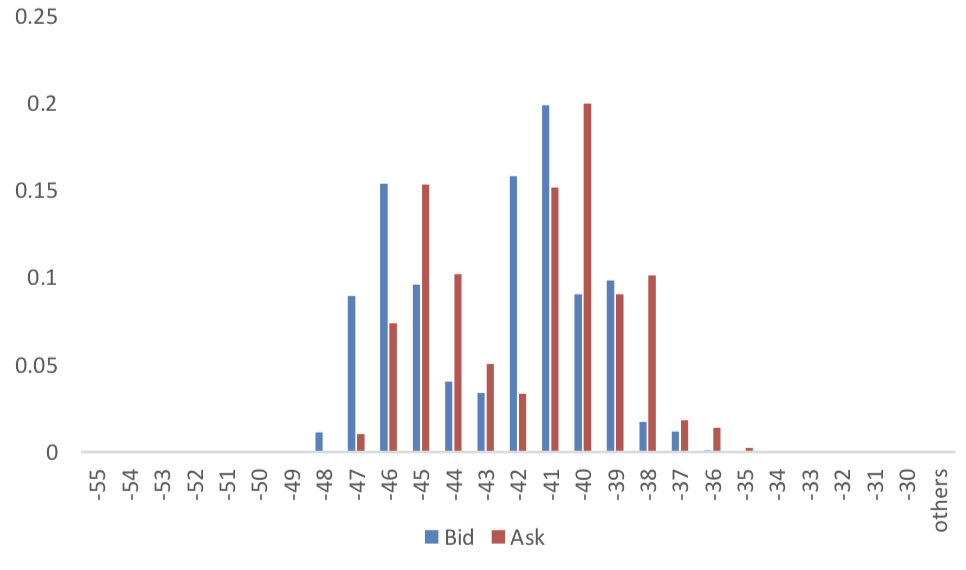
(2) Roll Level Bid-Ask Distribution Worked form last 5 trading days.
Graph 18: CSI300 Current/Next Month Contract Roll Spread Distribution (2s frequency)
Graph 19: SSE50 Current/Next Month Contract Roll Spread Distribution (2s frequency)


Graph 20: CSI500 Current/Next Month Contract Roll Spread Distribution (2s frequency)
Assumption: risk-free rate: 3%; security borrowing cost: 8%; trading expense for spot: 0.025%; trading expense for futures: 0.005%; margin rates for futures contracts: 0.11 for CSI300 and SSE50, 0.13 for CSI500; margin rate for security borrowing: 0.3 (or 130% maintain rate).
When real price spread is out of theoretical range (calculated by our assumption), there exists absolute future-spot arbitrage opportunity.
Graph 21: Future (Current Month)-Spot Arbitrage Opportunity for CSI300 contract (in the view of price difference)
Graph 22: Future (Current Month)-Spot Arbitrage Opportunity for SSE50 contract (in the view of price difference)
Graph 23: Future (Current Month)-Spot Arbitrage Opportunity for CSI500 contract (in the view of price difference)
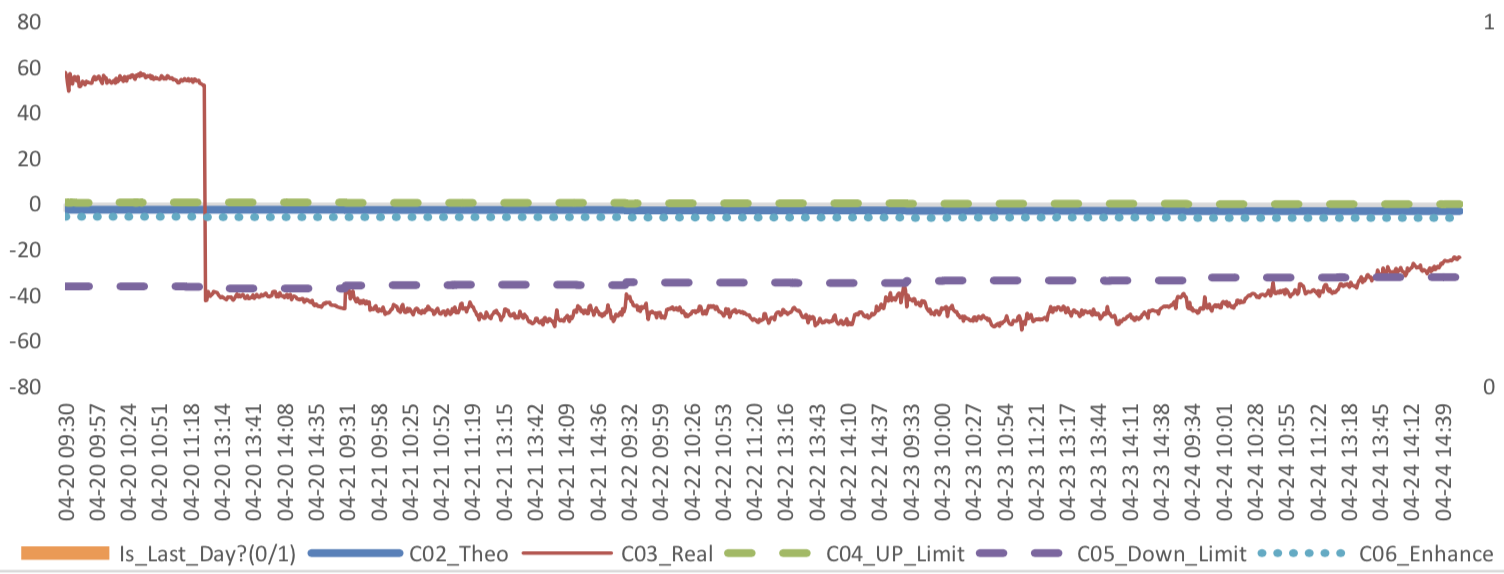
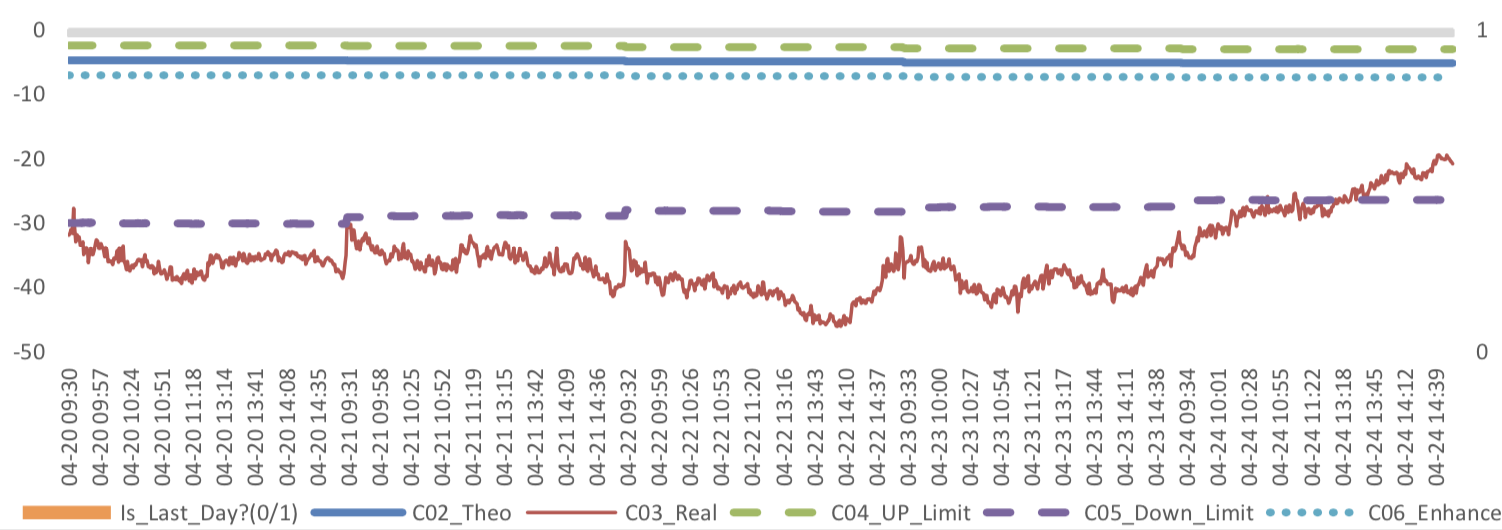
Graph 24: Future (Next Month-Current Month) Arbitrage Opportunity for CSI300 contract (in the view of price difference)
Graph 25: Future (Next Month-Current Month) Arbitrage Opportunity for SSE50 contract (in the view of price difference)
Graph 26: Future (Next Month-Current Month) Arbitrage Opportunity for CSI500 contract (in the view of price
difference)
(4) Roll Spread of Stock Index Futures Tracking
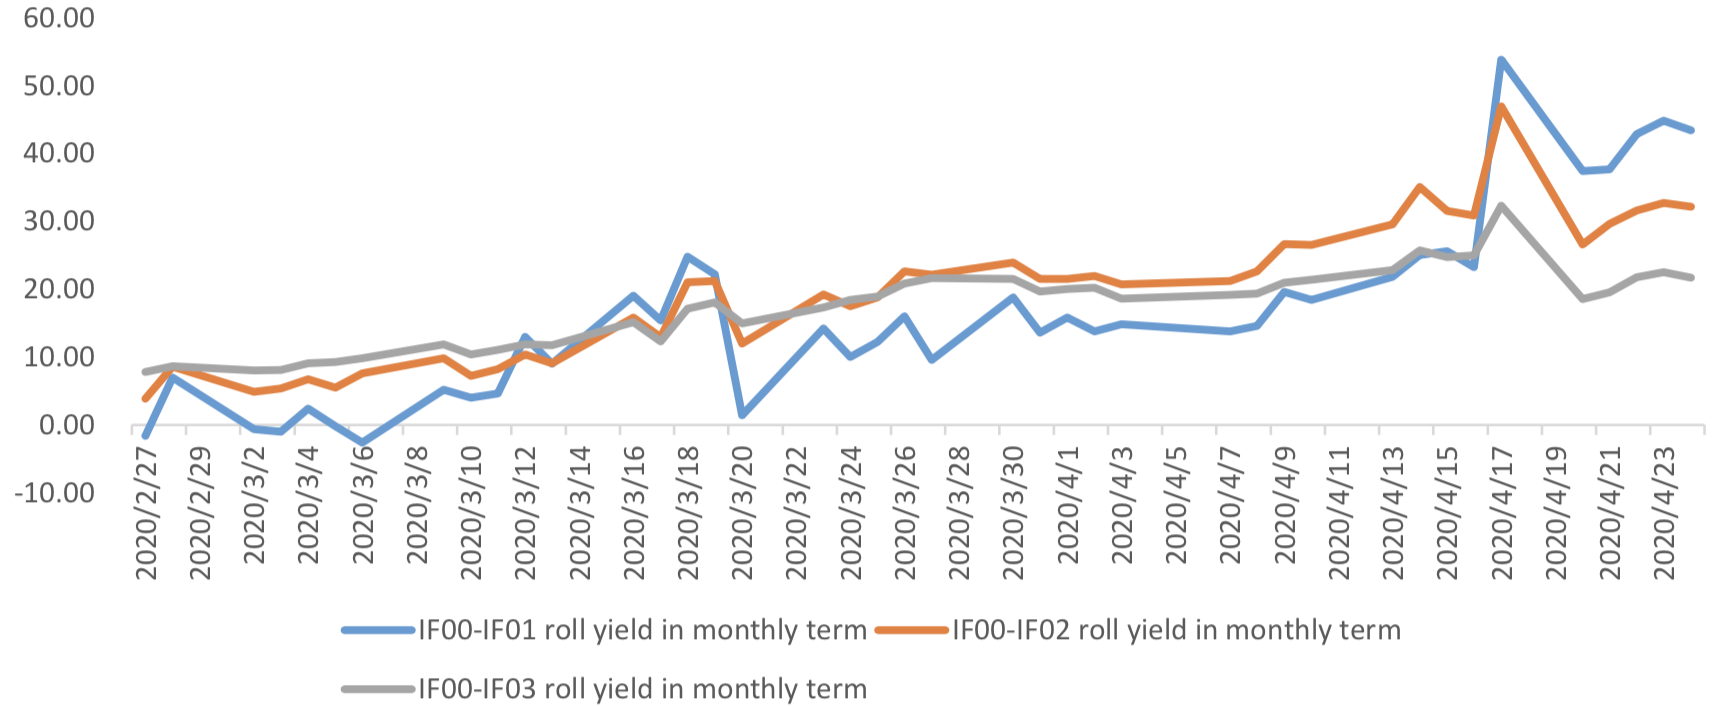
Calculated as the contract price of the current month minus the contract price of the following month, for the long roll, the positive calculation results are gains, the negative calculation results are losses. Code 00 in the figure represents the current month contract, 01 the next month contract, 02 the current quarter contract, 03 the next quarter contract.
(a)IF
Up to2020/4/24,the best roll plan is IF00-IF01,annualized roll yield in monthly term is13.72%。
Graph 27: IF Current month contract roll yield comparison (index point)


Graph 28: IF Current month contract roll yield comparison (annualized return)
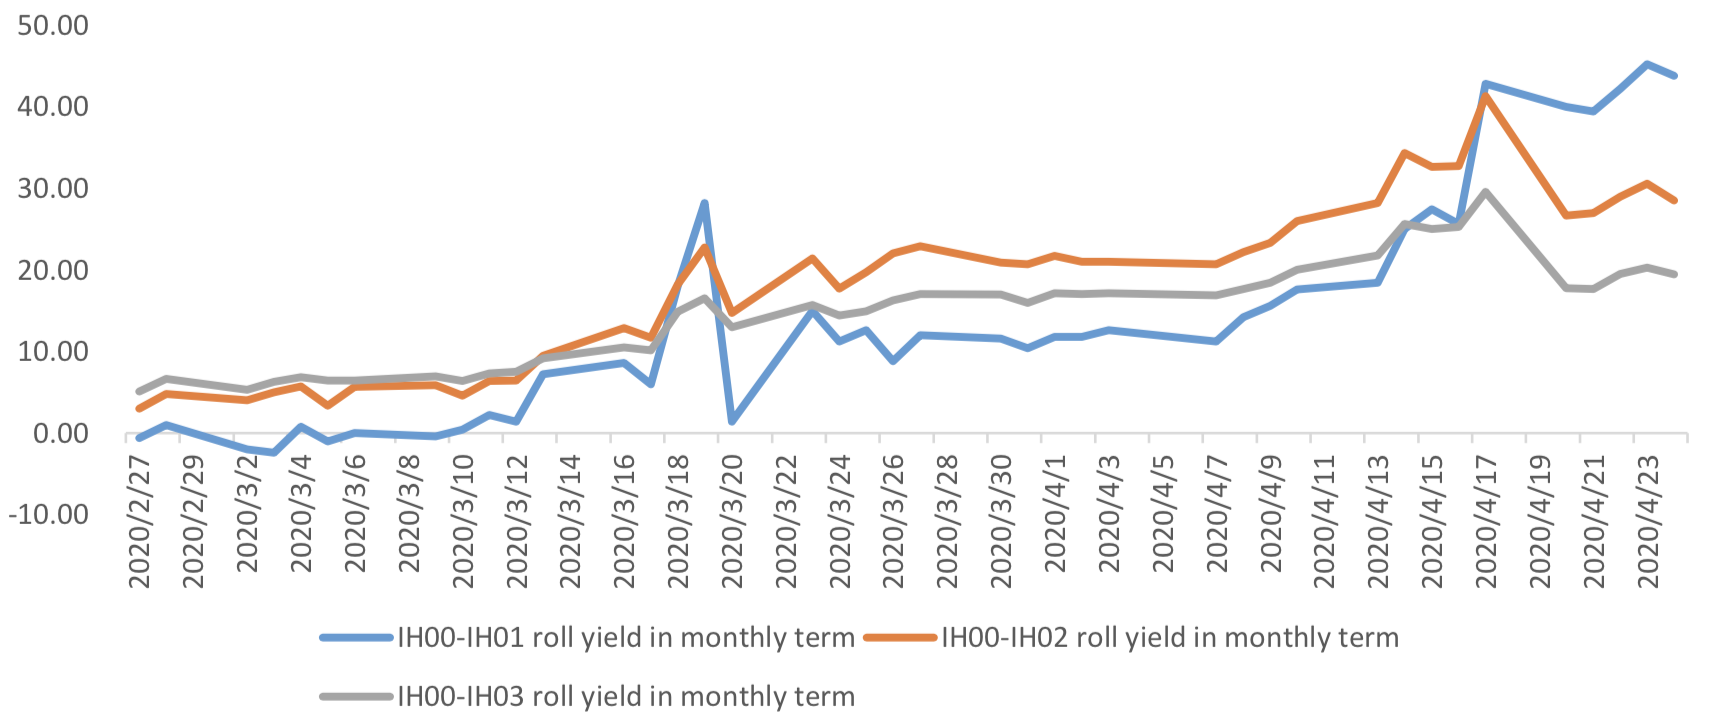
(b)IH
Up to 2020/4/24,the best roll plan is IH00-IH01,annualized roll yield in monthly term is18.93%。
Graph 29: IH Current month contract roll yield comparison (index point)
Graph 30: IH Current month contract roll yield comparison (annualized return)
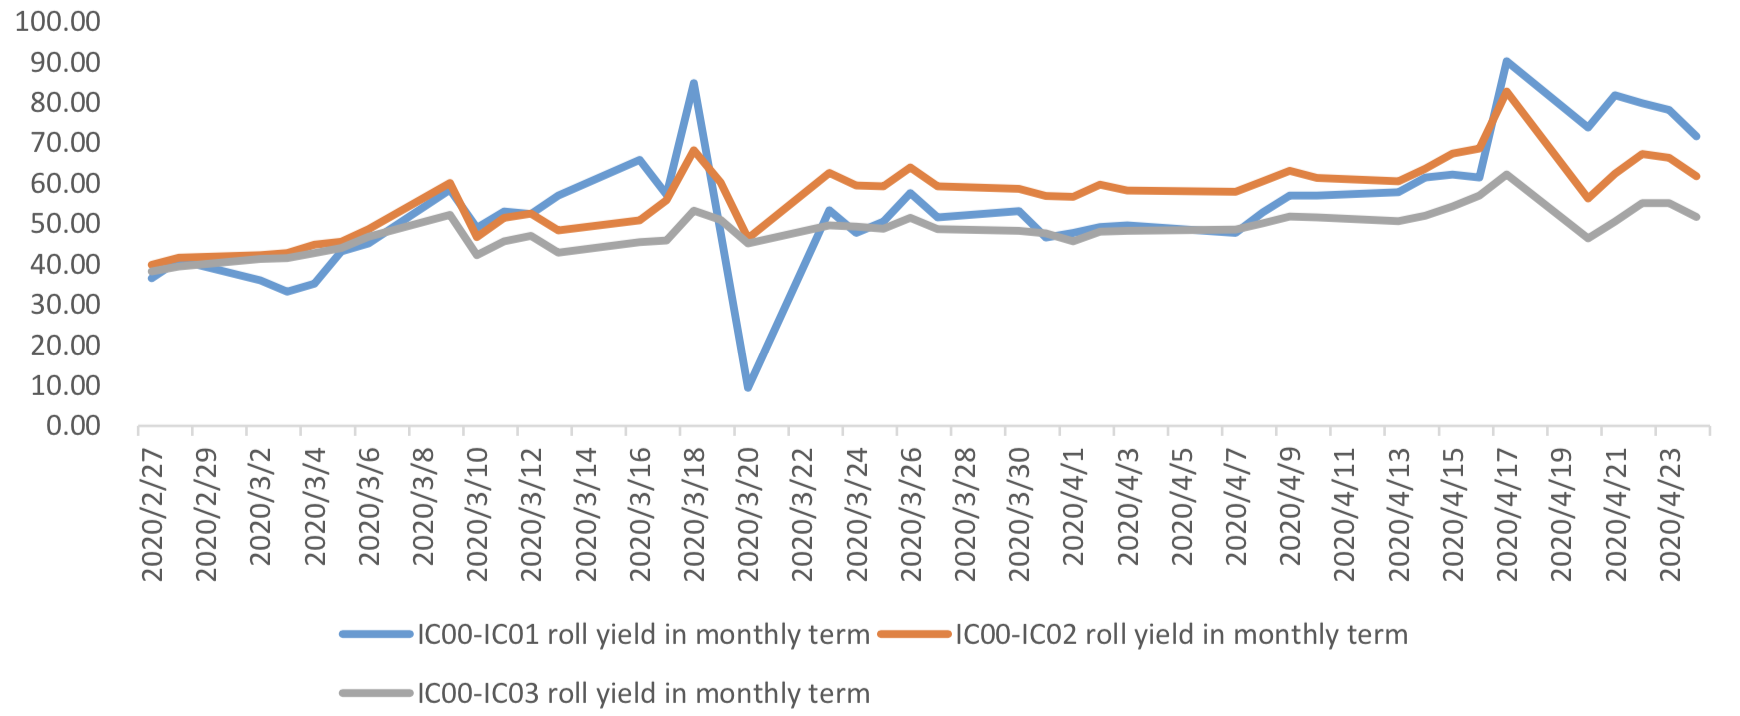
(c)IC
Up to2020/4/24,the best roll plan isIC00-IC01,annualized roll yield in monthly term is16.29%。
Graph 31: IC Current month contract roll yield comparison (index point)
Graph 32: IC Current month contract roll yield comparison (annualized return)
(5) Basis Tracking of Stock Index Futures
For long side, if the base difference is positive, the change of the base difference brings losses, and if the base difference is negative, the change of the base difference brings profits.
(a)IF
For long side hedge, up to 2020/4/24, all IF contracts were in discount except for IF00. Here IF next month contract basis return annualized yield is 12.15%。
Graph 33: IF contracts basis
Table 1: IF basis return calculation
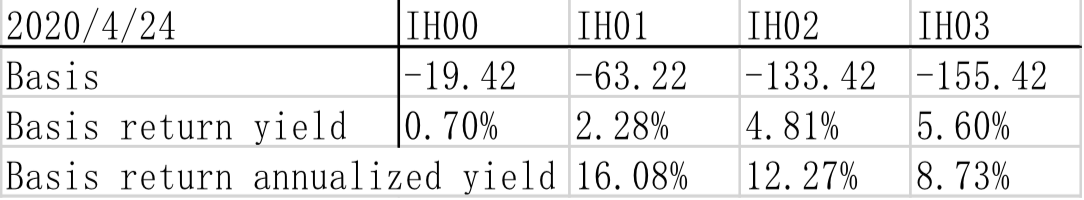
(b)IH
For long side hedge, up to 2020/4/24,all IH contracts were in discount except for IH00. Here IH next
month contract basis return annualized yield is 16.08%。
Graph 34: IH contracts basis
Table 2: IH basis return calculation


(c)IC
For long side hedge, up to 2020/4/24, all IC contracts were in discount except for IC00. Here IC next
month contract basis return annualized yield is 17.26%。
Graph 35: IC contracts basis
Table 3: IC basis return calculation


3. Financial Markets
(1) Interest Rates
Graph 36: Term Structure Evolvement of Treasury Bonds Yields During Recent 3 Months (%)
Graph 37: Term Structure Evolvement of Shibor Rates During Recent 3 Months (%)
(2) ExchangeRates
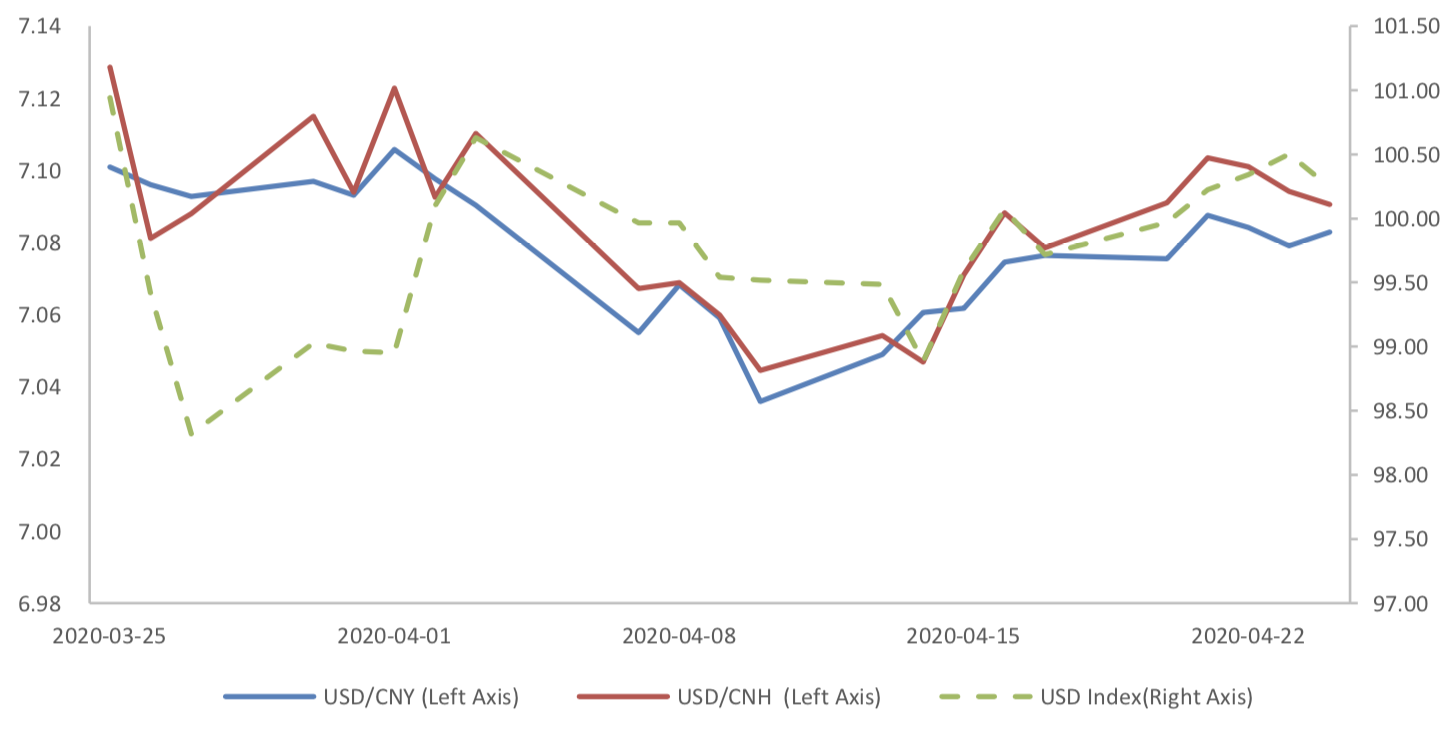
During last week, CNY/USD changed 0.092% to 7.0829 and offshore rate, CNH/USD, changed 0.17% to 7.0906 and USD index changed 0.53%.
Graph 38: USD/CNY, USD/CNH and USD Index
Macroeconomic Topic:
Due to the epidemic situation economic data show a total decrease. Data released by the National Bureau of Statistics show that in March, the added value of industries above scale decreased by 1.1% in terms of monthly year-on-year ratio, with the pre-value of -25.87%; in January-March, the national fixed assets investment decreased by 16.1% in nominal terms, with pre-value of -24.5 %; and in March, the total retail sales of consumer goods decreased by 15.8% in terms of monthly year-on-year ratio, with pre-value of -20.5%.
March Economic Data
(1) Fixed Assets Investment
From January to March, the cumulative growth rate of fixed assets investment was -24.5% year-on-year, show a sharp decrease due to COVID-19.
Graph A: Investment Completion of Fixed Assets (100m RMB)
Graph B: Investment Completion of Real Estate Development, Manufacturing Industry, Infrastructure Construction
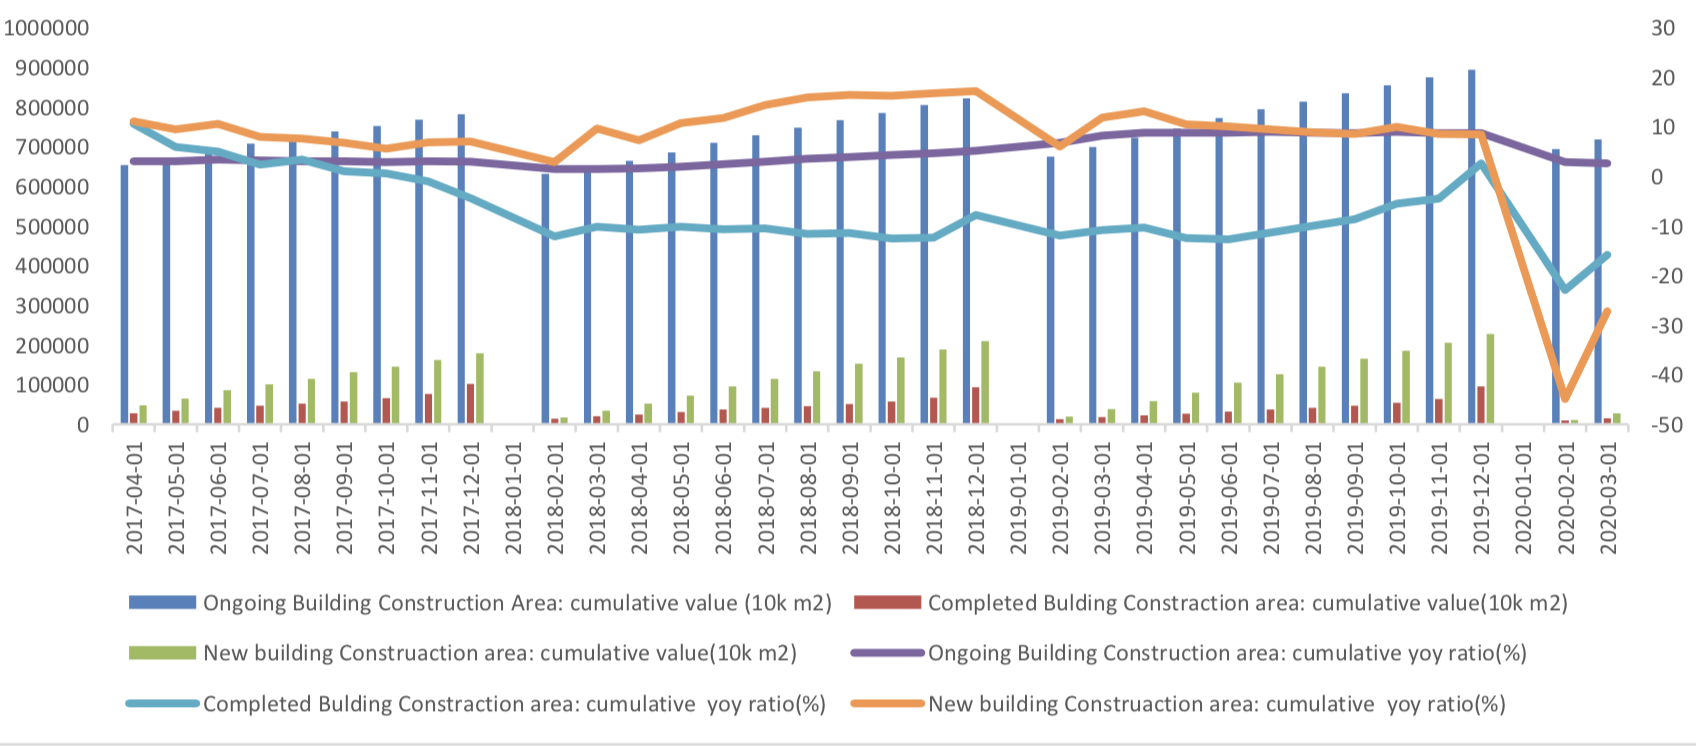
From January to March, investment in infrastructure (excluding electricity) decreased by 19.7% year- on-year, with pre-value of -30.3%.
From January to March real estate investment decreased by 7.7% year-on-year.
Graph C: Build Construction Data
From January to March, manufacturing investment decreased by 25.2% year-on-year.
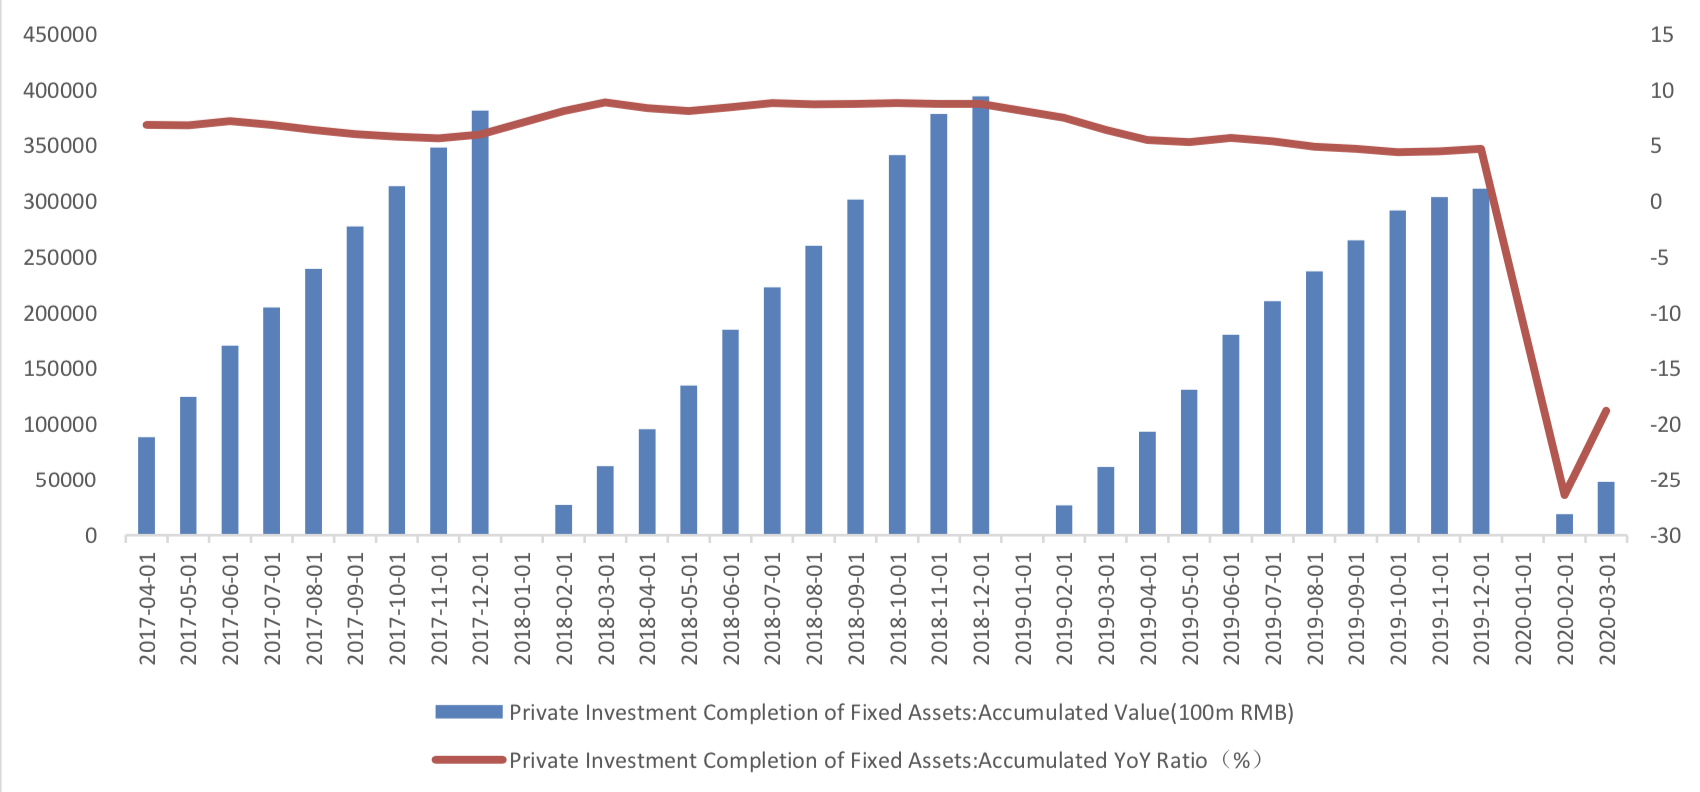
Private investment completion of fixed assets decreased. From January to March, the cumulative growth rate of private fixed assets investment was -18.8% year-on-year.
Graph D: Private Investment Completion of Fixed Assets
(2) Industrial Value Added
In March, the value added of industries above the designated size decreased by 1.1% year on year.
Graph E: Industrial added value above designated size: Monthly YoY Ratio (%)
(3) Consumption
In March, the nominal growth rate of total retail sales of social consumer goods rose to -15.8% from 8%, while the cumulative growth rate in January-March also rose to -19%.
Graph F:Total Retail Sales of Consumer Goods


Currently no Comments.
Hot Topics
The 13rd China International Future Forum
The Shanghai Derivatives Energy Forum has received extensive attention from relevant industries both within and outside the borders.
Financial institutions deep explore commodity market opportunities, commodity index financial products show full-scale trend
R-Code for analysis: getKDJ
New indicator to analyze the arbitrage opportunities between sse50 and csi500
R-Code@June 06, 2016
Market review: January 11, 2017
The Great China Bubble: Anniversary Lessons and Outlook
Quant Investment in China A-share market
The hedge strategy between SSE50 and A50--Jan 13,2017
The arbitraging strategy between CSI300 and SSE50
Market review: June 17, 2016
Sleepless in London--Enda Homan(Allied Irish Banks Plc)
MSCI Rebuffs Chinese Equities for Third Time in Blow to Xi
Soros, Druckenmiller among hedgies profiting in market plunge